
Why MNI
MNI is the leading provider
of intelligence and analysis on the Global Fixed Income, Foreign Exchange and Energy markets. We use an innovative combination of real-time analysis, deep fundamental research and journalism to provide unique and actionable insights for traders and investors. Our "All signal, no noise" approach drives an intelligence service that is succinct and timely, which is highly regarded by our time constrained client base.Our Head Office is in London with offices in Chicago, Washington and Beijing, as well as an on the ground presence in other major financial centres across the world.
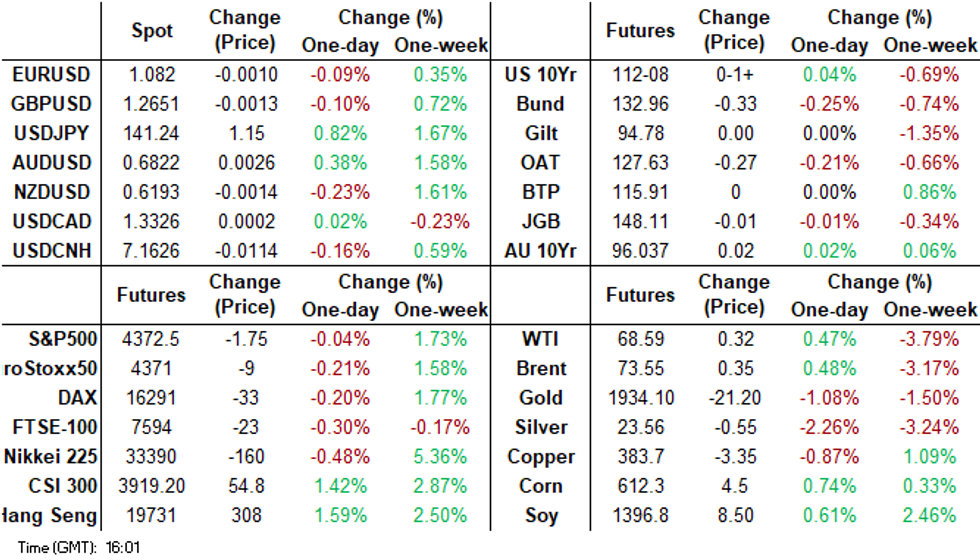
- USD/CNH is sharply down from earlier fresh highs above 7.1900, last near 7.1650, as onshore equities have returned from the lunchtime break with a strong positive tone. CSI 300 is up comfortably over 1%. May activity data was disappointing, but the onshore media keep pushing for fresh stimulus.
- The AUD/USD is higher, with some positive spill over from higher iron ore, (last $113/ton), which is related to China optimism. However, the May jobs beat has also seen RBA terminal rate expectations rise. ACGB's sit 6-12bps cheaper across the major benchmarks, the curve has bear flattened.
- This has spilled over to Cash tsys, which sit 2-6bps cheaper across the major benchmarks. The curve has bear flattened. Some carry over is also likely from Wednesday's hawkish hold from the FOMC. USD/JPY has pushed to fresh YTD highs, despite fresh verbal jawboning from the authorities around excessive FX moves.
- In Europe today the latest ECB monetary policy decision is due (+25bps expected). Further out a slew of data crosses including Retail Sales, Terms of Trade, Initial Jobless Claims and Empire Manufacturing.
MARKETS
US TSYS: Pressured In Asia
TYU3 deals at 112-20+, -0-07+, a touch off the bottom of the observed 0-12+ range observed on volume of ~73k.
- Cash tsys sit 2-6bps cheaper across the major benchmarks. The curve has bear flattened.
- Tsys have been pressured through the Asian session. Spillover from ACGB's, in lieu of stronger than forecast Australian Employment data weighed.
- In recent dealing losses have marginally extended as USD firms led by a USD/JPY which is up ~0.9%. However, Wednesday's post-FOMC lows remain intact for now.
- In Europe today the latest ECB monetary policy decision is due. Further out a slew of data crosses including Retail Sales, Terms of Trade, Initial Jobless Claims and Empire Manufacturing.
JGBS: Futures Off Highs But Outperforming Weaker US Lead
JBG futures sit comfortably off session highs, last at 148.15, +3. We haven't been to sustain breaks sub 148.10, despite an offered tone to TYU3, which is back to 112-21d, -06, not too far from NY session lows on Wednesday.
- In the cash bond space, we are lower in yield terms, but only marginally, and remain well within recent ranges. The 10yr around 0.425%, the 20yr near 1.00% and 40yr close to 1.39%.
- The swap space is seeing slightly firmer yield moves, the 10yr back to 0.593% at the time of writing, although we remain sub recent highs just above 0.6000%.
- Rinban purchases totaled ¥1.3tn earlier, while we also had a 3 month t-bill auction (see this link).
- The domestic focus today has been on fresh FX weakness, which has seen USD/JPY climb to fresh YTD highs. Verbal rhetoric from the authorities has picked up, but hasn't altered the trend at this stage.
- Tomorrow, we have the BoJ outcome, with no major changes expected, see our preview here.
- The opposition is also expected to put forward a no-confidence motion, which could see PM Kishida call an early election.
MNI BoJ Preview - June 2023: On Hold, Inflation Outlook & YCC In Focus
- We are in line with the broad consensus that looks for no change at this week’s meeting. Market expectations have moved away from a potential YCC tweak this week, with July now seen as a more likely window for an adjustment. Our recent bias has leant into a July YCC tweak, when the Bank will have its revised economic projections to hand.
- An upward revision to the inflation outlook is likely at the July policy meeting. This could pave the way for a YCC shift, which is the rough sell-side consensus.
- Whilst Ueda has stated that Japan has still not achieved sustainable 2% underlying inflation, the April inflation forecasts look too low and the BoJ’s own in house research is suggesting changing price pass-through behaviour from corporates.
- Full preview here:
JAPAN DATA: Export Growth Beats, But Still At Slowest Pace Since Early 2021
Japan May trade figures were reasonably close to expectations in terms of the aggregate figures. The trade deficit was -¥1372.5bn, slightly wider than forecast -¥1286.8bn. In adjusted terms we were slightly better than expected (-¥777.8bn, versus a -¥860bn forecast). Export growth was better than forecast, +0.6% y/y, (-1.2% consensus), but it still showed slowing momentum in y/y terms. We are now back to early 2021 levels from an export growth standpoint.
- By country/region, export growth held up better for the US +9.4% y/y and the EU+16.6% y/y, but was negative for China -3.4% y/y, and Asia (-8.1%).
- Import growth was close to expected at -9.9% y/y (forecast -10.3%).
- Other data out showed core machine orders up 5.5% m/m for Apr, better than projected (3.0%), but the y/y pace was still comfortably negative, -5.9% y/y.
AUSSIE BONDS: Pressured After Unemployment Rate Ticks Lower
ACGB's sit 6-12bps cheaper across the major benchmarks, the curve has bear flattened.
- Futures are also pressured, XM (-0.066) and YM (-0.118).
- The May Labour Report showed a net gain of 75.9k jobs with the unemployment rate ticking unexpectedly lower to 3.551% falling 0.13% on the month.
- Earlier in the session June Consumer Inflation Expectations held steady at 5.2%.
- RBA Dated OIS now price a terminal rate of 4.56% in December.
- The domestic data calendar is empty tomorrow.
AUSTRALIAN DATA: Persistent Labour Market Tightness, RBA Meetings Remain “Live”
May employment was significantly stronger than expected at +75.9k after a 4k drop in April. It was driven by rises in both full-time (+61.7k) and part-time (+14.3k). The unemployment rate fell to 3.6% while the participation rate rose to 66.9%. This is strong data and signals that April weakness was not a new trend and that the labour market is very tight. So the RBA is likely to tighten further, especially given week’s survey inflation indicators.
- The unemployment rate fell to 3.551%, and so was almost 3.5%, from 3.68% in April – a drop of 0.13pp. The participation rate reached a new series high, which makes this unemployment result even more significant. The rate was driven down by strong jobs plus a 16.5k drop in the number of unemployed, which is now -6.4% y/y.
- In 2023 to date there have been 220k new jobs and employment growth is +3.4% y/y with full-time (FT) +4.1% y/y. 3-month momentum continues to rise for both the total and FT.
- Hours worked fell 1.8% m/m after rising for the three prior months and +2.7% m/m in April. They are +4.8% y/y and 3-momentum is very positive. The ABS noted that labour shortages are being partially met by employees working more hours.
- The only negative spot in the report was the rise in underemployment to its highest since February 2022 but at 6.4% remains historically low. Underutilisation rose to 10%, the third straight increase and the highest since April 2022.
- Population grew another 0.2% m/m to reach a new series high of 2.7% y/y but the employment-to-population ratio rose to a new record. Rising labour supply is helping with shortages and there still seems to be lots of jobs for immigrants, but housing is struggling to meet the demand.

Source: MNI - Market News/ABS
Australia underemployment rate vs underutilisation %

Source: MNI - Market News/ABS
NZGBS: Marginally Richer After Technical Recession Confirmed
NZGB's have finished dealing 1-2bps richer across the major benchmarks, the curve has bull flattened.
- This mornings Q1 GDP print confirmed a technical recession in New Zealand. The Q/Q print was in line with expectations at -0.1%, and the Y/Y print was a touch lower than expected at +2.2%.
- NZGBs head post GDP gains through the session.
- Terminal RBNZ rate pricing has ticked lower in OIS markets. A terminal rate of 5.61% is now seen against 5.64% pre data, there are also ~40bps of cuts priced for 2024.
- On the wires early tomorrow we have May BusinessNZ Mfg PMI, there is no estimate and the prior read was 49.1
NZ DATA: Technical Recession, Details Not As Soft Though
GDP fell 0.1% q/q in Q1 after -0.7 in Q4, which was in line with consensus but weaker than the RBNZ’s 0.3% forecast. On a year ago it rose 2.2%, which was lower than expected as Q1 2022 was revised up to +0.1% q/q from -0.5%. The other quarters of 2022 were revised down. Expenditure-based GDP fell 0.2% q/q after -0.9% to be up 1.8% y/y down from 2.4%. While this means that NZ is technically in recession, the details look better with robust Q1 domestic demand and the weakness due to a large inventory drawdown. But the economy is clearly slowing.
- It is difficult to ascertain how much of the Q1 developments are underlying trends, data volatility or due to recent weather events (regional data isn’t provided). Stats NZ said that the data “included the initial impacts of Cyclones Hale and Gabrielle and teachers’ strikes”, which drove falls in horticulture and transport support & education services.
- Private consumption rose 2.4% q/q, driven by overseas travel, after being flat in Q4 and contributed 1.5pp to quarterly growth. Investment increased 2% q/q after -1% and contributed 0.5pp, driven by GFCF in non-residential assets (possibly post-cyclone repair). Domestic demand contributed 2pp to growth after detracting 0.8pp in Q4.
- Q1 inventories detracted 1.5pp from growth, the third consecutive negative quarter. This was the largest detraction since the pandemic-impacted Q4 2021 and implies that Q2 should see a stock build.
- Net exports detracted 0.1pp after -1.2pp the previous quarter with exports down 2.5% q/q, driven by services, and imports -1.6%.
- Production GDP fell 0.06% and so given that revisions are usual, there is a chance that it could be revised to zero or even to a positive.

Source: MNI - Market News/Refinitiv
FOREX: USD/JPY To Fresh YTD Highs Despite Verbal Jawboning, A$ Up On Jobs Beat
The USD has traded with a firmer bias in Asia Pac today, the BBDXY back close to 1232.00 at the time of writing, +0.25% versus NY closing levels. This is well above pre FOMC levels from Tuesday's sessions with US yield moves supporting gains, as the market digested the hawkish FOMC on hold outcome (better AU jobs data also helped these moves). Cash US Tsy yields gains have accelerated this afternoon, the 2yr back to 4.74% (+5bps). Only AUD is tracking higher against the USD at this stage.
- USD/JPY broke through 141.00 earlier, which prompted fresh verbal rhetoric from the Japan authorities. This saw the pair consolidate, but we have since move to fresh highs of 141.33.
- US yield moves we aided by higher AU yields which came post the AU May jobs beat. This helped bring AUD/USD up from lows sub 0.6770, to be last around 0.6800/05, fresh highs for the session. RBA terminal pricing has risen.
- NZD/USD has faltered, weighed by a slightly weaker than expected Q1 GDP report, which confirmed the economy was in a technical recession. The detail wasn't too bad though. NZD/USD saw support ahead of 0.6160, last tracking near 0.6180, still -0.50% for the session.
- EUR/USD sits around 1.0810/15 currently, not far from session lows.
- This comes ahead of the ECB meeting later, which is expected to delivery a 25bps hike. Later US May retail sales, trade prices, IP/capacity, business inventories, Empire & Philly indices and jobless claims print.
EQUITIES: Another Day, Another Fresh High For Japan Stocks
Regional equities haven't been a focus point today, with the dollar and yield backdrop taking center stage. Recent themes have persisted though, with Japan equities pushing higher again, while HK and China are also higher. Trends are mixed elsewhere, while US equity futures are close to flat, Eminis last near 4419.
- The Nikkei 225 has again made a fresh high, up a further ~0.6% at this stage (albeit down from session highs). The electrics sector is higher, while brokerages are higher amid reports of higher retail product sales (per reports from Nomura). USD/JPY is also at fresh highs for the year, through 141.00, likely aiding the export segment. Offshore inflows into Japan stocks continued for the 11th straight week.
- China onshore media continues to push the case for policy stimulus, with a front page article on today's Economic Daily (see this link for more details). May activity data was weaker than expected, while the 1yr MFL was cut 10bps as widely forecast. At the break, the CSI 300 is +0.54%, near 3885 in index terms. The HSI is +0.83% at the break.
- The Kospi continues to struggle, with the index down a further 0.50% today, despite better tech leads from Wednesday US trade.
- In SEA trends are mixed, most bourses are down but losses are under 0.50% At this stage, except for the Philippines.
JAPAN DATA: Foreign Buying Of Japan Stocks Extends TO 11th Straight Week
Japan weekly investment flow figures were once again dominated by foreign purchases of Japan stocks. For the week ending June 9 we had an additional ¥1324.9bn in inflows to local stocks. This marked the 11th straight week of inflows, it was also the highest weekly inflow since mid April. Japan equities remain in a strong uptrend and continue to attract strong inflows.
- The flow picture was muted elsewhere. Foreign buying of Japan bonds picked up to ¥186.4bn, but this is only a modest offset to outflows from the previous two weeks.
- Japan outflows slowed noticeably. Buying of foreign bonds slowed to just ¥14.7bn, but was the 5th straight week of flows into this segment.
- Purchases of foreign stocks were negative, largely offsetting last week's positive outflow.
Table 1: Japan Weekly Investment Flows
| Billion Yen | Week ending June 9 | Prior Week |
| Foreign Buying Japan Stocks | 1324.9 | 608.7 |
| Foreign Buying Japan Bonds | 186.4 | -539.1 |
| Japan Buying Foreign Bonds | 14.7 | 521.3 |
| Japan Buying Foreign Stocks | -74.4 | 137.5 |
OIL: Prices Remain Down As Fed Tightening Expectations Grow
After falling around a percent on Wednesday, oil prices are down another 0.3% during the APAC session as the USD continued to strengthen and US yields to rise on expected future Fed tightening. The USD index is 0.3% higher.
- Brent is down 0.2% to around $73.01/bbl, close to the intraday low of $72.96. Breaks below $73 haven’t been sustained. WTI is 0.3% lower to about $68.08, close to the intraday low of $68.04. $68 hasn’t been breached this session.
- Despite forecasts of the market being in deficit in H2 2023, it remains concerned about stock build and lacklustre demand. The rise in US gasoline inventories signalled weak demand during the driving season, but on the other hand China released a large number of crude import quotas suggesting rising demand.
- Later US May retail sales, trade prices, IP/capacity, business inventories, Empire & Philly indices and jobless claims print. The ECB meets and is expected to hike 25bp.
GOLD: Higher Yields Weigh On Bullion, Approaching Support
Gold is down 0.4% during APAC trading after falling only 0.1% on Wednesday. It is currently around $1934.02/oz, close to the intraday low. Earlier it reached a high of $1945.38 but began trending down as the USD strengthened and Treasury yields rose. The USD index is 0.3% higher.
- Bullion fell to $1940.19 following the Fed decision to keep rates unchanged but the hawkish projections and comments from Fed Chairman Powell that upcoming meetings remain live drove yields higher and gold down. It closed at $1942.52.
- Prices are down 1% since Friday but are holding just above support at $1932.20, the May 31 low.
- Later US May retail sales, trade prices, IP/capacity, business inventories, Empire & Philly indices and jobless claims print. The ECB meets and is expected to hike 25bp.
CHINA DATA: May Activity Data Shows Further Loss Of Post-Opening Momentum
On balance the China May activity prints were weaker than market expectations. IP printed at 3.5% y/y, as forecast and against 5.6% prior. The YTD y/y number was a touch below expectations though. Retail sales y/y disappointed at 12.7%, versus 13.7% forecast and 18.4% prior. Fixed asset investment (FAI) was 4.0% ytd y/y, 4.4% was the forecast (4.7% prior). Property investment remained a meaningful drag down -7.2% ytd y/y, -6.7% was forecast ( -6.2% prior).
- Property sales rose a touch to 11.9% ytd y/y (11.8% prior), but note May house price growth eased back to 0.1% from 0.32% in Apr. Note also new property construction fell -22.6% ytd y/y.
- The jobless rate was steady at 5.2%, although the China Stat Bureau stated youth employment pressures remain relatively high.
- In terms of the detail - IP showed strength in cars and chips, but weakness in mining and raw material related sectors. Electricity production eased back to 5.6%, from 6.1% prior.
- For retail sales, slower y/y momentum was evident across the board, with signs of easing momentum in post re-opening related sectors. Restaurants/Catering eased back +35.1% y/y, from 43.8%, while spending on construction materials fell further to -14.6% y/y from -11.2%.
- For FAI, weakness was particularly evident in the private sector (-0.1% ytd y/y), while state owned FAI eased to 8.4%.
INDONESIA DATA: Trade Surplus Narrows As Imports Soar & Commodity Prices Fall
The May trade surplus narrowed to $440mn from $3940mn, less than expected, due to a surge in import growth. Both export and import growth exceeded expectations rising by 1% y/y and 14.4% y/y respectively, when they were both forecast to decline again. But YTD exports are still down 6% y/y and imports -3.8% y/y.
- Export growth was driven by agriculture (+32.4% y/y) and manufacturing (+10.3%)
- Mining shipments fell 21% y/y and oil & gas -12.1%, as commodity prices ease. Palm oil exports were slightly higher in May, while coal exports declined. Indonesia is the world’s largest thermal coal exporter and volumes fell 2.8% m/m while values declined 6.3% m/m.
- The strong showing from imports was due to capex goods rising 60.3% y/y and consumer goods 36.5%, signalling robust domestic demand in the months ahead.
Source: MNI - Market News/Bloomberg
ASIA FX: CNH Higher On Stimulus Hopes, Other Aisa FX Weighed By Higher US Yields
Most USD/Asia pairs are higher today, although this afternoon has seen a sharp turn lower in USD/CNH on stimulus hopes, with onshore equities rallying. USD/KRW is off intra-day highs as well. Most other pairs are firmer though, weighed by the move up in US Tsy yields. Still to come, we have the Taiwan CBC decision (no change expected), along with May India trade data. Tomorrow Singapore May export figures are out.
- USD/CNH got to fresh highs of 7.1922 in the first part of trade, before retracing sharply lower this afternoon. We last sit back near 7.1600, around 0.15% firmer in CNH terms versus the NY close from Wed. Earlier highs coincided with weaker May activity data, but stimulus discussions continue in onshore media. Local equities are firmer after the lunchtime break, the CSI 300 up 1%, ChiNext +3%.
- 1 month USD/KRW got to highs of 1284, amid broad USD strength earlier, as US yields rose. We are back to 1275/76 now, as lower USD/CNH levels is aiding the won, while onshore equities are recovering from earlier lows.
- The SGD NEER (per Goldman Sachs estimates) has ticked away from Tuesday's cycle highs, the measure however remains well within recent ranges. We now sit ~0.6% below the upper end of the band. USD/SGD is ~0.3% higher today as broader greenback flows dominate. The pair sits a touch above the 20-Day EMA ($1.3447). Looking ahead, May Export data crosses tomorrow. Non-Oil Domestic Exports are estimated to have fallen 1.9% M/M and 7.7% Y/Y. Electronic Exports are also due, there is no estimate for the release.
- USD/MYR is ~0.3% firmer in early dealing sitting a touch below year to date highs (4.6398). The pair last prints at 4.6340/70. Broader USD/Asia trends have dominated flows today as the greenback is on the front foot after yesterday's hawkish Fed rate path projections. Technically the uptrend remains in place, bulls now target the high from 26 May at 4.6398 a break through here open 4.70. Bears first look to break the 20-Day EMA (4.5841) to turn the tide. The domestic data calendar is empty today and tomorrow.
- USD/IDR sits just below session highs, last in the 14955/60 region, around 0.40% weaker in IDR terms for the session so far. Higher core yields is weighing on rupiah sentiment, while the May trade surplus narrowed to $440mn from $3940mn, less than expected, due to a surge in import growth. Spot rupiah hasn't reacted a great deal post the trade data release.
UP TODAY (TIMES GMT/LOCAL)
| Date | GMT/Local | Impact | Flag | Country | Event |
| 15/06/2023 | 0645/0845 | *** |  | FR | HICP (f) |
| 15/06/2023 | 0900/1100 | * |  | EU | Trade Balance |
| 15/06/2023 | - | | EU | ECB Panetta at Eurogroup Meeting | |
| 15/06/2023 | 1215/0815 | ** |  | CA | CMHC Housing Starts |
| 15/06/2023 | 1215/1415 | *** | | EU | ECB Deposit Rate |
| 15/06/2023 | 1215/1415 | *** | | EU | ECB Main Refi Rate |
| 15/06/2023 | 1215/1415 | *** | | EU | ECB Marginal Lending Rate |
| 15/06/2023 | 1230/0830 | ** |  | US | Jobless Claims |
| 15/06/2023 | 1230/0830 | ** | | US | WASDE Weekly Import/Export |
| 15/06/2023 | 1230/0830 | ** | | CA | Monthly Survey of Manufacturing |
| 15/06/2023 | 1230/0830 | *** | | US | Retail Sales |
| 15/06/2023 | 1230/0830 | ** | | US | Import/Export Price Index |
| 15/06/2023 | 1230/0830 | ** | | US | Empire State Manufacturing Survey |
| 15/06/2023 | 1230/0830 | ** | | US | Philadelphia Fed Manufacturing Index |
| 15/06/2023 | 1245/1445 | | EU | Post-Meeting ECB Press Conference | |
| 15/06/2023 | 1300/0900 | * | | CA | CREA Existing Home Sales |
| 15/06/2023 | 1315/0915 | *** | | US | Industrial Production |
| 15/06/2023 | 1400/1000 | * | | US | Business Inventories |
| 15/06/2023 | 1430/1030 | ** | | US | Natural Gas Stocks |
| 15/06/2023 | 1530/1130 | * | | US | US Bill 08 Week Treasury Auction Result |
| 15/06/2023 | 1530/1130 | ** | | US | US Bill 04 Week Treasury Auction Result |
| 15/06/2023 | 1535/1635 |  | UK | BOE Cunliffe at Politico Global Tech Summit | |
| 15/06/2023 | 2000/1600 | ** | | US | TICS |
Why MNI
MNI is the leading provider
of intelligence and analysis on the Global Fixed Income, Foreign Exchange and Energy markets. We use an innovative combination of real-time analysis, deep fundamental research and journalism to provide unique and actionable insights for traders and investors. Our "All signal, no noise" approach drives an intelligence service that is succinct and timely, which is highly regarded by our time constrained client base.Our Head Office is in London with offices in Chicago, Washington and Beijing, as well as an on the ground presence in other major financial centres across the world.