
Why MNI
MNI is the leading provider
of intelligence and analysis on the Global Fixed Income, Foreign Exchange and Energy markets. We use an innovative combination of real-time analysis, deep fundamental research and journalism to provide unique and actionable insights for traders and investors. Our "All signal, no noise" approach drives an intelligence service that is succinct and timely, which is highly regarded by our time constrained client base.Our Head Office is in London with offices in Chicago, Washington and Beijing, as well as an on the ground presence in other major financial centres across the world.
- Hong Kong & Chinese equities pulled lower on the back of fresh regulatory worry surrounding some of the notable Chinese tech giants and a lack of immediate stimulus after yesterday’s Politburo meeting in China. E-minis managed to hold on to most of their Apple & Amazon earnings-inspired gains.
- USD/JPY has shown below Y133.00, with the worry in the Chinese equity space, break of technical support and short JPY positioning facilitating that move.
- As we head for the European session, focus turns to preliminary Eurozone GDP, German unemployment and flash Eurozone CPI figures. Later in the day, the American docket features U.S. core PCE data, MNI Chicago PMI & the final reading of Uni. of Mich. Sentiment as well as Canadian GDP. Also be on the lookout for impromptu Fedspeak post-blackout.
US TSYS: Light Twist Steepening, Chinese Equity Woes & JPY Strength Eyed
TYU2 last deals +0-04+ at 121-04, 0-01+ off the peak of its 0-10+ range, operating on volume of ~92K.
- Modest early cheapening pressure was unwound across most of the Tsy curve during the final Asia-Pac session of the week, with the impulse from the after-hours bid in e-minis (linked to Apple & Amazon earnings) fading as Hong Kong & Chinese equities pulled lower on the back of fresh regulatory worry surrounding some of the notable Chinese tech giants and a lack of immediate stimulus after yesterday’s Politburo meeting in China. A related shunt lower in USD/JPY was also noted. E-minis have held on to the bulk of their gains, with the NASDAQ 100 leading.
- That leaves the curve twist steepening, with the major cash Tsy benchmarks running 2.5bp richer to 1.0bp cheaper, pivoting around 20s.
- Overnight flow was headlined by a block buy of FV futures (+2.5K).
- Looking ahead, PCE data, the employment cost index, the latest MNI Chicago PMI print and final UoM sentiment data (with an eye on 5- to 10-Year inflation expectations after their pullback in the flash reading) provide the highlights of the NY docket. There isn’t any Fedspeak on the slate, but we would expect some impromptu post-blackout appearances on the usual TV channels.
- Elsewhere, participants will be on the lookout for any fresh colour surrounding a face-to-face meeting between U.S. President Biden and his counterpart Xi, after source reports flagging discussions pertaining to the matter did the rounds in the wake of the call that was held between the leaders on Thursday (the idea was already touted prior to the-call).
JGBS: Reverting To Flattening
Wider core FI gyrations have been at the fore for JGBs from the start of Tokyo trade, with futures eating away at their modest early downtick during the Tokyo afternoon to trade +28 vs. yesterday’s settlement into the bell (failing to challenge overnight session highs).
- JGBs have reverted to flattening after yesterday’s steepening, with the space benefitting from Thursday’s recession worry driven bid in U.S. Tsys and moves lower in Chinese & Hong Kong equities. The major cash JGB benchmarks run 1.0-4.0bp richer on the session, with 40s providing the firmest point on the curve.
- Note that swap spreads are wider across the curve, with super-long swaps even seeing payside flow during the Tokyo morning.
- There was a modest upside surprise across the Tokyo CPI data suite, a non-descript labour market report, while domestic retail sales data provided a miss and prelim industrial production data provided a beat.
- The results from the latest round of BoJ Rinban operations had no meaningful impact on the space.
- As an aside, there was another notable pull lower in JPY crosses, led by a technical break in USD/JPY and short JPY position squaring.
- The BoJ will release its August Rinban plan after hours today. Looking ahead, Monday’s Tokyo docket will be headlined by final manufacturing PMI data.
AUSSIE BONDS: Richer
Aussie bonds caught a bid after an earlier blip lower on wider fixed income moves, the marginal beat in private sector credit growth and an uptick in PPI in Y/Y terms (although with a modest moderation in Q/Q terms). Wider core FI market gyrations were at the fore, with the move higher ultimately facilitated by U.S. Tsys unwinding their earlier cheapening. Cash ACGBs run 8.5-21.0bp richer across the curve, with the belly leading the bid. YM is +20.5 while XM is +19.5, off best levels after showing through their respective overnight highs, with XM back below its overnight peaks at typing. Bills run 14 to 26 ticks richer through the reds, bull flattening.
- The first tap of the ACGB Nov-33 bond went smoothly enough, with the weighted average yield pricing 0.97bp through prevailing mids (per Yieldbroker). The cover ratio was less firm however, coming in at 2.25x - while the print did not point to any outright difficulty re: digestion, it came nowhere near the highest level of cover observed at recent ACGB auctions.
- The AOFM issuance slate announced for next week provoked little reaction in Aussie bonds, with the return to A$1.5bn of ACGBs and A$2.0bn of notes on offer.
- Monday will see m’fing PMI, Melbourne Institute Inflation, and ANZ job ads headline the data docket, although their proximity to the RBA’s monetary policy decision on Tuesday may limit any potential impact from that suite of data. Note that CoreLogic house prices are due to cross late Sunday/early Monday.
- Also note NSW will observe a state holiday on Monday.
FOREX: Yen Keeps Busting Ceilings, USD/JPY Piercing 50-DMA Provides Initial Trigger
The adjustment of yen positions resumed towards the end of a week marked by the repricing of Fed rate hike trajectory in response to the latest FOMC meeting and a disappointing U.S. GDP print.
- The initial downleg in USD/JPY came as a result of bears forcing their way through the 50-DMA, with no apparent headline catalysts crossing the wires. The said moving average limited losses on Thursday and provided support on the rate's corrective pullback in May, which added to its significance.
- The cross remained heavy amid talk of further JPY short covering. Spot USD/JPY briefly probed the water below Y133.00 for the first time since Jun 17. This puts the $1.2bn of Y132.50 option expiries set to roll off at today’s 10AM NY cut within notably closer proximity.
- Cross-asset signals were conducive to JPY strength, with weakness in Chinese & Hong Kong equities providing a cue to seek shelter in the regional safe haven. Sales of USD/JPY may have been facilitated by a downtick in U.S. Tsy yields.
- The greenback underperformed as a function of its sales against the yen, while the loonie was the second-worst performer. The European FX bloc was broadly softer, save for the Swiss franc.
- The Antipodeans diverged from their high-beta peers and were among the best G10 performers, with regional stock benchmarks eking out some gains. AUD/USD punched through the $0.7000 mark after two consecutive failures to close above there, while NZD/USD moved above its 50-DMA for the first time since April.
- As we head for the European session, focus turns to preliminary EZ GDP, German unemployment and flash CPI figures from France & Italy.
- Later in the day, the American docket features U.S. core PCE data, MNI Chicago PMI & the final reading of Uni. of Mich. Sentiment as well as Canadian GDP.
FX OPTIONS: Expiries for Jul29 NY cut 1000ET (Source DTCC)
- EUR/USD: $0.9800(E948mln), $1.0050(E1.1bln), $1.0125(E658mln), $1.0200(E789mln), $1.0247-50(E3.0bln), $1.0300(E646mln)
- USD/JPY: Y132.50($1.2bln), Y135.00($539mln), Y135.95-00($991mln), Y140.00($1.3bln)
- GBP/USD: $1.2100(Gbp985mln)
- USD/CAD: C$1.2830($575mln), C$1.2920-30($1.2bln)
- USD/CNY: Cny6.8000($1.2bln)
ASIA FX: NEA Underperforms SEA in the FX space
North East Asia currencies have underperformed the South East Asia/INR FX bloc today. Tempering Fed expectations are one driver, although disappointment from the China Politburo meeting, around stimulus measures, has likely been a factor as well. These moves come despite a sharp drop in USD/JPY today as well, which has seen less spill over to the region compared to yesterday.
- CNH: The CNH has underperformed broader USD weakness today. Disappointment around lack of fresh stimulus measures following the Politburo meeting has left onshore equities underperforming. This has likely weighed at the margin. USD/CNH is back close to 6.7500, while the DXY is off by 0.40% at this stage.
- KRW: USD/KRW has pushed higher through the session, unable to test below 1295 (around the overnight low). Unlike yesterday, there is less positive spill over from the stronger yen today. The pair last tracked at 1300 in terms of the 1 month NDF. Onshore equities have lost ground as the session progressed, but remain in positive territory for now (last +0.408%).
- INR: The rupee is up by a little over 0.4% at this stage. While not a large move, it is a decent bounce for the underperforming INR. USD/INR last changed hands at 79.43. Onshore equities are firmer in early trade today as well.
- IDR: USD/IDR has continued to fall sharply today, off a further 82.5 figs to 14850 last. Lower US real yields/scaling back of tightening Fed expectations is helping. Palm oil futures gained in Thursday's after-hours trade, finishing +MYR87/MT at MYR4,044/MT. Indonesia's shipments will continue to attract attention, with the nation trying to boost exports and drain overflowing storage tanks.
- PHP: The Peso has rallied more than 1% today, continuing the recent volatile trend. We were last at 55.21 fresh lows back to early July, on track to end the week lower in USD/PHP terms. Local equities are lower today (-1%), but this follows yesterday's +2.3% gain. Bangko Sentral ng Pilipinas will keep tightening policy to prop up the beleaguered peso and curb inflation, Governor Medalla said Thursday, adding that the trajectory of rate hikes will be determined by data.
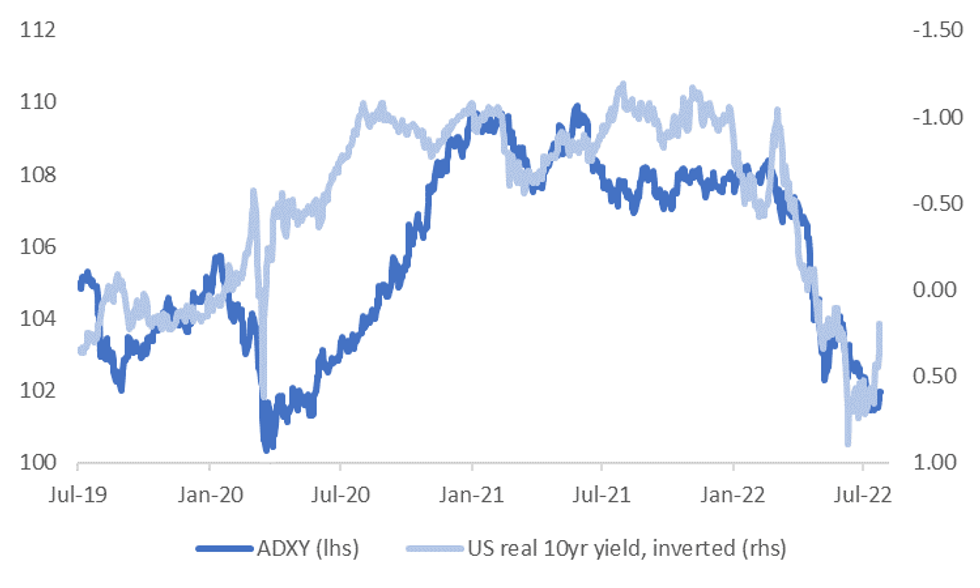
ASIA FX: Some Divergences In USD/Asia Correlations With US Real Yields
The ADXY currency index has certainly benefited from lower Fed tightening expectations in recent sessions. The first chart below plots the ADXY against the real US 10yr yield, note that the real yield is inverted on the chart.
- The relationship between the two series has been particularly tight since the start of the year.
- If we look at the individual USD/Asia currency pairs, the correlations for the past 6 months are strongly positive. That is, higher US real yields driver USD/Asia pairs higher, all else equal and vice versa when real yields fall. Most correlations are in the 80-90% range.
Fig 1: ADXY & US Real 10yr Yield
 Source: J.P. Morgan/MNI/Market News/Bloomberg
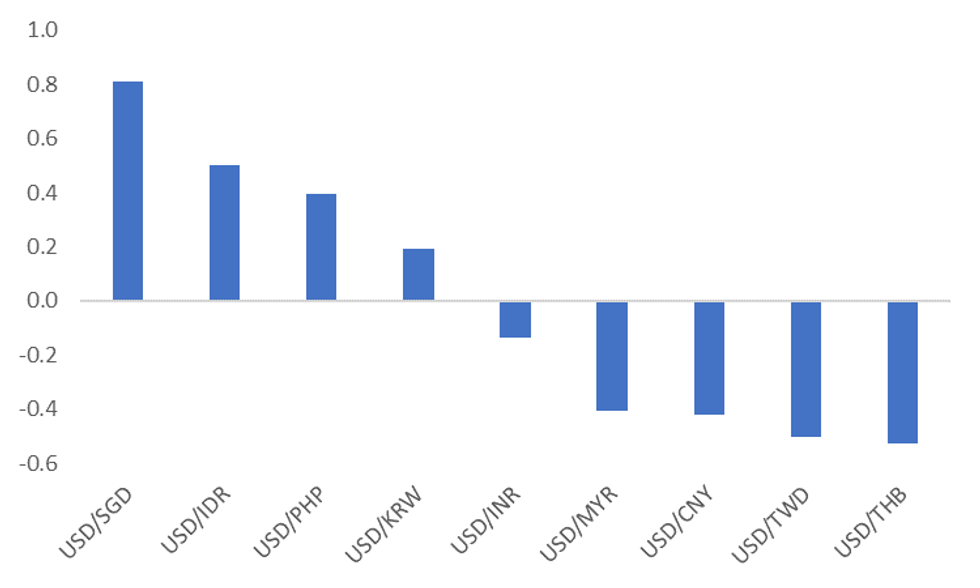
- On a shorter term basis, for the past month, correlations are quite divergent though. See the second chart below.
- If we continue to see real yields correct lower, current correlations suggest USD/SGD, USD/IDR, USD/PHP and USD/KRW may see greater downside compared to the rest of the USD/Asia bloc.
- Interestingly, today IDR and PHP have been the best performers within Asian FX, although clearly other factors could be at play other than the sharp US real yield drop overnight (from +36bps to +20bps).
- For SGD, we suspect this high correlation reflect its correlation the majors (EUR, JPY etc), which themselves are influenced by US yield shifts. For IDR and PHP, it likely reflects sensitivity to external financing conditions, particularly given high foreign ownership levels of Indonesian debt and the Philippines large current account deficit at the moment.
- For the other USD/Asia pairs, we can obviously see a shift in correlations, but it may be the case other drivers are more important for these currencies at the moment.
Fig 2: USD/Asia Correlations With Real US 10yr Yield - Past Month
 Source: J.P. Morgan/MNI/Market News/Bloomberg
CHINA: Official PMIs Print This Sunday, More Uncertainty Around Services Outcome
A reminder that the official China PMIs print this Sunday (the 31st of July). The market expects mixed results. The consensus is for the manufacturing PMI to edge higher to 50.4 from 50.2 last month. The non-manufacturing/services PMI is forecast to ease down to 54.0 from 54.7 last month.
- For the manufacturing PMI, the range of estimates is 49.9 to 51.3, while the range is noticeably wider for the non-manufacturing PMI (51.3 to 54.6).
- This is not surprising given uncertainty as to how the domestic economy is tracking, particularly in the service sectors, given on-going covid related headwinds.
- In Shanghai, metro passenger volumes are still well below earlier 2022 highs, while this metric for Shenzhen has also ticked down towards the end of this month.
- There is also uncertainty as to how mortgage related turmoil and on-going housing weakness will impact broader activity.
- Still, the Standard Chartered China SME survey improved further in July, the headline series rose to 52.2 from 51.7 last month. We are comfortably above the May trough of 48.50.
- Then on Monday, the Caixin manufacturing PMI prints. The market is expecting a 51.5 print, versus 51.7 last month. On Wednesday the Caixin services PMI is forecast to print at 54.0 from 54.5 in June.
EQUITIES: Mostly Lower In Asia; Chinese Investors Beat Feet
Most Asia-Pac equity indices are lower at typing, with broader sentiment sapped by steep declines observed in Chinese and Hong Kong benchmarks.
- The Hang Seng sits 2.3% worse off at typing, just off freshly-made nine-week lows. China-based tech (HSTECH: -4.3%) led the way lower as worry re: regulatory crackdowns again re-surfaced, with Alibaba Group (-5.8%) leading losses following WSJ source reports of high-profile founder Jack Ma planning to relinquish control of Ant Group. Reports of regulators blocking tech giant Xiaomi’s (-4.0%) EV project did little to help matters as well, seeing the HSTECH hit fresh session lows afterwards. Elsewhere, the Hang Seng’s property (-1.2%) and finance (-1.2%) sub-indices struggled as well, continuing to reflect recent weakness in sentiment towards Chinese property developers.
- The CSI300 deals 1.1% weaker at writing, hitting fresh six-week lows amidst losses in virtually every sub-index, save a flat showing from Utilities. Richly-valued sectors (such as consumer staples and healthcare) contributed the most to losses, coming as the Chinese leadership has refrained from announcing fresh stimulus at this week’s Politburo meeting despite recent worry from some quarters re: economic growth.
- The ASX200 sits 0.9% firmer at typing, bucking the broader trend of losses, on track for a fourth straight higher daily close on gains in virtually every sub-index. Commodity-related equities lead the bid, with the energy (+1.0%), materials (+0.8%), and utilities (+2.1%) sub-gauges leading the way higher.
- U.S. e-minis are flat to 1.2% firmer at typing, sitting a little below their respective best levels made on Thursday.
GOLD: Just Off Post-GDP Highs; On Track For Higher Weekly Close
Gold sits ~$2/oz weaker, printing $1,754/oz at typing. The precious metal operates just shy of Thursday’s best levels ($1,757.1/oz), putting it on track to record a second straight week of gains (that comes after five consecutive weeks of losses prior).
- To recap, gold closed ~$20/oz higher on Thursday, a little below fresh three-week highs made after the U.S. Q2 advanced GDP print missed expectations (indicating a technical recession). The move higher was facilitated by a downtick in U.S. real yields, with the DXY nudging a little lower as well after failing to breach 107.00.
- Gold has rebounded from multi-month lows amidst the post-FOMC shift lower in expectations for a 75bp hike in the Fed’s Sep meeting (Sep FOMC dated OIS now price in ~56bp for tightening vs. ~62bp prior), with recent economic data misses providing support for that narrative as well. The yellow metal however remains firmly set for a fourth straight monthly decline, with progress in the Fed’s inflation fight remaining in focus, as Fed Chair Powell has emphasised “less clear” guidance and data-dependence for future FOMC decisions.
- From a technical perspective, gold has breached initial resistance at $1,745.4/oz (Jul 13 high), strengthening its near-term bullish set-up, and opening the possibility of a stronger bounce. The move higher has exposed further resistance at $1,787.0/oz (May 16 low, recent breakout level), with support seen at $1,711.7/oz (Jul 27 low).
OIL: Little Changed In Asia; Supply Outlook Remains Tight
WTI is ~+$0.30 and Brent is ~+$0.10 at typing, back from best levels, and operating a little above their respective lows observed on Thursday after U.S. Q2 advance GDP dipped into negative territory, exacerbating recession-related worry. Both benchmarks nonetheless remain on track to end higher this week, with WTI looking to snap a three-week streak of lower closes.
- A well-documented moderation in Fed rate hike expectations following the recent FOMC decision continues to support crude’s recovery in recent sessions (amidst the easing of prior worry re: a Fed-led economic slowdown/contraction), adding to the previously-flagged easing of demand worry from some quarters (particularly the rebound in U.S. gasoline demand).
- Looking to OPEC+, RTRS source reports have pointed to the group considering to keep the Sep output target unchanged at next week’s meeting (with RTRS sources simultaneously saying that the White House is “optimistic” re: the odds of an output increase), keeping in mind that Argus Media source reports earlier in the week suggested that OPEC+ output shortfalls had worsened in June to ~2.8mn bpd, highlighting long-standing output production issues faced by some members.
- The CEOs of Total Energy and Shell have stated (amidst the backdrop of highly-publicised earnings outperformance in the sector this week) that crude supplies remain tight, with the latter highlighting the lack of spare capacity out of the U.S. and OPEC, even ahead of the full implementation of sanctions on Russian crude.
UP TODAY (Times GMT/Local)
| Date | GMT/Local | Impact | Flag | Country | Event |
| 29/07/2022 | 0530/0730 | ** |  | FR | Consumer Spending |
| 29/07/2022 | 0530/0730 | *** | | FR | GDP (p) |
| 29/07/2022 | 0600/0800 | ** |  | SE | Unemployment |
| 29/07/2022 | 0600/0800 | ** |  | DE | Import/Export Prices |
| 29/07/2022 | 0630/0830 | ** |  | CH | retail sales |
| 29/07/2022 | 0645/0845 | *** | | FR | HICP (p) |
| 29/07/2022 | 0700/0900 | * | | CH | KOF Economic Barometer |
| 29/07/2022 | 0700/0900 | *** |  | ES | GDP (p) |
| 29/07/2022 | 0700/0900 | *** | | ES | HICP (p) |
| 29/07/2022 | 0755/0955 | ** | | DE | Unemployment |
| 29/07/2022 | 0800/1000 | * |  | NO | Norway Unemployment Rate |
| 29/07/2022 | 0800/1000 | *** | | DE | GDP (p) |
| 29/07/2022 | 0800/1000 | *** |  | IT | GDP (p) |
| 29/07/2022 | 0830/0930 | ** |  | UK | BOE Lending to Individuals |
| 29/07/2022 | 0830/0930 | ** | | UK | BOE M4 |
| 29/07/2022 | 0900/1100 | *** |  | EU | HICP (p) |
| 29/07/2022 | 0900/1100 | *** | | EU | GDP preliminary flash est. |
| 29/07/2022 | 0900/1100 | *** | | IT | HICP (p) |
| 29/07/2022 | 0900/1100 | *** | | EU | EMU Preliminary Flash GDP Y/Y |
| 29/07/2022 | 1000/1200 | | IT | PPI | |
| 29/07/2022 | 1230/0830 | *** |  | CA | Gross Domestic Product by Industry |
| 29/07/2022 | 1230/0830 | ** |  | US | Personal Income and Consumption |
| 29/07/2022 | 1230/0830 | ** | | US | Employment Cost Index |
| 29/07/2022 | 1345/0945 | ** | | US | MNI Chicago PMI |
| 29/07/2022 | 1400/1000 | *** | | US | Final Michigan Sentiment Index |
| 29/07/2022 | 1500/1100 | | CA | Finance Dept monthly Fiscal Monitor (expected) |
Why MNI
MNI is the leading provider
of intelligence and analysis on the Global Fixed Income, Foreign Exchange and Energy markets. We use an innovative combination of real-time analysis, deep fundamental research and journalism to provide unique and actionable insights for traders and investors. Our "All signal, no noise" approach drives an intelligence service that is succinct and timely, which is highly regarded by our time constrained client base.Our Head Office is in London with offices in Chicago, Washington and Beijing, as well as an on the ground presence in other major financial centres across the world.