-
Policy
Policy
Exclusive interviews with leading policymakers that convey the true policy message that impacts markets.
LATEST FROM POLICY: -
EM Policy
EM Policy
Exclusive interviews with leading policymakers that convey the true policy message that impacts markets.
LATEST FROM EM POLICY: -
G10 Markets
G10 Markets
Real-time insight on key fixed income and fx markets.
Launch MNI PodcastsFixed IncomeFI Markets AnalysisCentral Bank PreviewsFI PiFixed Income Technical AnalysisUS$ Credit Supply PipelineGilt Week AheadGlobal IssuanceEurozoneUKUSDeep DiveGlobal Issuance CalendarsEZ/UK Bond Auction CalendarEZ/UK T-bill Auction CalendarUS Treasury Auction CalendarPolitical RiskMNI Political Risk AnalysisMNI Political Risk - US Daily BriefMNI Political Risk - The week AheadElection Previews -
Emerging Markets
Emerging Markets
Real-time insight of emerging markets in CEMEA, Asia and LatAm region
-
Commodities
-
Credit
Credit
Real time insight of credit markets
-
Data
-
Global Macro
Global Macro
Actionable insight on monetary policy, balance sheet and inflation with focus on global issuance. Analysis on key political risk impacting the global markets.
Global MacroDM Central Bank PreviewsDM Central Bank ReviewsEM Central Bank PreviewsEM Central Bank ReviewsBalance Sheet AnalysisData AnalysisEurozone DataUK DataUS DataAPAC DataInflation InsightEmployment InsightGlobal IssuanceEurozoneUKUSDeep DiveGlobal Issuance Calendars EZ/UK Bond Auction Calendar EZ/UK T-bill Auction Calendar US Treasury Auction Calendar Global Macro Weekly -
About Us
To read the full story
Sign up now for free trial access to this content.
Please enter your details below.
Why MNI
MNI is the leading provider
of intelligence and analysis on the Global Fixed Income, Foreign Exchange and Energy markets. We use an innovative combination of real-time analysis, deep fundamental research and journalism to provide unique and actionable insights for traders and investors. Our "All signal, no noise" approach drives an intelligence service that is succinct and timely, which is highly regarded by our time constrained client base.Our Head Office is in London with offices in Chicago, Washington and Beijing, as well as an on the ground presence in other major financial centres across the world.
Real-time Actionable Insight
Get the latest on Central Bank Policy and FX & FI Markets to help inform both your strategic and tactical decision-making.
Free AccessMNI: PBOC Net Injects CNY28.8 Bln via OMO Thursday
MNI BRIEF: Ontario To Cut U.S. Energy Flows When Tariffs Hit
MNI BRIEF: Aussie Labour Market Tightens, Unemployment At 3.9%
MNI EUROPEAN MARKETS ANALYSIS: Jackson Hole In View, Slight Curveball From PBoC
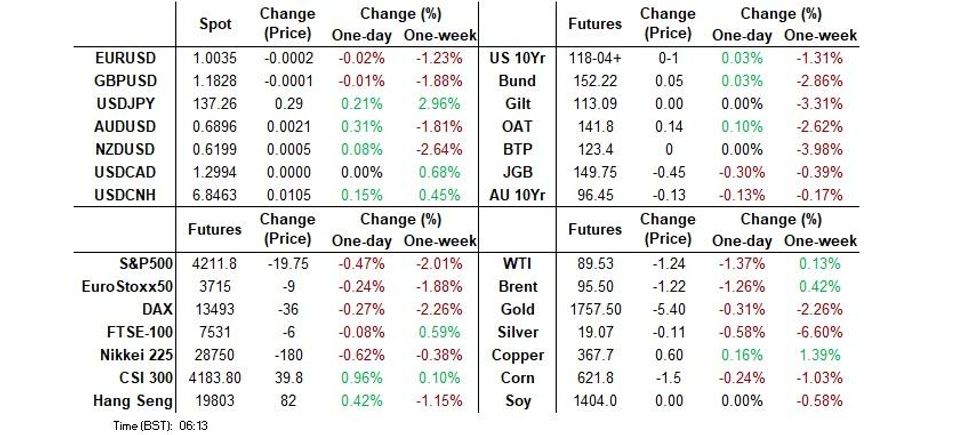
- U.S. Tsys bear flattened, the USD firmed vs. Asia FX and e-minis breached Friday's lows as Asia-Pac participants reacted to Friday's market moves and set up for this week's Jackson Hole sympoisum.
- China's monthly LPR fixings provided some surprises vs. median expectations, indicating a preference for support for the property market and perhaps some worry around a liquidity trap/bank margins.
- Monday's calendar is particularly light, which will leave headline flow and setup for Jackson Hole at the fore.

US TSYS: Bear Flattening Asia, 10s Fail To Break 3.00%
TYU2 prints +0-01 at 118-04+, around the middle of its 0-09 range. Cash Tsys are flat to 3bp cheaper across the curve, bear flattening.
- Spill over from Friday’s softness in Tsys and focus on the impending Jackson Hole symposium (due to be held Thursday-Saturday) provided the points of interest overnight.
- 5- to 20-Year Tsys showed below their respective Friday cheaps, with the failure of 10s to break above the 3.00% level in yield terms allowing a base to form overnight.
- A block buy of FV futures (+3K) also helped the space to move away from session cheaps, while Asia-Pac trade also saw some light downside interest expressed via low delta put options (TYUS 115.50 puts).
- Weekend headline flow failed to provide much impetus, with the UK political backdrop, European energy woes, familiar ECB speak and the continuing Russia-Ukraine war headlining.
- Monday’s NY docket is headlined by the latest national activity index reading from the Chicago Fed, although that lower tier data release is unlikely to impact the market.
JGBS: Futures And Long End Struggle
JGBs adjusted to Friday’s cheapening in core global FI markets during early Tokyo trade, which allowed futures to extend on their overnight session weakness.
- A base then formed alongside a similar dynamic in the wider core global FI markets, before a fresh round of softening became apparent as we moved towards the bell, although no clear catalysts were observed. Futures last -43, just off lows.
- Cash JGBs run little changed to 4bp cheaper, with 7s providing the weakest point on the curve, driven by the softness in futures.
- Demand in the super-long end on the part of Japanese life insurers and pension funds seems to have abated, at least for today, after signs of active capital deployment from that cohort at the tail end of last week.
- Flash PMI data and a liquidity enhancement auction for off-the-run 5- to 15.5-Year JGBs headline tomorrow’s local docket, although the swings in broader financial markets ae likely to provide more of a meaningful input than either of those events.
AUSSIE BONDS: Off Lows, But Comfortably Cheaper
Aussie bonds sit a little above session lows after cheapening during early Sydney trade, with spill over from the general gyrations in wider core FI markets at the fore on Monday,
- Cash ACGBs run 10.5-12.5bp cheaper across the curve, with the 7- to 15-Year zone leading the weakness. YM is -11.5 while XM is -12.5. Elsewhere, the 3-/10-Year box steepened, while Bills run 1 to 16 ticks cheaper through the reds, bear steepening.
- The latest round of ACGB Jun-51 supply saw no major hiccups, although the cover ratio wasn’t convincing when adjusted for the size of the auction, with overall interest likely limited by well-documented headwinds for demand and inversion in the longer end of the ACGB curve.
- Tuesday’s local docket will see the release of the flash S&P Global PMI readings and weekly ANZ-Roy Morgan Consumer Confidence data. Also, A$150mn of Nov-32 index-linked paper will be on offer from the AOFM.
FOREX: Aussie Takes Lead, Yen Goes Offered
The BBDXY index made a round trip from is session high of 1,289 and had a look above last Friday's high in the process. E-mini futures operated in the red but are off earlier lows, while U.S. Tsy yield curve bear flattened a tad.
- Cuts to the PBOC's Loan Prime Rates sent spot USD/CNH to a new cyclical peak (CNH6.8517) before the pair trimmed gains to last trade ~50 pips better off. The People's Bank cut the 5-Year LPR by a larger-than-expected 15bp, which was coupled with a smaller-than-expected 5bp decline in the 1-Year LPR.
- The yen was the worst G10 performer, with USD/JPY adding ~30 pips after completing a short-term double bottom pattern last week. Across the curve, risk reversals consolidated above par, suggesting options traders were more bearish on the yen.
- The Aussie dollar turned bid, which put it on track to snap a five-day losing streak. The kiwi gradually caught up with its Antipodean cousin despite underperforming in early trade. AUD/NZD lurked above last Friday's high before paring gains, with Australia/NZ 2-year swap spread moving away from highs.
- The global economic docket is light today as participants await this week's Jackson Hole symposium
AUD/NZD: Risk-Off May Only Take AUD/NZD So Far
The AUD/NZD cross is close to a move above 1.1150. This is not too far away from previous YTD highs, which was just shy of 1.1200 in late July. Going back to early May, the cross has had a number of attempts to break higher but has run out of momentum in the 1.1150/1.1200 range.
- As we noted late last week, it may take relative yield differentials to move convincingly higher to see the cross break above 1.1200.
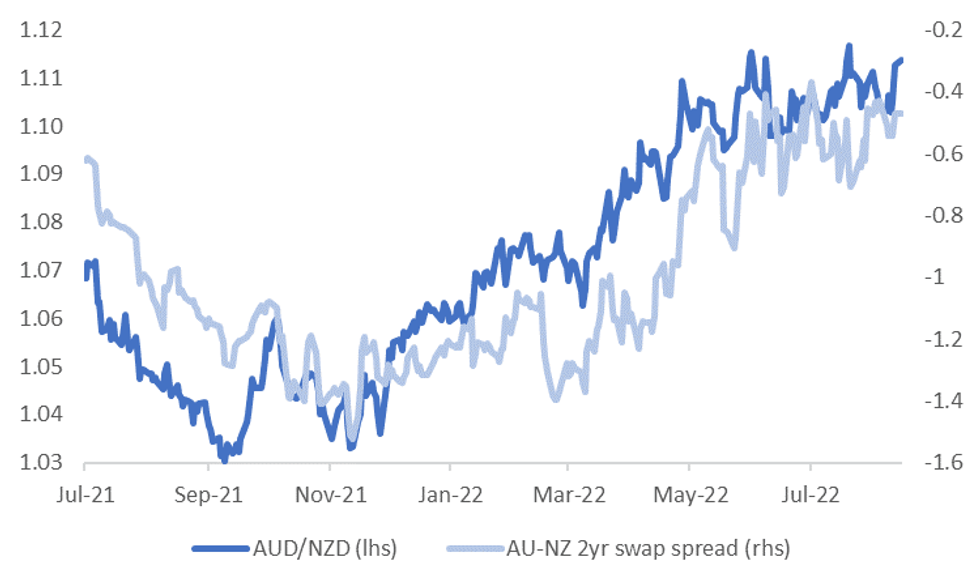
- Since the RBNZ last week, yield spreads have moved in AUD's favor, but arguably the move higher in the cross has outperformed these trends, see the chart below.
- The AU-NZ 2yr swap spread is back to -46bps, up from last week's lows, but it remains well within recent ranges.
Fig 1: AUD/NZD Versus AU-NZ 2yr Swap Spread
 Source: MNI/Market News/Bloomberg
- It's the same story in the government bond yield space. Interestingly, the levels correlation between AUD/NZD and yield differentials in the pass month is negative. It remains strongly positive though for 2022 as a whole and higher than other macro drivers.
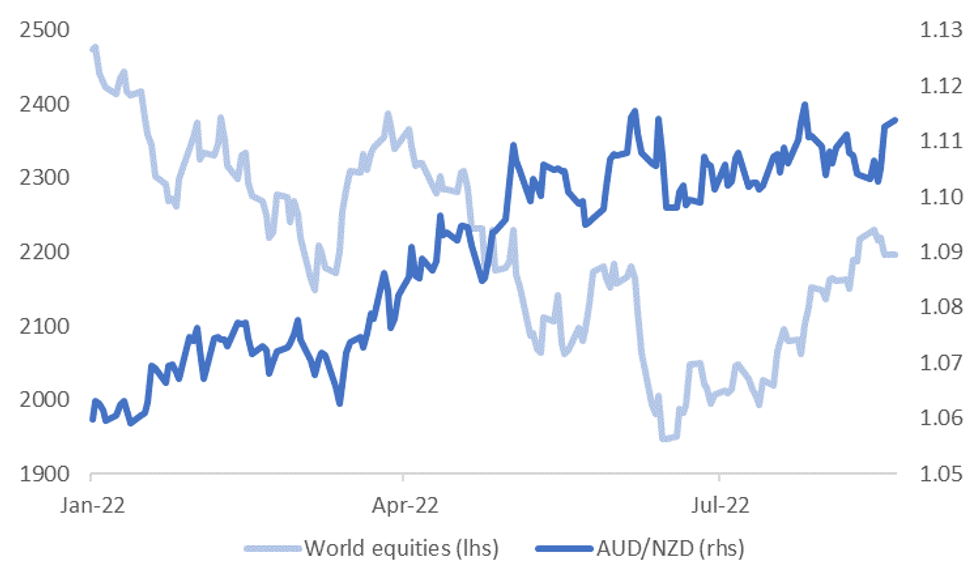
- One possible driver of the rebound in AUD/NZD is the recent decline in global equities. The second chart below plots the cross against global equities performance. The correlations here are negative.
- This likely reflects the fact that Australia's trade position is in a much stronger position relative to NZ's, and therefore in a better position to withstand external headwinds from a current account funding standpoint.
- However, our sense is that risk off in equities may only take the AUD/NZD cross so far. The more risk off we see in equities the greater the risk that this spills over into commodity prices, all else equal, particularly if the source of risk aversion is related to the health of the global economy.
- AUD/NZD maintains a positive correlation both with relative commodity prices to NZ and aggregate commodity prices. Correlation levels are noticeably lower for the past month though.
Fig 2: AUD/NZD & Global Equities
 Source: MNI/Market News/Bloomberg
ASIA FX: Little Respite
USD/Asia pairs are higher once again. USD/CNH touched above 6.8500, as local banks cut the 5yr LPR more than expected. The won is off by more than 1%, with USD/KRW making fresh highs back to 2009.
- CNH: USD/CNH briefly spiked above 6.8500 following the LPR cut announcement. This took the pair above Friday night highs, with the stronger than expected CNY fixing only providing fleeting relief. China equities are higher though on hopes the 5yr LPR cut will aid the property sector.
- KRW: Spot USD/KRW is more than 1% higher, breaching the 1340 level. The is fresh highs going back to 2009. Onshore equities are weaker, off by over 1%. The first 20 days of trade data for August showed a picture of slowing external demand and a still very wide trade deficit.
- INR: The rupee weakened in early trade, but USD/INR ran out of momentum ahead of 79.90. The pair was last back at 79.84. The 1 month NDF remains above 80.00. Lower oil prices are providing limited relief so far. Onshore equities are also unwinding some of the recent bounce, off -1% in the first part of trading.
- IDR: Spot USD/IDR has crept higher amidst risk-off backdrop and last trades +34 figs at IDR14,872. A break above the nearby 50-DMA (IDR14,889) would bring Aug 4 high of IDR14,939 into view. Bank Indonesia will deliver its monetary policy decision tomorrow. Most analysts expect the central bank to stand pat on interest rates.
- PHP: The Philippine peso has been offered amid weakness in the broader Asia EM FX space and an apparent moderation in Bangko Sentral ng Pilipinas' rate-hike plans. Spot USD/PHP deals +0.135 at 56.080, with bulls looking for a move towards record highs of PHP56.500. Bears keep an eye on the 50-DMA, which intersects at PHP55.412.
- THB: Spot USD/THB has crossed above its 50-DMA and last deals +0.27 at 35.945. The back end of last week brought some positive news for Thailand's critical tourism industry. The government said it will allow foreign visitors to extend their stay, while hotel operators signalled the intention to boost investment budgets. Later this week, customs trade data will be published Wednesday.
ASIA FX: Will Offshore Equity Inflows Rollover?
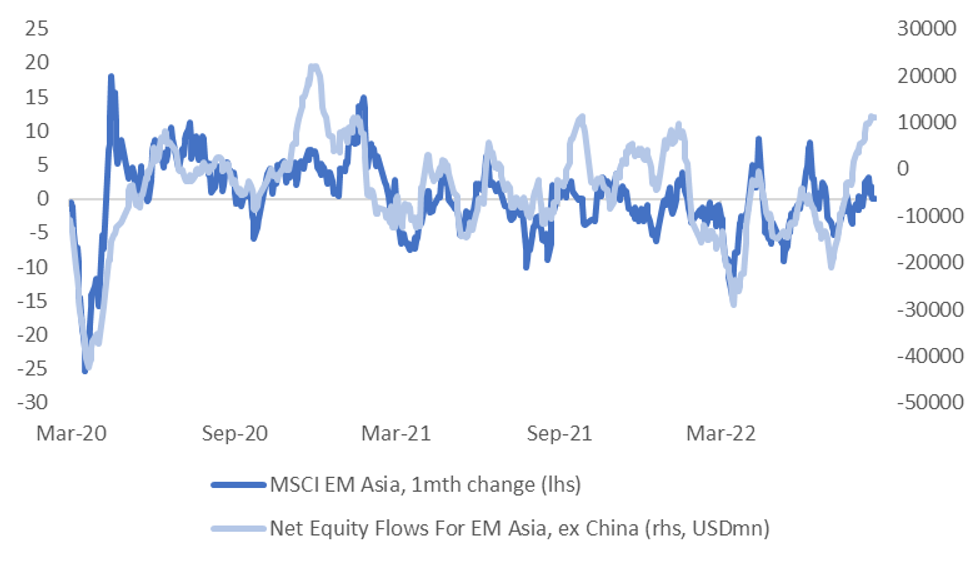
In the past trading month, net equity flows have been strong for major EM Asia economies (ex China). The first chart below plots the rolling 1 month sum of net inflows across India, South Korea, Taiwan, Indonesia, Thailand, the Philippines and Malaysia. The other line on the chart is the rolling 1 month rate of change for the EM Asia MSCI index.
- There are a few observations to be made. Firstly, in recent years, net inflow momentum hasn't got much beyond the $10bn mark over a rolling 1 month sum. Late in 2020 was the exception.
- Inflow momentum typically has a fairly strong positive correlation with underlying equity market performance, which has just started to falter slightly for the region. The MSCI EM Asia index is now down on levels that prevailed a month ago.
Fig 1: EM Asia Net Equity Flows (Ex China) & MSCI EM Asia
 Source: MNI/Market News/Bloomberg
- It might be difficult to expect a further sharp rise in net equity inflow momentum, given headwinds to the global growth outlook (recessionary fears) and the Fed still with work to do from an inflation standpoint.
- The table below presents the net inflow picture by country for the past trading month. India is the standout, followed by South Korea.
- Even for countries like Thailand, net inflows look much better relative to averages for 2022 in the past month. The Philippines and Taiwan have seen net outflows, although in Taiwan's case the pace of net outflows is much lower compared to trough points in 2022.
- A rollover in net equity inflow momentum may add pressure to what is already a stressed FX backdrop for some of these markets.
- USD/KRW is breaking higher to levels last seen in 2009, while USD/INR is threatening to move above 80.00.
Table 1: Net Equity Inflows By EM Asia Economy (Ex China), Past Month
| Country | USDmn |
| India | 7397.7 |
| South Korea | 2723.4 |
| Thailand | 1432.6 |
| Indonesia | 439.3 |
| Malaysia | 359.3 |
| Philippines | -131.3 |
| Taiwan | -681.9 |
CHINA: LPR Moves Show Focus On The Property Sector
The fact that this month’s Loan Prime Rate (LPR) fixings saw a larger-than-expected 15bp fall in the 5-Year LPR (although that was the modal outcome vs. the median of a 10bp step, per the BBG survey) and smaller-than-expected 5bp fall in the 1-Year LPR points to a focus on support for the housing sector (particularly in light of the recent announcement of special loans to support the construction of overdue, incomplete housing projects via policy banks), potentially based on guidance from the PBoC.
- A reminder that most estimates suggest that the construction sector and related activities account for somewhere in the region of 25-35% of Chinese economy activity, with the well-documented headwinds that the sector has faced over the last couple of years, coupled with the government’s zero COVID strategy, blunting Chinese economic growth.
- The smaller-than-expected 5bp cut in the 1-Year LPR fixing suggests that banks are cognisant of lacklustre demand for credit given the above worries, while there is rising fear surrounding the prospect of a liquidity trap in China, which may mean that banks will be tentative when it comes to passing on lower credit costs.
- Worries surrounding banks’ NIM may also have been a consideration here.
EQUITIES: Mixed In Asia As Chinese, Hong Kong Stocks Inch Higher On LPR Cut
Most Asia-Pac equity indices are softer, tracking a negative lead from Wall St. On the other hand, Chinese and Hong Kong stock benchmarks have reversed earlier losses at writing, drawing limited support from the PBOC’s LPR fixing for August.
- The Hang Seng sits 0.2% better off, up from opening ~1.0% lower. The property sub-index (+0.8%) led peers after the PBOC delivered larger cuts to the 5-Year LPR, offsetting sharp losses in the utilities sub-gauge (-2.9%), with the latter dragged lower by ENN Energy Holdings (-10.9%) after reporting H1 results.
- The Chinese CSI300 trades 0.8% firmer at writing after opening 0.4% lower, with gains observed in every sub-gauge. Consumer staples and real estate stocks outperformed, although gains elsewhere were muted, with caution evident re: the smaller-than-expected cut to the 1-Year LPR.
- Keeping within China, agriculture-related stocks have outperformed, reflecting rising worry re: lower domestic grain production amidst extreme weather conditions.
- The ASX200 sits 0.9% weaker, backing away from 11-week highs made on Friday. Virtually all sectors are in the red at typing, with tech stocks leading the way lower (S&P/ASX All Tech Index: -1.9%).
- E-minis deal 0.3-0.5% softer, a little off fresh one-week lows at writing.
GOLD: Fresh Four-Week Lows In Asia
Gold is little changed, printing $1,747/oz at writing, operating just above four-week lows ($1,744.9/oz) made earlier in the session. The precious metal continues to drift lower after a brief show above $1,800/oz earlier in August, facing headwinds from a simultaneous rally in the USD (DXY) and U.S. real yields.
- To recap, gold closed ~$12/oz weaker on Friday, ending lower for the week on the back of five consecutive lower daily closes, snapping a four-week streak of higher weekly closes in the process.
- Gold dipped to fresh lows on Friday amidst Fedspeak from Richmond Fed Pres Barkin (‘24 voter), after he stated that the Fed would “do what it takes” to bring inflation back to 2% even if it caused a recession, adding to the recent chorus of hawkish Fedspeak.
- Looking ahead, the key risk event for gold this week looks to be Fed Chair Powell’s keynote speech at the annual Jackson Hole Symposium, to be delivered on Friday.
- From a technical perspective, gold has broken key short-term support at $1,754.4/oz (Aug 3 low), exposing further support at $1,711.7/oz (Jul 27 low). On the other hand, key resistance is situated at $1,807.9/oz (Aug 10 high and bull trigger).
OIL: Lower In Asia; Iran Nuclear Deal Eyed
WTI and Brent are ~$0.90 worse off apiece, consolidating after a pullback from their respective one-week highs made on Friday, with both contracts on track to snap a three-day streak of higher daily closes amidst optimism re: a return of Iranian crude to global supplies.
- To elaborate, unconfirmed, leaked reports by Iran International pointed to potential U.S. concessions to Iran, including measures on sticking points such as U.S. sanctions against the IRGC.
- Al Jazeera sources on Friday also placed a U.S.-Iran nuclear deal as “imminent”, with plans to allow Iran to export crude “within 120 days of signing the agreement”.
- Crude also faces limited headwinds on economic growth worry amidst power rationing in China’s Sichuan province (19 of 21 cities were ordered to halt industrial production for six days last week), although the power cuts are currently much less extensive than those witnessed in ‘21.
- Due to Sichuan’s unique reliance on hydroelectricity (~80% of the grid), the shortage is expected to remain limited, barring the impact of drawdowns on energy supplies from surrounding provinces.
- RTRS sources have said that the Caspian Pipeline Consortium (CPC) has suspended some oil loadings at a Black Sea terminal, although the impact on overall loadings is reportedly limited owing to lowered output due to ongoing maintenance at major Kazakh oil fields (since early-Aug).
UP TODAY (Times GMT/Local)
| Date | GMT/Local | Impact | Flag | Country | Event |
| 22/08/2022 | 1530/1130 | * |  | US | US Treasury Auction Result for 13 Week Bill |
| 22/08/2022 | 1530/1130 | * |  | US | US Treasury Auction Result for 26 Week Bill |
| 23/08/2022 | 2300/0900 | *** |  | AU | IHS Markit Flash Australia PMI |
| 23/08/2022 | 0030/0930 | ** |  | JP | IHS Markit Flash Japan PMI |
| 23/08/2022 | 0715/0915 | ** |  | FR | IHS Markit Services PMI (p) |
| 23/08/2022 | 0715/0915 | ** |  | FR | IHS Markit Manufacturing PMI (p) |
| 23/08/2022 | 0730/0930 | ** |  | DE | IHS Markit Services PMI (p) |
| 23/08/2022 | 0730/0930 | ** |  | DE | IHS Markit Manufacturing PMI (p) |
| 23/08/2022 | 0800/1000 | ** |  | EU | IHS Markit Services PMI (p) |
| 23/08/2022 | 0800/1000 | ** |  | EU | IHS Markit Manufacturing PMI (p) |
| 23/08/2022 | 0800/1000 | ** |  | EU | IHS Markit Composite PMI (p) |
| 23/08/2022 | 0830/0930 | *** |  | UK | IHS Markit Manufacturing PMI (flash) |
| 23/08/2022 | 0830/0930 | *** |  | UK | IHS Markit Services PMI (flash) |
| 23/08/2022 | 0830/0930 | *** |  | UK | IHS Markit Composite PMI (flash) |
| 23/08/2022 | 0900/1000 | * |  | UK | Index Linked Gilt Outright Auction Result |
| 23/08/2022 | 1000/1100 | ** |  | UK | CBI Industrial Trends |
| 23/08/2022 | 1100/1300 |  | EU | ECB Panetta at ECB Policy Panel at EEA Annual Congress | |
| 23/08/2022 | 1230/0830 | ** |  | US | Philadelphia Fed Nonmanufacturing Index |
| 23/08/2022 | 1255/0855 | ** |  | US | Redbook Retail Sales Index |
| 23/08/2022 | 1345/0945 | *** |  | US | IHS Markit Manufacturing Index (flash) |
| 23/08/2022 | 1345/0945 | *** |  | US | IHS Markit Services Index (flash) |
| 23/08/2022 | 1400/1600 | ** |  | EU | Consumer Confidence Indicator (p) |
| 23/08/2022 | 1400/1000 | *** |  | US | New Home Sales |
| 23/08/2022 | 1400/1000 | ** |  | US | Richmond Fed Survey |
| 23/08/2022 | 1530/1130 | * |  | US | US Treasury Auction Result for Cash Management Bill |
| 23/08/2022 | 1700/1300 | * |  | US | US Treasury Auction Result for 2 Year Note |
To read the full story
Sign up now for free trial access to this content.
Please enter your details below.
Why MNI
MNI is the leading provider
of intelligence and analysis on the Global Fixed Income, Foreign Exchange and Energy markets. We use an innovative combination of real-time analysis, deep fundamental research and journalism to provide unique and actionable insights for traders and investors. Our "All signal, no noise" approach drives an intelligence service that is succinct and timely, which is highly regarded by our time constrained client base.Our Head Office is in London with offices in Chicago, Washington and Beijing, as well as an on the ground presence in other major financial centres across the world.
