-
Policy
Policy
Exclusive interviews with leading policymakers that convey the true policy message that impacts markets.
LATEST FROM POLICY: -
EM Policy
EM Policy
Exclusive interviews with leading policymakers that convey the true policy message that impacts markets.
LATEST FROM EM POLICY: -
G10 Markets
G10 Markets
Real-time insight on key fixed income and fx markets.
Launch MNI PodcastsFixed IncomeFI Markets AnalysisCentral Bank PreviewsFI PiFixed Income Technical AnalysisUS$ Credit Supply PipelineGilt Week AheadGlobal IssuanceEurozoneUKUSDeep DiveGlobal Issuance CalendarsEZ/UK Bond Auction CalendarEZ/UK T-bill Auction CalendarUS Treasury Auction CalendarPolitical RiskMNI Political Risk AnalysisMNI Political Risk - US Daily BriefMNI Political Risk - The week AheadElection Previews -
Emerging Markets
Emerging Markets
Real-time insight of emerging markets in CEMEA, Asia and LatAm region
-
Commodities
-
Credit
Credit
Real time insight of credit markets
-
Data
-
Global Macro
Global Macro
Actionable insight on monetary policy, balance sheet and inflation with focus on global issuance. Analysis on key political risk impacting the global markets.
Global MacroDM Central Bank PreviewsDM Central Bank ReviewsEM Central Bank PreviewsEM Central Bank ReviewsBalance Sheet AnalysisData AnalysisEurozone DataUK DataUS DataAPAC DataInflation InsightEmployment InsightGlobal IssuanceEurozoneUKUSDeep DiveGlobal Issuance Calendars EZ/UK Bond Auction Calendar EZ/UK T-bill Auction Calendar US Treasury Auction Calendar Global Macro Weekly -
About Us
To read the full story
Sign up now for free trial access to this content.
Please enter your details below.
Why MNI
MNI is the leading provider
of intelligence and analysis on the Global Fixed Income, Foreign Exchange and Energy markets. We use an innovative combination of real-time analysis, deep fundamental research and journalism to provide unique and actionable insights for traders and investors. Our "All signal, no noise" approach drives an intelligence service that is succinct and timely, which is highly regarded by our time constrained client base.Our Head Office is in London with offices in Chicago, Washington and Beijing, as well as an on the ground presence in other major financial centres across the world.
Real-time Actionable Insight
Get the latest on Central Bank Policy and FX & FI Markets to help inform both your strategic and tactical decision-making.
Free AccessMNI EUROPEAN MARKETS ANALYSIS: ECB Expected To Cut Rates Later
MNI EUROPEAN OPEN: A$ & Local Yields Surge Following Jobs Data
MNI EUROPEAN MARKETS ANALYSIS: Yen Prints Multi-Decade Lows, Sentiment Sours
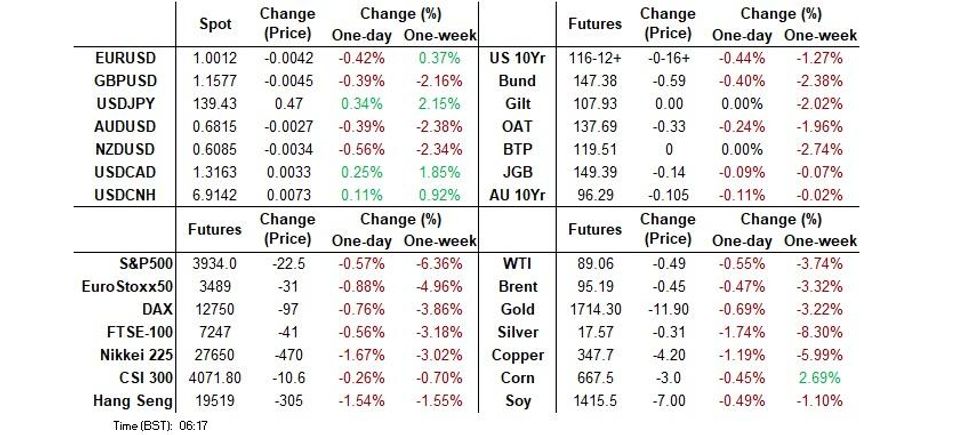
- Risk sentiment sours on the back of a below-forecast Chinese Caixin M'fing PMI print and the news that China is locking down Sichuan's capital city Chengdu. The equity space comes under pressure as U.S. restricts some chip exports to China.
- USD/JPY surges to its highest point since 1998 amid broad-based greenback strength linked to hawkish Fed musings. Comments from a Japanese MoF official fail to arrest the yen's decline.
- PMI readings from across the globe will keep hitting the wires today, with EZ unemployment as well as U.S. jobless claims & construction spending also eyed. The central bank speaker slate features Fed's Bostic, ECB's Centeno, Norges Bank's Bache & Riksbank's Ingves.

US TSYS: Tug-Of-War Between Hawkish Fed Musings & Risk Aversion
The initial pressure applied to U.S. Tsys by hawkish Fed musings in early Tokyo trade eased off somewhat as the session progressed, albeit the swaps market still indicates a boost to Fed tightening bets.
- Reprieve for core FI space came in the way of renewed demand for safer assets amid fragile market sentiment.
- The tech sector led U.S. e-mini futures lower from the off amid jitters surrounding new restrictions on the exports of some computing chips to China.
- T-Notes initially ignored softer equity sentiment and faltered before finding a base at 116-08. Their bounce off lows was facilitated by an unexpected drop in China's Caixin M'fing PMI below the breakeven 50 level.
- A fresh round of risk-off flows emerged as China locked down Sichuan' capital city Chengdu and announced a mass testing campaign there. This cemented pre-existing risk aversion.
- T-Notes last trade -0-16+ at 116-12+, within touching distance from their opening levels. Eurodollars run 2.75-6.00 ticks lower through the reds. Cash Tsy curve was subject to marginal twist steepening, with yields last -0.6bp to +0.9bp.
- Note that the yield on 2-Year Tsys crossed above the 3.5% mark for the first time since 2007 in the Asia morning, but pulled back below that figure later in the session.
- U.S. jobless claims, m'fing PMI figures and construction spending headline the local data docket today, while Fed's Bostic is set to speak.
JGBS: JGBs Lag Recovery In Core FI, 10-Year Auction Under Scrutiny
JGB futures regained poise amid re-emerging risk aversion but a mixed 10-Year auction saw them lose some altitude again.
- Initial selling pressure was linked to hawkish Fed/ECB talk from Wednesday, which pulled the rug from beneath the broader core FI space in early dealing.
- Futures recovered into the Tokyo lunch break as China's Caixin M'fing PMI came in at 49.5, missing the median estimate of 50.0.
- JBU2 returned from lunch on a firmer footing, but erased those gains as participants parsed the details of the latest 10-Year JGB auction. Pricing data were mixed as the tail narrowed at the margin, but the low price printed below the average estimate from a BBG dealer poll.
- The news that China has locked down the city of Chengdu to contain the local outbreak of COVID-19 failed to rekindle demand for JGBs despite generating some fresh risk-off flows.
- JGB futures last trade at 149.37, 16 ticks shy of Wednesday's settlement. Cash JGB curve runs steeper, yields sit higher. The U.S./Japan 10-year yield gap is slightly tighter.
AUSSIE BONDS: Risk-Off Flows Counter Initial Selling Impetus
Overnight impetus weighed on ACGBs in early trade but the sell-off lost momentum as risk sentiment soured. Negative news from China were critical in spoiling the mood.
- Wednesday's hawkish Fed/ECB chatter reverberated in the Asia-Pac session, applying pressure to core FI in morning trading hours.
- Aussie bond futures sold off in early Sydney dealing, taking another leg lower around the Tokyo open, with pressure on core FI space intensifying.
- Worsening risk appetite threw a lifeline to core FI. Aussie bonds stabilised as China's Caixin M'fing PMI printed at 49.5 (versus 50.0 expected), while Australian data proved underwhelming, at least on the surface.
- Australia's capex unexpectedly contracted for the second consecutive quarter in the three months through end-Jun, while home loan values fell to the lowest level in 17 months. We flagged some caveats in earlier bullets, but headline figures disappointed.
- Richening impetus crept in later in the session as China locked down Sichuan's capital city of Chengdu in a bid to contain the local COVID-19 flare-up. The news knocked risk appetite on its head.
- When this is being typed, Aussie bond futures are moving away from earlier lows, with YM last -8.5 & XM -10.0. Bills trade 3-10 ticks lower through the reds. Cash ACGB curve runs steeper, with yields sitting 6.7bp-10.0bp higher.
FOREX: USD Soars Amid Hawkish Fed Expectations, Yen Refreshes Multi-Decade Lows
Hawkish Fed musings provided the initial boost to the greenback, sending it to the top of the G10 scoreboard. Demand for the U.S. dollar was amplified by subsequent risk-negative signals. The BBDXY index punched through Wednesday's peak and the 1,300 mark to print its best levels since Jul 14, when it lodged the most recent cyclical high.
- Market sentiment was fragile from the off, as headwinds for the tech sector weighed on U.S. e-mini futures. An unexpected contractionary reading of China's Caixin M'fing PMI helped discourage participants from taking on more risk. In the final blow to sentiment, China locked down Sichuan's capital city Chengdu in response to the local outbreak of COVID-19.
- The news about Chengdu lockdown inspired a fresh leg higher in USD/CNH amid a broader round of risk-off flows. This frustrated the PBOC's efforts to lean against yuan depreciation via its USD/CNY mid-point fixings.
- The People's Bank delivered a stronger than expected fixing for the seventh consecutive day, this time setting the reference rate 103 pips below the sell-side estimate. Some speculated that the PBOC may have adjusted its fixing formula (counter-cyclical factor) without announcing it publicly.
- Hawkish Fed positioning delivered a fresh blow to the yen, with USD/JPY running to Y139.68, its highest point since 1998, which brings the psychological Y140.00 figure into view. The move prompted Japan's MoF to warn against abrupt moves in the exchange rate, to no avail. With the spot rate piercing recent cyclical highs, one-month risk reversal moved above par. Although renewed risk aversion provided some reprieve to the broader yen, USD/JPY stabilised near session highs.
- PMI readings from across the globe will keep hitting the wires today, with EZ unemployment as well as U.S. jobless claims & construction spending also eyed. The central bank speaker slate features Fed's Bostic, ECB's Centeno, Norges Bank's Bache & Riksbank's Ingves.
AUSTRALIA DATA: Capex Outlook Promising
Total capital expenditure for Q2 was weaker than expected falling 0.3% q/q and is trending down, but the breakdown showed resilience in machinery & equipment expenditure (+2.1% q/q). The decline in the total was driven by building & structures, which was down 2.5% q/q – the second consecutive fall.
- Investment intentions for the current financial year rose by 11.7% after 12.3% in the last estimate. This is a positive for the Australian investment and growth outlook. It was 8.9% higher for investment in buildings & structures and 15.9% higher in machinery & equipment, continuing the trends in the actual expenditure data.
- The mining sector expects to increase capital spending by 5.9%, lower than non-mining.
- This data feeds into the national accounts and total capital expenditure has a good correlation with total gross fixed capital formation in GDP and machinery & equipment has a very high correlation with the private sector equivalent. But some caution is needed when interpreting the impact of this release on GDP, as Q1 has now been revised up from -0.3%q/q to +0.4%q/q to be more in line with the national accounts.
- The state breakdown actually shows a better investment picture than the headline, with 5 of the 8 states and territories posting increases (including NSW & Victoria).
Australia: Real capital expenditure y/y%
Source: MNI - Market News, ABS
FX OPTIONS: Expiries for Sep01 NY cut 1000ET (Source DTCC)
- EUR/USD: $1.0000(E595mln)
- USD/JPY: Y137.75-80($550mln), Y138.10($740mln)
- AUD/USD: $0.6865-67(A$873mln)
- USD/CAD: C$1.2950($785mln)
ASIA FX: Divergent PMI Trends, But All USD/Asia Pairs Higher
Today has delivered divergent PMI prints for Asian economies in August. Faltering outcomes are evident for South Korea and Taiwan, while China's Caixin PMI surprised on the downside. In South East Asia though, PMI trends were more resilient. USD/Asia pairs are still higher across the board, in line with USD gains against the majors.
- CNH: USD/CNH has tracked within recent ranges, currently holding just under 6.9200. The CNY fixing was again much stronger than expected (-103pips relative to expectations), while the Caixin PMI slipped back into contractionary territory (49.5, versus 50.0 expected). Onshore equities are slightly higher though.
- KRW: USD/KRW has pushed to fresh cyclical highs at 1355 (last 1353.5). Onshore equities have slumped, down -1.80%, while offshore investors have sold close to $400mn of local shares. Trade figures showed a record wide deficit, while the PMI fell deeper into contractionary territory (47.6).
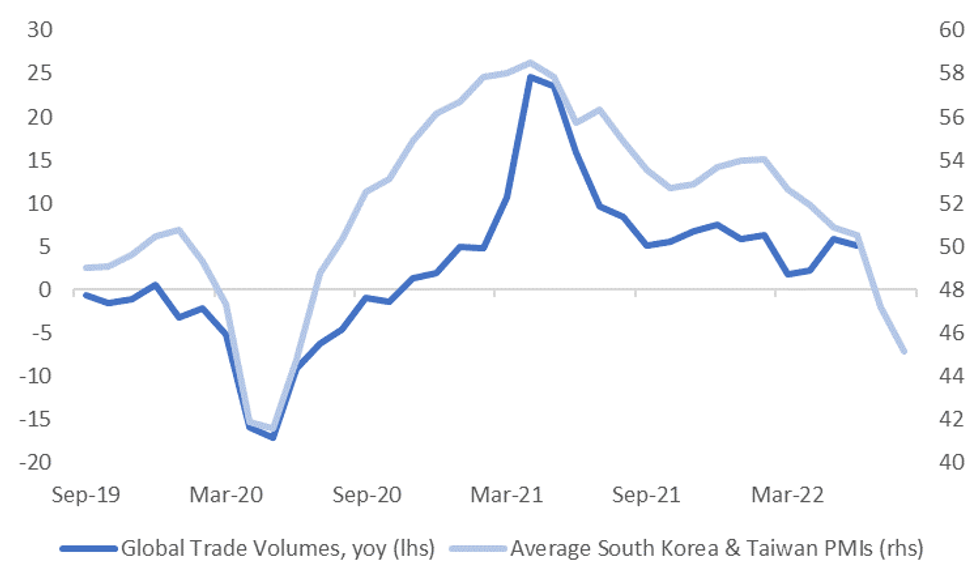
- TWD: USD/TWD has also risen to fresh highs, touching 30.50, fresh highs back to late 2019. Like Korea, onshore equities have fallen sharply, while the Taiwan PMI at 42.7 for August is nearly at 2020 lows. This, along with the South Korea PMI, are flashing a warning for the global trade outlook.
- THB: USD/THB is up a further 0.77% today to 36.75. Late July highs close to 37.00 are within sight. Equity outflows were reasonably large yesterday, while the SET is off a further 0.7% today. The latest S&P Global M'fing PMI provided a sweetener, indicating that expansion quickened in Aug. Headline index rose to a fresh all-time high of 53.7 from 52.4 recorded in the prior month.
- PHP: Spot USD/PHP last trades +0.27 at PHP56.43, with bulls looking for further gains towards record highs of PHP56.500. The Philippines' S&P Global M'fing PMI improved to 51.2 in Aug from 50.8 prior, albeit the authors of the survey warned that intensifying "downside risks to growth challenge the sector."
- IDR: Spot USD/IDR has added 40 figs and last deals at IDR14,883. Familiar technical levels remain in play. Indonesia's S&P Global M'fing PMI rose to 51.7 in Aug from 51.3 prior amid "more pronounced growth in both output and total new orders." Headline CPI came in a touch softer than expected (4.69% YoY versus 4.87% expected), although core accelerated further to 3.04%.
ASIA: Market Insight: North Asia PMIs Flash Global Trade Warning
Today's South Korean and Taiwan PMI prints for August point to downside risks for the global trade outlook. The first chart below plots the average PMI reading for each country against the YoY change in global trade volumes growth. Note global trade volume figures are only reported up until June of this year.
- Both economies are key bellwethers for the global outlook, so it isn't surprising to see a firm relationship between the two series in the chart below.
- There are of course potential caveats. Today's PMI weakness could reflect greater exposure to both economies to China. Also out today was South Korean export figures for August. This data showed export growth to China continued to ease (-5.4% YoY), while growth to the US and EU remained positive, albeit down from early 2022 highs.
- Aggregate export growth for South Korea continues to moderate though, while Taiwan's export order print fell in July to -1.9%.
Fig 1: North Asia PMIs Flash Global Trade Warning
 Source: CPB Netherlands Bureau for Economic Policy Analysis/MNI- Market News/Bloomberg
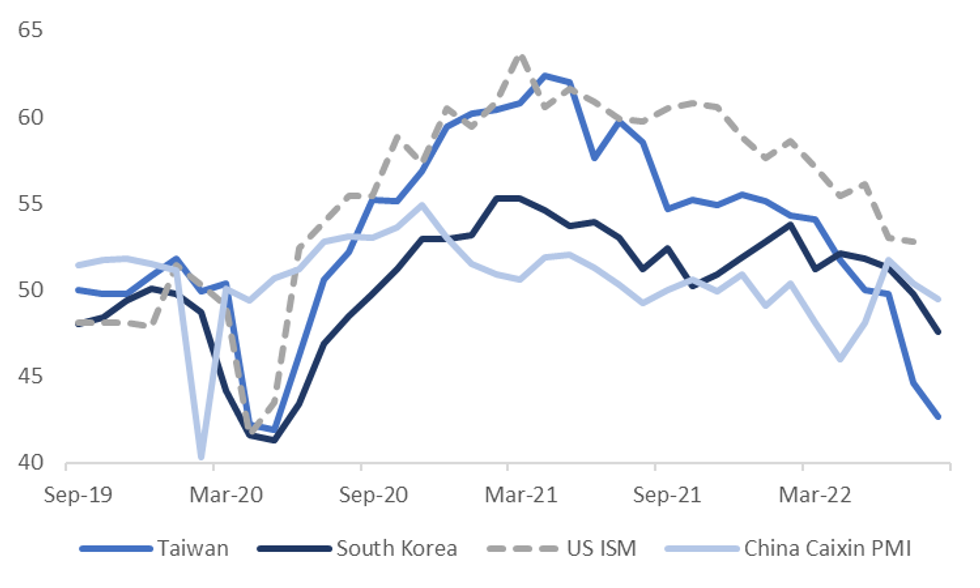
- The South Korean and Taiwan PMIs also maintain a reasonable correlation with the US ISM reading, more so than the China Caixin PMI, see the chart below. We get a fresh update on the ISM later this evening.
- The market consensus expects a further cooling in the print (51.9 is forecast, versus 52.8 previously).
- Today's weaker PMI prints add to the downside risks to the US ISM print, and PMI prints elsewhere, at face value.
- Of course, in levels terms the US ISM remains comfortably above PMI prints for these North East Asian economies, which still may serve the USD well on a relative value basis.
- It's noteworthy today that both USD/KRW and USD/TWD both printed at fresh cyclical highs.
Fig 2: NEA PMIs & The US ISM
 Source: MNI- Market News/Bloomberg
SOUTH KOREA DATA: Record Trade Deficit In August, Exports Slow, PMI back to 2020 Levels
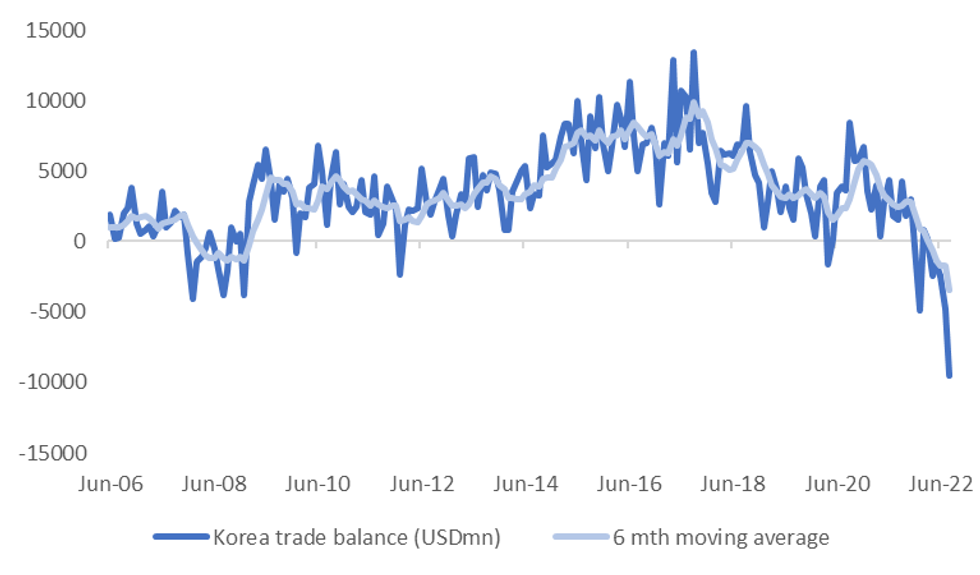
August trade figures for South Korea were dominated by a record trade deficit of just under -$9.5bbn. This was wider than market expectations of -$8.158bn. The trend in the trade balance remains an adverse one for the won, see the chart below.
- It's also becoming more of a focus point for policy makers. Yesterday the authorities announced 351t won in export financing, a record amount. This comes amid fears of a further slowdown in export growth.
- At the same time the authorities will look to source other commodities (outside of LNG, oil) to lower energy costs. Whilst metrics for Korea's terms of trade have moved away from recent lows (see the Citi index on Bloomberg CTOTKRW <Index>), import volumes may remain strong to ensure supply ahead of the winter months.
- The value of energy imports is up over 90% in the past year.
Fig 1: South Korea's Trade Deficit At Record Wides
 Source: MNI - Market News/Bloomberg
- Export growth was slightly better than expected at +6.6% YoY, versus +5.6% expected. Still, it was a slowdown from the previous month and details weren't that positive though, with chip exports falling (-7.8%), while adjusting for work day differences showed just +2.2% YoY growth compared to August last year.
- The PMI has also printed for August, slipping down to 47.6, levels last seen back to mid 2020.
EQUITIES: Softer As Chipmaker Sentiment Sours
Most major regional equity indices are >1% softer at writing, building on a negative lead from Wall St. in a session that saw sentiment sapped by headlines re: China’s full lockdown of Chengdu, adding to bearish pressure from a sell-off in U.S. chipmakers in Wednesday’s post-market NY session.
- The Hang Seng deals 1.5% softer after opening lower, hitting fresh session lows on news of Chengdu’s lockdown, with >85% of the index’s constituents in the red at typing.
- China-based developer stocks fared a little better despite early data from the top 100 developers on Wednesday pointing to slumping new-home sales (-32.9% Y/Y). The Hang Seng Mainland Properties Index deals 0.3% firmer (back from as much as 1.4% higher), while the CSI300 Real Estate Index has added 2.5%.
- The CSI300 bucked the broader trend of losses, dealing 0.1% firmer with the energy sub-index (+4.1%) leading gains after the addition of several stocks to the FTSE China 50 and A50 indices, offsetting some underperformance in high-beta consumer staples (-0.7%).
- The Nikkei 225 sits 1.6% worse off at writing on losses across virtually every sector, with energy (-3.0%) and IT (2.6%) stocks underperforming by the largest margin, reflecting weakness in crude prices and semiconductor sentiment (following announced U.S. restrictions on some chip exports to China).
- E-minis are 0.4-1.2% softer at writing, operating around session lows, with NASDAQ 100 contracts leading losses.
GOLD: Six-Week Lows In Asia; ~$1,700/oz Support Eyed
Gold deals ~$6/oz softer to print ~$1,705/oz at writing, operating a little above fresh six-week lows (at $1,702.4/oz) amidst an uptick in the USD (DXY).
- To recap, the precious metal closed $13/oz lower on Wednesday, falling for a second straight session on a rise in U.S. real yields and Fed tightening-related worry, with Cleveland Fed Pres Mester reiterating that it would be “necessary” to raise rates to “somewhat above 4% by early next year and hold it there”,
- Sep FOMC dated OIS now price in ~76bp of tightening at that meeting (up from ~68bp on Wednesday), fully pricing in a 75bp hike, coming as ECB pricing has ticked higher ahead of the central bank’s decision on Sep 8 as well.
- From a technical perspective, gold operates just above initial support at $1,700.0/oz (round number support), with further support seen at $1,681.0/oz (Jul 21 low and bear trigger). On the other hand, initial resistance is located at ~$1,765.5/oz (Aug 25 high).
OIL: A Little Above One Week Lows
WTI and Brent are ~$0.30 softer apiece, having struggled to rise above neutral levels amidst lingering worry re: global slowdowns, exacerbated by soft regional PMI prints.
- To elaborate, PMIs from China and South Korea printed within contractionary territory, while final Australian m’fing PMI was revised lower (53.8 from 54.5).
- Looking to Wednesday’s price action, both benchmarks closed >$2 lower each, pressured by a well-documented rise in worry surrounding hawkish Fed/ECB policy.
- Crude remained weak even after EIA inventory data showed crude stockpiles declining by significantly more than expected (and falling for a third straight week), with drawdowns observed in gasoline and hub stocks. Meanwhile, distillate inventories saw a surprise, marginal build.
- Elsewhere, reports have pointed to OPEC+ experts halving earlier forecasts of a global crude supply surplus in ‘22, mainly on persistent underproduction from members, with projections for ‘23 forecasting a 300K bpd deficit (down from a 900K bpd surplus prior). OPEC+ next meets on Sep 5.
- Iran continues to review the U.S. reply to the EU’s “final draft” re: a U.S.-Iran nuclear deal (having previously assured a reply by Sep 2), with the Iranian FM on Wed repeating a request for “stronger guarantees” from the U.S. re: not abandoning the deal.
- Looking ahead, G7 finance ministers will meet to discuss a possible price cap on Russian oil on Friday.
UP TODAY (Times GMT/Local)
| Date | GMT/Local | Impact | Flag | Country | Event |
| 01/09/2022 | 0630/0830 | *** |  | CH | CPI |
| 01/09/2022 | 0630/0830 | ** |  | CH | retail sales |
| 01/09/2022 | 0715/0915 | ** |  | ES | IHS Markit Manufacturing PMI (f) |
| 01/09/2022 | 0745/0945 | ** |  | IT | IHS Markit Manufacturing PMI (f) |
| 01/09/2022 | 0750/0950 | ** |  | FR | IHS Markit Manufacturing PMI (f) |
| 01/09/2022 | 0755/0955 | ** |  | DE | IHS Markit Manufacturing PMI (f) |
| 01/09/2022 | 0800/1000 | ** |  | EU | IHS Markit Manufacturing PMI (f) |
| 01/09/2022 | 0830/0930 |  | UK | S&P Global Manufacturing PMI (f) | |
| 01/09/2022 | 0830/0930 | ** |  | UK | IHS Markit/CIPS Manufacturing PMI (Final) |
| 01/09/2022 | 0830/0930 |  | UK | BOE Decision Makers Panel | |
| 01/09/2022 | 0900/1000 | ** |  | UK | Gilt Outright Auction Result |
| 01/09/2022 | - | *** |  | US | Domestic-Made Vehicle Sales |
| 01/09/2022 | 1230/0830 | * |  | CA | Building Permits |
| 01/09/2022 | 1230/0830 | ** |  | US | Jobless Claims |
| 01/09/2022 | 1230/0830 | ** |  | US | Non-Farm Productivity (f) |
| 01/09/2022 | 1345/0945 | *** |  | US | IHS Markit Manufacturing Index (final) |
| 01/09/2022 | 1400/1000 | *** |  | US | ISM Manufacturing Index |
| 01/09/2022 | 1400/1000 | * |  | US | Construction Spending |
| 01/09/2022 | 1430/1030 | ** |  | US | Natural Gas Stocks |
| 01/09/2022 | 1530/1130 | * |  | US | US Bill 08 Week Treasury Auction Result |
| 01/09/2022 | 1530/1130 | ** |  | US | US Bill 04 Week Treasury Auction Result |
| 01/09/2022 | 1930/1530 |  | US | Atlanta Fed's Raphael Bostic |
To read the full story
Sign up now for free trial access to this content.
Please enter your details below.
Why MNI
MNI is the leading provider
of intelligence and analysis on the Global Fixed Income, Foreign Exchange and Energy markets. We use an innovative combination of real-time analysis, deep fundamental research and journalism to provide unique and actionable insights for traders and investors. Our "All signal, no noise" approach drives an intelligence service that is succinct and timely, which is highly regarded by our time constrained client base.Our Head Office is in London with offices in Chicago, Washington and Beijing, as well as an on the ground presence in other major financial centres across the world.
