
Free Trial
Why MNI
MNI is the leading provider
of intelligence and analysis on the Global Fixed Income, Foreign Exchange and Energy markets. We use an innovative combination of real-time analysis, deep fundamental research and journalism to provide unique and actionable insights for traders and investors. Our "All signal, no noise" approach drives an intelligence service that is succinct and timely, which is highly regarded by our time constrained client base.Our Head Office is in London with offices in Chicago, Washington and Beijing, as well as an on the ground presence in other major financial centres across the world.
EMERGING MARKETS
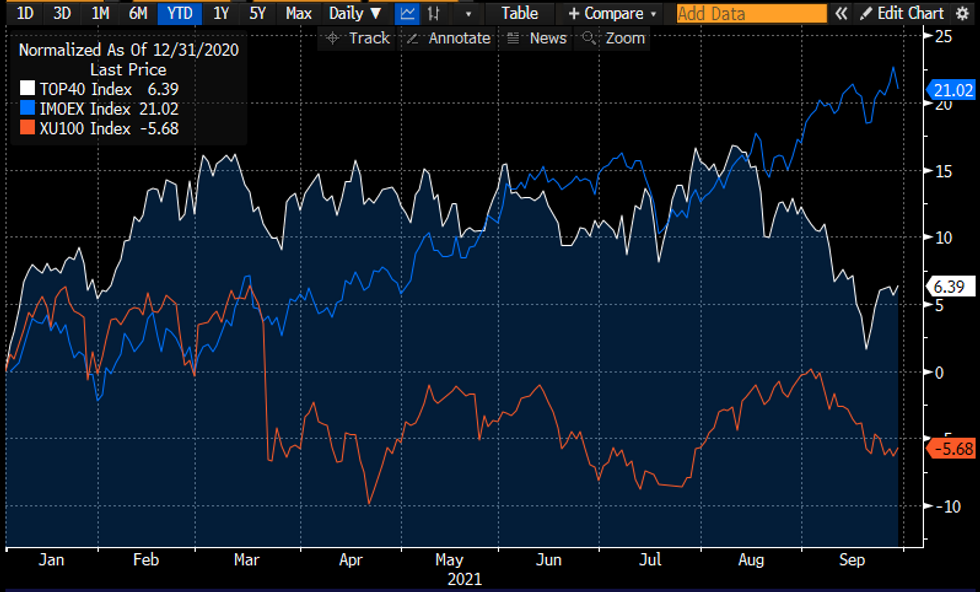
- Russia's MOEX index has continued to outperform in September, making it the leading regional equity index when compared with peers SA & Turkey.
- The MOEX trades + 21.08% higher YTD & +2.14% in September, SA's Top40 stands +6.34% higher YTD & -5.28% m/m and Turkey's XU100 holds -5.66% YTD & -5.55% m/m.
- Higher oil/gas prices and a relatively more resilient domestic currency have been the standout factors in Russia's outperformance – with monopoly Gazprom cashing in on the gas shortage in Europe.
- Meanwhile, the downturn in China and precious metals prices has been the primary source of weakness for SA equities which relinquished their top performer status in August. In Turkey, central bank uncertainty and low monetary policy credibility have been weighing on equity prices.
- From a valuation standpoint, the Moex trades off a 9.45x P/E ratio & 1.21x P/B, Top40: 11.13x P/E & 1.99x P/B, XU 100: 7.62x P/E & 1.02x P/B.
- Here, Turkey stands out as the cheapest vs the EM benchmark at a 15.69x P/E & 1.86 P/B, but is currently 'cheap for a reason' and SA's Top40 will remain under pressure so long as growth concerns in china persist and US Treasury yields continue to rise.
- This places Russia as the most promising given the firmer currency, greater insulation from rising UST yields in terms of fiscal space and external position and macro tailwinds supporting its most closely correlated commodities. Nevertheless, a reversal in circumstances for Turkey & SA could trigger a more notable reversal opportunity.
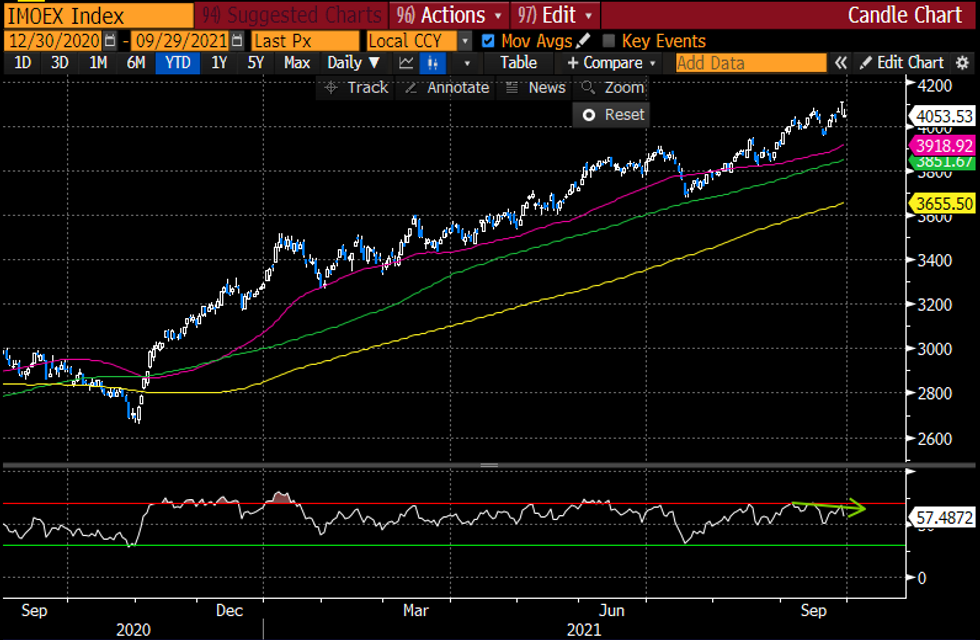
- The current trend remains bullish, underpinned by the 50 & 100dmas below. However, momentum seems to be flagging slightly with the RSI showing some marginal negative divergence on moves higher.
- First support stands at 3948.43, followed by dynamic support from the 50 & 100dmas in the 3918-3851 zone. Resistance and the all-time high stand at 4112.31.
 CEMEA Indices % Chg
MNI London Bureau | +44 020-3983-7894 | murray.nichol@marketnews.com
Why MNI
MNI is the leading provider
of intelligence and analysis on the Global Fixed Income, Foreign Exchange and Energy markets. We use an innovative combination of real-time analysis, deep fundamental research and journalism to provide unique and actionable insights for traders and investors. Our "All signal, no noise" approach drives an intelligence service that is succinct and timely, which is highly regarded by our time constrained client base.Our Head Office is in London with offices in Chicago, Washington and Beijing, as well as an on the ground presence in other major financial centres across the world.
We are facing technical issues, please contact our team.
ok
Your request was sent sucessfully! Our team will contact you soon.
ok