
Free Trial
Why MNI
MNI is the leading provider
of intelligence and analysis on the Global Fixed Income, Foreign Exchange and Energy markets. We use an innovative combination of real-time analysis, deep fundamental research and journalism to provide unique and actionable insights for traders and investors. Our "All signal, no noise" approach drives an intelligence service that is succinct and timely, which is highly regarded by our time constrained client base.Our Head Office is in London with offices in Chicago, Washington and Beijing, as well as an on the ground presence in other major financial centres across the world.
US DATA
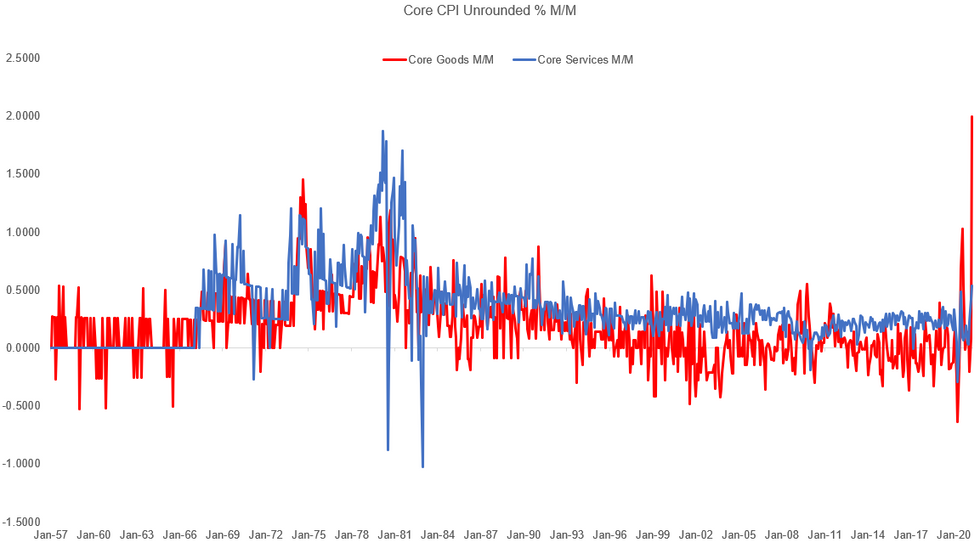
Core goods % M/M looks like by far the biggest increase ever in the series going back to the late 1950s, at +2.0% (previous high was August 1974's +1.5%) - core services "just" +0.5% (but highest since Oct 1992). See chart below.
- Core goods now rising 4.4% Y/Y, decisively eclipsing services at +2.5%.
- The breakdown is interesting too: big contributors to services included airfares (+10.2% M/M) and lodging away from home (+7.7% M/M). But other areas were relatively tame: primary rents and owners' equivalent rent each +0.2% M/M. Were it not for these categories remaining subdued, we could have seen an even higher overall print.
- Used cars were +10.0% M/M (the biggest rise since the series began in 1953) and was responsible for 1/3 of the overall inflation rise. This closely-watched category has quickly caught up to some of the used car price surveys analysts pointed to for an April rise. This could effectively mean though that some of the price increase was "brought forward" from previous months.
 Source: BLS, MNI
Why MNI
MNI is the leading provider
of intelligence and analysis on the Global Fixed Income, Foreign Exchange and Energy markets. We use an innovative combination of real-time analysis, deep fundamental research and journalism to provide unique and actionable insights for traders and investors. Our "All signal, no noise" approach drives an intelligence service that is succinct and timely, which is highly regarded by our time constrained client base.Our Head Office is in London with offices in Chicago, Washington and Beijing, as well as an on the ground presence in other major financial centres across the world.
We are facing technical issues, please contact our team.
ok
Your request was sent sucessfully! Our team will contact you soon.
ok