
Free Trial
Why MNI
MNI is the leading provider
of intelligence and analysis on the Global Fixed Income, Foreign Exchange and Energy markets. We use an innovative combination of real-time analysis, deep fundamental research and journalism to provide unique and actionable insights for traders and investors. Our "All signal, no noise" approach drives an intelligence service that is succinct and timely, which is highly regarded by our time constrained client base.Our Head Office is in London with offices in Chicago, Washington and Beijing, as well as an on the ground presence in other major financial centres across the world.
EQUITY TECHS
- RES 4: 4361.00 High Aug 16 and a key M/T resistance
- RES 3: 4250.00 High Aug 26
- RES 2: 4194.25 High Sep 13 and a key resistance
- RES 1: 4180.00 High Dec 13
- PRICE: 3975.25 @ 14:23 GMT Dec 16
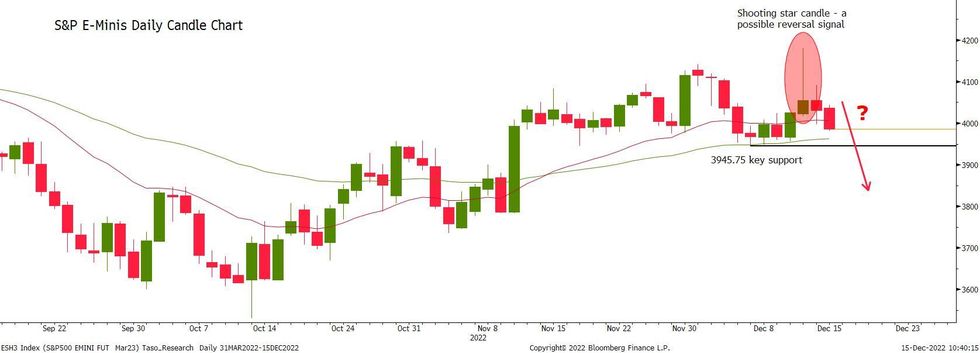
- SUP 1: 3960.81/3945.75 50-day EMA / Low Dec 7 and key support
- SUP 2: 3782.750 Low Nov 9
- SUP 3: 3735.00 Low Nov 3
- SUP 4: 3670.00 Low Oct 21
A rally in the S&P E-Minis Tuesday saw price trade above 4142.50, Dec 1 high. However, a strong reversal, resulted in a sharp move lower and price remains below Tuesday high. The contract is trading lower today and this highlights a possible bearish threat. Note that Tuesday’s candle pattern is a shooting star formation - a reversal signal. A continuation lower would expose key support at 3945.75, Dec 7 low. Key resistance is 4180.00, Dec 13 high.
Why MNI
MNI is the leading provider
of intelligence and analysis on the Global Fixed Income, Foreign Exchange and Energy markets. We use an innovative combination of real-time analysis, deep fundamental research and journalism to provide unique and actionable insights for traders and investors. Our "All signal, no noise" approach drives an intelligence service that is succinct and timely, which is highly regarded by our time constrained client base.Our Head Office is in London with offices in Chicago, Washington and Beijing, as well as an on the ground presence in other major financial centres across the world.
We are facing technical issues, please contact our team.
ok
Your request was sent sucessfully! Our team will contact you soon.
ok