
Free Trial
Why MNI
MNI is the leading provider
of intelligence and analysis on the Global Fixed Income, Foreign Exchange and Energy markets. We use an innovative combination of real-time analysis, deep fundamental research and journalism to provide unique and actionable insights for traders and investors. Our "All signal, no noise" approach drives an intelligence service that is succinct and timely, which is highly regarded by our time constrained client base.Our Head Office is in London with offices in Chicago, Washington and Beijing, as well as an on the ground presence in other major financial centres across the world.
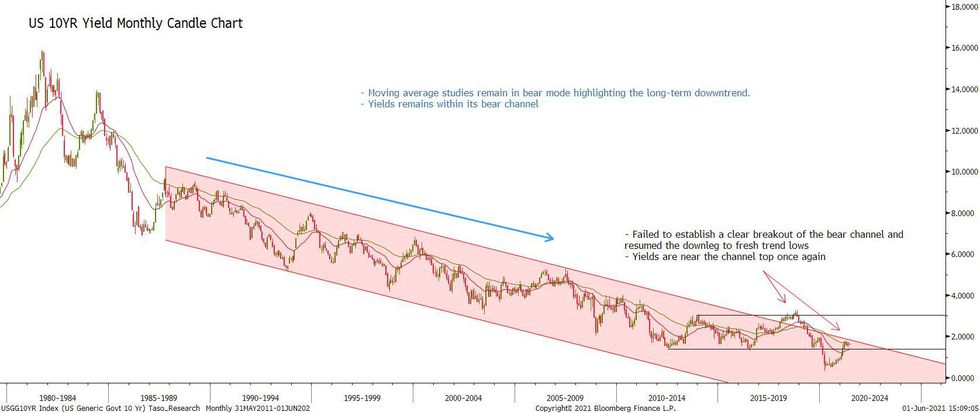
Government bond futures contracts have trended lower this year as the market debates inflation concerns. Here we review a number of long-term yield charts to evaluate the long-term trend conditions following this year's price activity.
The charts highlight the following:
- The long-term trend, looking at monthly charts, remains bearish.
- However, the short-term trend and it can be argued the medium-term direction is bullish. This suggests that for now at least, the uptrend in yields represents a correction.
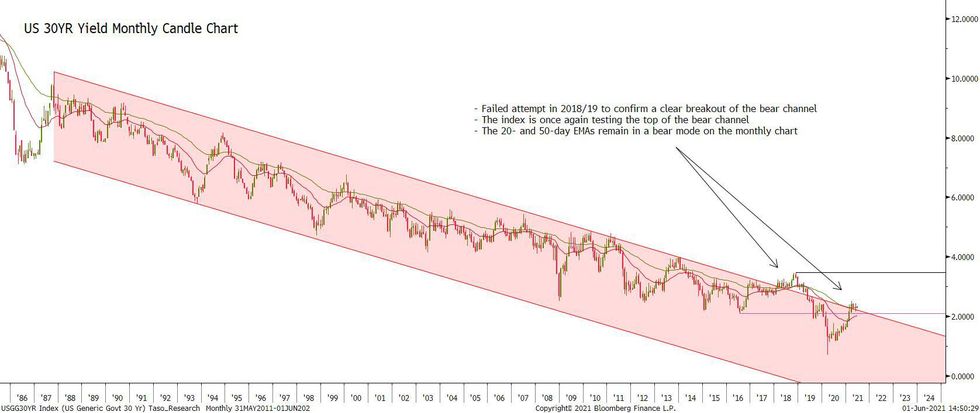
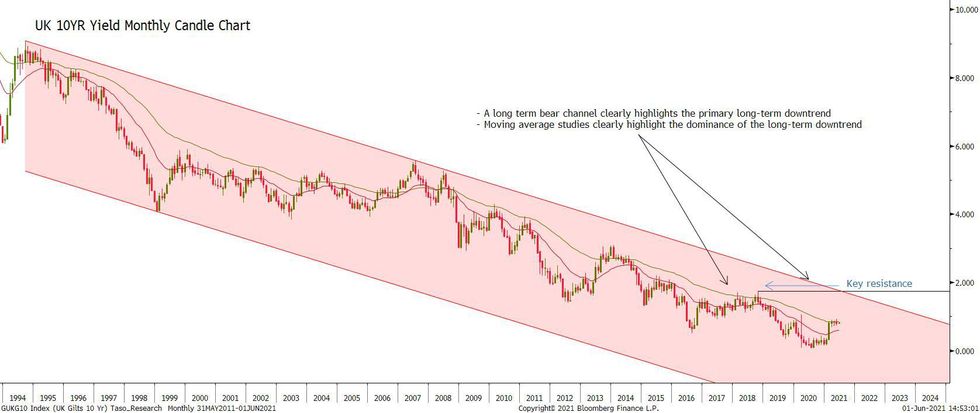
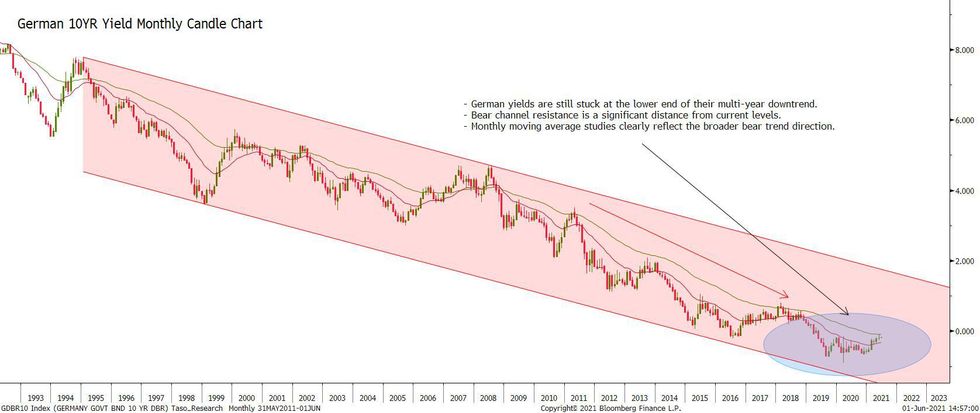
- Looking at the monthly frequency, bear channels are evident and the channel resistance levels remain intact. US yields are however closer to the channel top area where a break would represent a significant technical development.
- Moving average studies - the 20 and 50 day EMAs - remain in a bear mode condition.
- Channel breakouts and a reversal in the monthly EMA structure would represent a major directional shift in the trend and sentiment.
The charts below highlight these technical features:
Why MNI
MNI is the leading provider
of intelligence and analysis on the Global Fixed Income, Foreign Exchange and Energy markets. We use an innovative combination of real-time analysis, deep fundamental research and journalism to provide unique and actionable insights for traders and investors. Our "All signal, no noise" approach drives an intelligence service that is succinct and timely, which is highly regarded by our time constrained client base.Our Head Office is in London with offices in Chicago, Washington and Beijing, as well as an on the ground presence in other major financial centres across the world.
We are facing technical issues, please contact our team.
ok
Your request was sent sucessfully! Our team will contact you soon.
ok