
Why MNI
MNI is the leading provider
of intelligence and analysis on the Global Fixed Income, Foreign Exchange and Energy markets. We use an innovative combination of real-time analysis, deep fundamental research and journalism to provide unique and actionable insights for traders and investors. Our "All signal, no noise" approach drives an intelligence service that is succinct and timely, which is highly regarded by our time constrained client base.Our Head Office is in London with offices in Chicago, Washington and Beijing, as well as an on the ground presence in other major financial centres across the world.
Strong Single Currency Results in USD Nearing Last Week's Lows
Dealmaking was once again the focus for the session, with market prices hinging on negotiations taking place in both Washington DC and Brussels/London. A near-term fiscal deal struck between the White House and Nancy Pelosi looking slightly more unlikely ahead of Pelosi's self-imposed Tuesday deadline.
The prospects of a Brexit deal looked more favourable, with the EU releasing a statement of intent suggesting both sides will 'intensify' their contacts and the political will remains to strike a compromise. As a result, GBP outperformed, with GBP/USD trading either side of the 1.30 handle and the 1.3015 50-dma at the close.
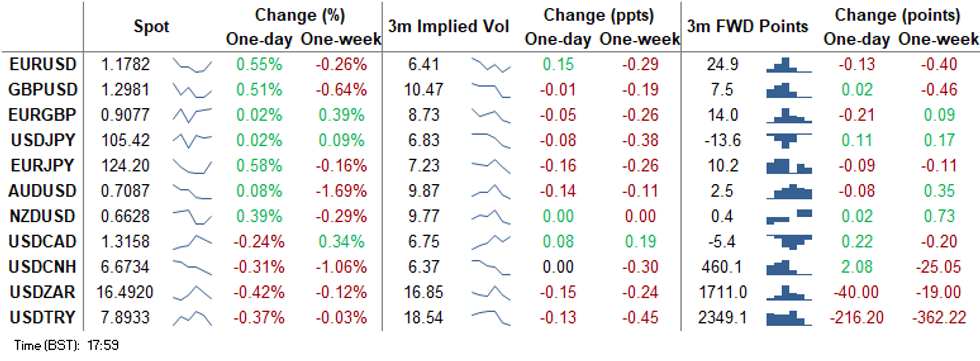
The USD was weaker, with the USD index narrowing the gap with last week's lows at 93.005.
Focus Tuesday turns to US housing starts & building permits data, as well as speeches from BoE's Vlieghe, ECB's de Cos and four different Fed speakers. The RBA minutes are also on the docket.
Expiries for Oct20 NY cut 1000ET (Source DTCC)
EUR/USD: $1.1650(E664mln), $1.1745(E1.4bln), $1.1790-00(E1.1bln), $1.1865-75(E688mln)
USD/JPY: Y105.00($760mln), Y105.50-60($1.1bln), Y106.35-50($2.5bln-USD calls)
AUD/USD: $0.7050(A$643mln)
Larger Option Pipeline
EUR/USD: Oct22 $1.1600(E1.2bln), $1.1645-50(E1.8bln), $1.1795-00(E1.1bln); Oct23 $1.1840-50(E1.1bln), $1.2000(E1.3bln); Oct26 $1.1500(E1.8bln), $1.1650-60(E1.5bln); Oct28 $1.1800-05(E1.4bln), $1.2000-05(E2.1bln); Oct30 $1.1800(E1.1bln)
USD/JPY: Oct21 Y105.00-10($1.9bln), Y105.50($1.1bln), Y105.90-106.00($2.3bln), Y106.65($1.0bln); Oct22 Y104.00-10($1.6bln), Y104.50-55($2.1bln), Y104.95-105.00($1.1bln), Y105.95-106.00($1.2bln); Oct26 Y103.95-104.00($1.5bln-USD puts), Y106.95-107.00($1.6bln); Oct27 Y105.00($1.2bln); Oct28 Y105.00($1.1bln); Oct29 Y106.00($1.2bln); Oct30 Y104.50($1.9bln), Y106.00-05($1.9bln)
EUR/GBP: Oct26 Gbp0.8900(E990mln), Gbp0.9000(E1.8bln-EUR puts)
AUD/USD: Oct21 $0.7600(A$1.1bln)
AUD/JPY: Oct22 Y76.44(A$2.1bln); Oct29 Y73.20(A$1.0bln-AUD puts), Y76.35-40(A$2.4bln-AUD calls)
AUD/NZD: Oct27 N$1.0809-20(A$2.5bln); Oct30 N$1.0750(A$1.2bln)
EURUSD: Firm Rally
- RES 4: 1.1917 High Sep 10 and 76.4% of the Sep 1 - 25 sell-off
- RES 3: 1.1872 High Sep 21
- RES 2: 1.1859 61.8% retracement of the Sep 1 - 25 sell-off
- RES 1: 1.1817/31 High Oct 13 / High Oct 9 and the bull trigger
- PRICE: 1.1790 @ 17:08 BST Oct 19
- SUP 1: 1.1685 Low Sep 30
- SUP 2: 1.1612/1581 Low Sep 25 and the bear trigger / Low Jul 24
- SUP 3: 1.1526 0.764 proj of Sep 1 - Sep 25 sell-off from Oct 9 high
- SUP 4: 1.1541 Low Jul 23
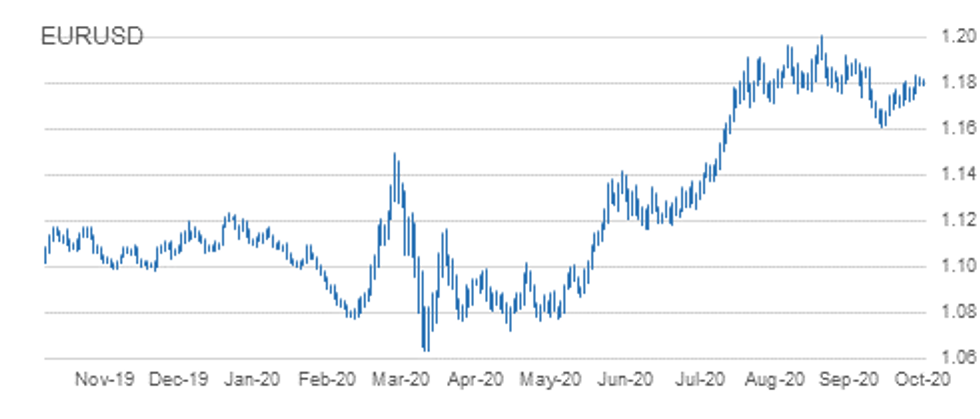
EURUSD continued to strengthen Monday as the pair recovers off last week's low of 1.1689 on Oct 15. A strong close Monday strengthens the intraday reversal and exposes key near-term resistance at 1.1831, Oct 12 high. This level represents the trigger for a resumption of the bullish reversal that occurred on Sep 25 and would open 1.1859 initially, a retracement level. Sub 1.1684 levels, Sep 30 low, is required to reinstate a bearish threat.
GBPUSD: Still Trading Below Recent Highs
- RES 4: 1.3186 Former trendline support drawn off the Mar 20 low
- RES 3: 1.3174 61.8% retracement of the Sep 1 - 23 sell-off
- RES 2: 1.3083 High Oct 12
- RES 1: 1.3030 High Oct 15
- PRICE: 1.2987 @ 17:41 BST Oct 19
- SUP 1: 1.2863 Low Oct 14
- SUP 2: 1.2846 Low Oct 7 and key near-term support
- SUP 3: 1.2806 Low Sep 30
- SUP 4: 1.2745 Low Sep 28
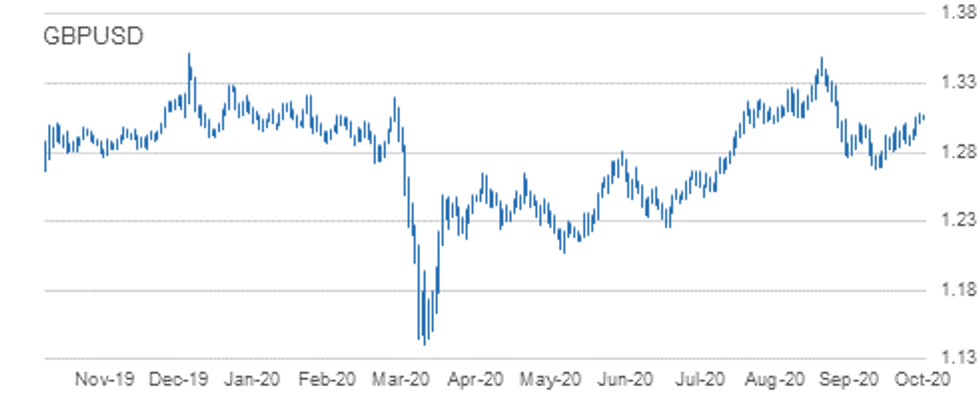
GBPUSD traded firmer Monday. Price remains below the Oct 12 high of 1.3083 though. A break of this level is needed to resume the recent uptrend that would open 1.3000 and 1.3186. The latter is the former trendline support drawn off the Mar 20 low. The trendline was breached on Sep 9. A break of 1.3186 is required to strengthen a bullish theme. Firm near-term support lies at 1.2846. A breach would instead signal scope for a deeper pullback.
EURGBP: Support Still Exposed
- RES 4: 0.9190 61.8% retracement of the Sep 11 - 28 sell-off
- RES 3: 0.9162 High Oct 7 and the bull trigger
- RES 2: 0.9132 High Oct 10
- RES 1: 0.9122 Oct 14 high
- PRICE: 0.9075 @ 17:43 BST Oct 19
- SUP 1: 0.9007 Low Oct 14
- SUP 2: 0.9000 Round number support
- SUP 3: 0.8967 76.4% retracement of the Sep 3 - 11 rally
- SUP 4: 0.8808 Low May 13
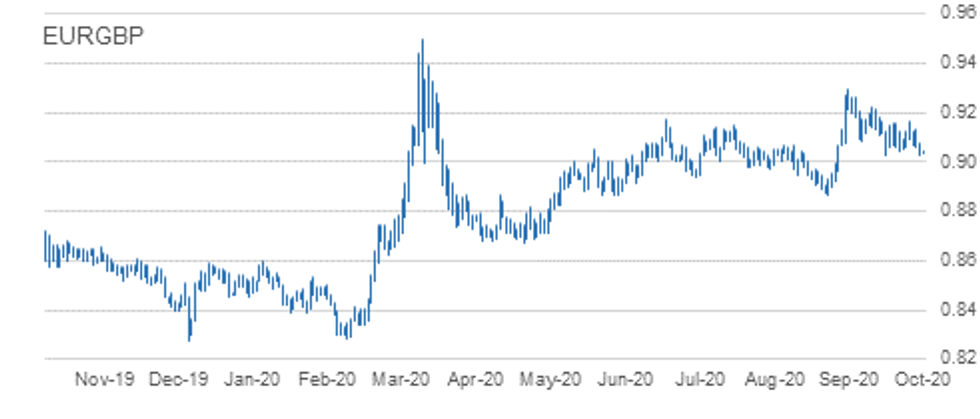
EURGBP maintains a bearish outlook and finished flat Monday. The move lower on Oct 14 followed another failed attempt to convincingly clear trendline resistance drawn off the Sep 11 high. Weakness that day also confirmed a resumption of the current downtrend setting the scene for a move to 0.9000 and below towards 0.8967, a retracement level. Resistance is at 0.9122, the Oct 14 high.
USDJPY: Focus Is On The Key Near-Term Support
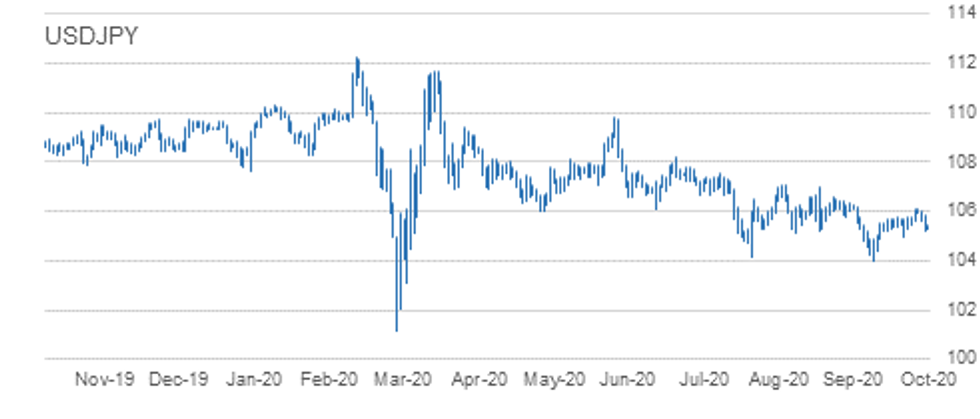
- RES 4: 106.95 High Sep 28
- RES 3: 106.48 Channel resistance drawn off Mar 24 high
- RES 2: 106.11/38 High Oct 7 and the bull trigger / High Sep 8
- RES 1: 105.63 High Oct 13
- PRICE: 105.42 @ 17:44 BST Oct 19
- SUP 1: 105.04 Low Oct 14
- SUP 2: 104.94 Low Oct 2 and key near-term support
- SUP 3: 104.41 Low Sep 22
- SUP 4: 104.00 Low Sep 21 and the bear trigger
USDJPY continues to display a softer tone. Intraday momentum studies still point south however to strengthen a bearish theme, price needs to trade below 104.94, Oct 2 low. This would open 104.00, Sep 21 low. While 104.94 remains intact, the recent sell-off is considered a correction. The bull trigger is at 106.11, Oct 7 high where a break would resume bullish pressure. Initial resistance is at 105.63.
EURJPY: Rallies, With Support Intact
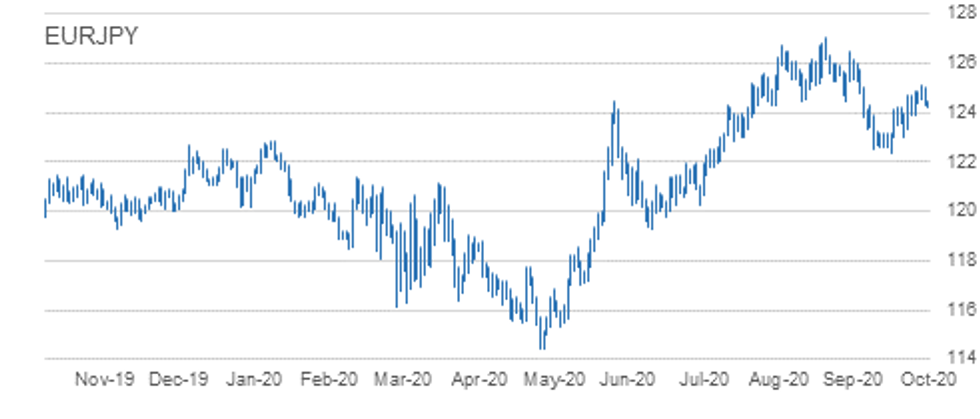
- RES 4: 125.97 76.4% retracement of the Sep 1 - 28 sell-off
- RES 3: 125.77 High Sep 15
- RES 2: 125.09/28 High Oct 9 / 61.8% of the Sep 1 - 28 sell-off
- RES 1: 124.48 High Oct 13
- PRICE: 124.23 @ 17:45 BST Oct 19
- SUP 1: 123.03/02 Low Sep 29 and Oct 2 / Low Oct 15
- SUP 2: 122.38/28 Low Sep 28 / 61.8% of the Jun 22 - Sep 1 rally
- SUP 3: 122.25 38.2% retracement of the May - Sep rally
- SUP 4: 121.82 Low Jul 15 and 16
EURJPY has started the week on a firm note with the cross pulling away from support at 123.03/02, low prints between Sep 29 and Oct 15. Stronger gains through the 124.00 handle would signal potential for an extension higher towards 125.09, Oct 9 high and the bull trigger. A break of 125.09 would open 125.28 and 125.97, both retracement levels. On the downside, a 123.03/02 breach is needed to trigger bearish pressure and open 122.38, Sep 28 low.
AUDUSD: Trendline Resistance Intact
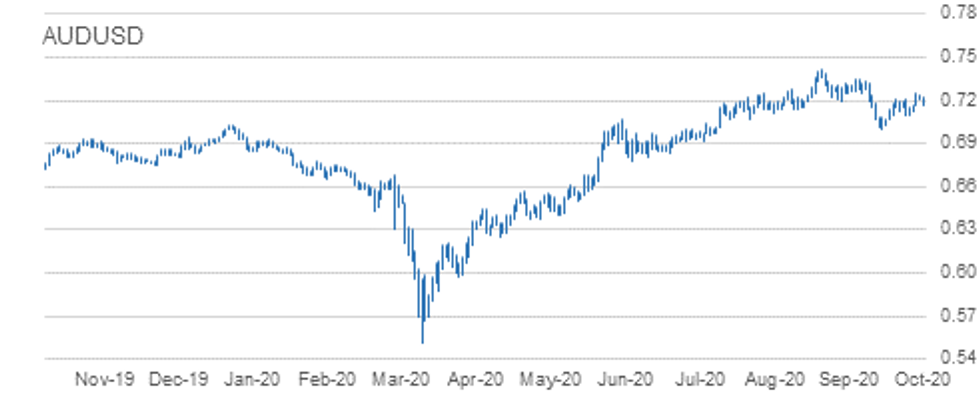
- RES 4: 0.7258 61.8% retracement September Sell-Off
- RES 3: 0.7243 High Oct 10 and the intraday bull trigger
- RES 2: 0.7201 Trendline resistance drawn off the Sep 1 high
- RES 1: 0.7170 High Oct 15
- PRICE: 0.7087 @ 17:46 BST Oct 19
- SUP 1: 0.7056 Low Oct 15
- SUP 2: 0.7029 Low Sep 28
- SUP 3: 0.7006 Low Sep 25 and the bear trigger
- SUP 4: 0.6965 23.6% retracement of the Mar - Sep rally
AUDUSD remains vulnerable. On Oct 9, the pair cleared resistance at 0.7209, Oct 1 and 6 high resulting in a test of trendline resistance drawn off the Sep 1 high. The line intersects at 0.7201 Monday. A failure at the trendline is weighing on the Aussie and, with support at 0.7096, Oct 7 breached, the scene is set for a deeper pullback. Attention is on the primary support and bear trigger at 0.7006, Sep 25 low. A trendline break would alter the picture.
USDCAD: Needle Still Pointing North Despite Pullback
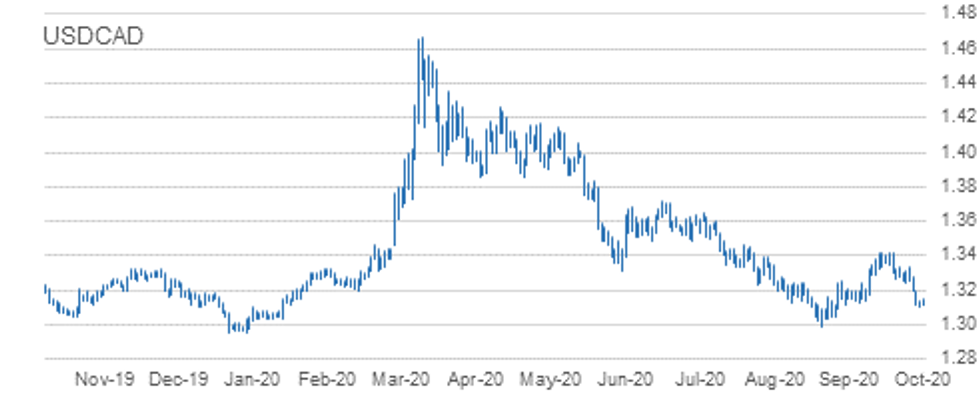
- RES 4: 1.3421 High Sep 30 and primary resistance
- RES 3: 1.3341 High Oct 7 and a reversal trigger
- RES 2: 1.3263/68 50-day EMA / High Oct 7
- RES 1: 1.3259 High Oct 15
- PRICE: 1.3158 @ 17:47 BST Oct 19
- SUP 1: 1.3143 Low Oct 15
- SUP 2: 1.3099 Low Oct 13 and the bear trigger
- SUP 3: 1.3095 76.4% retracement of the Sep 1 - 30 rally
- SUP 4: 1.3038 Low Sep 2
The USDCAD short-term outlook is bullish with recent gains signalling scope for a stronger corrective bounce. The pair breached the 20-day EMA last week paving the way for move towards the 50-day EMA that intersects at 1.3263. A clear breach of the 50 EMA would strengthen a bullish case. On the downside, initial support lies at 1.3143, Thursday's intraday low. A move through this level would however undermine the recent recovery.
EUR/USD: MNI KEY LEVELS
*$1.1995 Upper 2.0% 10-dma envelope
*$1.1966 Aug18 high
*$1.1917/29 Sep10 high/Sep02 high
*$1.1900 Sep15 high
*$1.1882/83 Sep16 high/Upper Boll Band (3%)
*$1.1872/77 Cloud top, Sep21 high/Upper 1.0% 10-dma env
*$1.1857 100-mma
*$1.1833 Upper Bollinger Band (2%)
*$1.1817/27/31 Oct13 high/Oct12 high/Oct09 high
*$1.1794/95/97 Intraday high/50-dma/55-dma
*$1.1785 ***CURRENT MARKET PRICE 17:57BST MONDAY***
*$1.1771/60/58 Oct14 high/200-hma/Oct15 high
*$1.1746/36/34 Oct16 high/38.2% 1.3993-1.0341/21-dma
*$1.1732 100-hma
*$1.1703/94/89 Intraday low/Oct16 low/Oct15 low
*$1.1685 Sep30 low, Sep25 high
*$1.1661 Sep29 low
*$1.1642/32 Lower 1.0% 10-dma env/Lower Boll Band (2%)
*$1.1615/12/10 Cloud base/Sep25 low/100-dma
*$1.1581 Jul24 low, Lower Boll Band (3%)
*$1.1541 Jul23 low
GBP/USD: MNI KEY LEVELS
*$1.3280 Sep07 high
*$1.3219 Upper 2.0% 10-dma envelope
*$1.3197 Upper Bollinger Band (3%)
*$1.3173 Sep08 high
*$1.3123 Cloud top
*$1.3098 Upper Bollinger Band (2%)
*$1.3083/89 Oct12 high/Upper 1.0% 10-dma env
*$1.3064/72 Oct14 high/Oct13 high
*$1.3022/25/30 55-dma/Intraday high/Oct15 high
*$1.3007/15 Oct06 high, Sep16 high/50-dma
*$1.2986 ***CURRENT MARKET PRICE 17:57BST MONDAY***
*$1.2970/62/60 200-hma/Oct16 high/Cloud base
*$1.2951/49/43 50-mma/100-hma/200-wma
*$1.2895/91 21-dma/Intraday low
*$1.2865/63 Oct16 low/Oct14 low
*$1.2846/41/38 Oct07 low/100-dma/Oct02 low
*$1.2830/20 Lower 1.0% 10-dma env/Oct01 low
*$1.2806 Sep30 low
*$1.2781 Sep24 high
*$1.2763/52 Sep11 low/100-wma
*$1.2745 Sep28 low
EUR/GBP: MNI KEY LEVELS
*Gbp0.9326 Mar24 high
*Gbp0.9292 Sep11 high
*Gbp0.9256 Upper 2.0% 10-dma envelope
*Gbp0.9220/23 Sep22 high/Upper Boll Band (3%)
*Gbp0.9181 Upper Boll Band (2%), Sep24 high
*Gbp0.9165 Upper 1.0% 10-dma envelope
*Gbp0.9156/57/62 Oct01 high/Sep30 high/Oct07 high
*Gbp0.9122/23/32 Oct14 high/Oct08 high/Oct09 high
*Gbp0.9100/10 21-dma/Oct16 high
*Gbp0.9079/91 Cloud base, Cloud top/Intraday high
*Gbp0.9074 ***CURRENT MARKET PRICE 17:57BST MONDAY***
*Gbp0.9068/63/60 200-hma/50-dma/55-dma
*Gbp0.9059 100-hma
*Gbp0.9044/41 Oct16 low/100-dma
*Gbp0.9022/17/12 Intraday low/Oct15 low/Lower Boll Band (2%)
*Gbp0.9007 Oct14 low
*Gbp0.8984/70 Lower 1.0% 10-dma env/Lower Boll Band (3%)
*Gbp0.8967 Sep08 low
*Gbp0.8925 Sep07 low
*Gbp0.8900/93 Sep04 low/Lower 2.0% 10-dma env
*Gbp0.8880/66 200-dma/Sep03 low
USD/JPY: MNI KEY LEVELS
*Y106.07 Cloud top
*Y106.04 Oct09 high
*Y106.00 Upper Bollinger Band (2%)
*Y105.99 Cloud base
*Y105.85 Oct12 high
*Y105.75 50-dma, 55-dma
*Y105.63 Oct13 high
*Y105.58 Cloud Tenkan Sen
*Y105.53 200-hma
*Y105.46/50/52 21-dma/Intraday high/Oct14 high
*Y105.42 ***CURRENT MARKET PRICE 17:57BST MONDAY***
*Y105.34/30 100-hma/Intraday low
*Y105.19 Oct16 low
*Y105.09 Oct15 low, Cloud Kijun Sen
*Y105.04 Oct14 low
*Y105.00 Lower Bollinger Band (2%)
*Y104.94 Oct02 low
*Y104.88 Sep23 low
*Y104.75 Lower Bollinger Band (3%)
*Y104.50 Lower 1.0% 10-dma envelope
*Y104.41 Sep22 low
EUR/JPY: MNI KEY LEVELS
*Y125.29 Sep10 low
*Y125.21 200-wma
*Y125.10 Upper Bollinger Band (2%)
*Y125.09 Oct09 high
*Y125.03 Oct12 high
*Y124.93 Fibo 38.2% 149.78-109.57
*Y124.80 50-mma
*Y124.75 55-dma
*Y124.74 50-dma
*Y124.34/48 Intraday high/Oct13 high
*Y124.23 ***CURRENT MARKET PRICE 17:57BST MONDAY***
*Y124.18/10/06 Cloud Kijun Sen/200-hma/Cloud Tenkan Sen
*Y123.94 Oct14 high
*Y123.77 Oct15 high
*Y123.75 21-dma
*Y123.71 Oct16 high
*Y123.68 Cloud base
*Y123.58 100-hma
*Y123.48 100-dma
*Y123.37 Intraday low
*Y123.12 Oct16 low
AUD/USD: MNI KEY LEVELS
*$0.7282/87 Cloud top/Upper 2.0% 10-dma env
*$0.7262 50-mma
*$0.7246/54 Upper Boll Band (2%)/Sep17 low
*$0.7235/43/44 Sep22 high, Oct12 high/Oct09 high/200-wma
*$0.7216/18 Upper 1.0% 10-dma env/Oct13 high
*$0.7191/01/03 Oct14 high/55-dma/50-dma
*$0.7158/70 Cloud base/Oct15 high
*$0.7137/51 21-dma/200-hma
*$0.7115/23 Intraday high/Oct08 low
*$0.7100/14 100-dma/100-hma
*$0.7088 ***CURRENT MARKET PRICE 17:57BST MONDAY***
*$0.7073/72 Lower 1.0% 10-dma env/Intraday low
*$0.7071/56 Oct16 low/Oct15 low
*$0.7029/20 Sep28 low/Lower Boll Band (2%)
*$0.7006/01 Sep25 low/Lower 2.0% 10-dma env
*$0.6973/63 Jul20 low/Jul16 low, Lower Boll Band (3%)
*$0.6930/21 Lower 3.0% 10-dma env/Jul14 low
*$0.6897 100-wma
*$0.6877 Jul01 low
*$0.6833 Jun30 low
*$0.6805/90 Jun22 low/200-dma
USD/CAD: MNI KEY LEVELS
*C$1.3341 Oct07 high
*C$1.3317/20 Upper 1.0% 10-dma env/Cloud top
*C$1.3273 Oct08 high
*C$1.3259/63 Oct15 high/21-dma
*C$1.3238 Oct16 high
*C$1.3219 55-dma
*C$1.3208 50-dma
*C$1.3196 Intraday high
*C$1.3173/75/77 200-hma/50-mma/100-hma
*C$1.3161/62 200-wma/Cloud base
*C$1.3156 ***CURRENT MARKET PRICE 17:57BST MONDAY***
*C$1.3151/43 Intraday low/Oct15 low
*C$1.3117 Oct14 low
*C$1.3099 Oct13 low
*C$1.3087 Sep08 low
*C$1.3071 Lower Bollinger Band (2%)
*C$1.3053 Lower 1.0% 10-dma envelope
*C$1.3038 Sep02 low
*C$1.2994 YTD low
*C$1.2976 Jan08 low, Lower Boll Band (3%)
*C$1.2952 Dec31-2019 low
Why MNI
MNI is the leading provider
of intelligence and analysis on the Global Fixed Income, Foreign Exchange and Energy markets. We use an innovative combination of real-time analysis, deep fundamental research and journalism to provide unique and actionable insights for traders and investors. Our "All signal, no noise" approach drives an intelligence service that is succinct and timely, which is highly regarded by our time constrained client base.Our Head Office is in London with offices in Chicago, Washington and Beijing, as well as an on the ground presence in other major financial centres across the world.