
Why MNI
MNI is the leading provider
of intelligence and analysis on the Global Fixed Income, Foreign Exchange and Energy markets. We use an innovative combination of real-time analysis, deep fundamental research and journalism to provide unique and actionable insights for traders and investors. Our "All signal, no noise" approach drives an intelligence service that is succinct and timely, which is highly regarded by our time constrained client base.Our Head Office is in London with offices in Chicago, Washington and Beijing, as well as an on the ground presence in other major financial centres across the world.
HIGHLIGHTS
- ECB VISCO: NO NEED TO ERR ON SIDE OF TIGHTENING AT THE MOMENT .. POLICY NORMALISATION MUST CONTINUE AT GRADUAL PACE .. NO SIGN OF PRICE-SALARY SPIRAL IN EURO AREA, Bbg
- ECB'S LAGARDE: RATES STILL HAVE TO RISE SIGNIFICANTLY .. WE MUST BRING INFLATION DOWN .. VITAL HIGH INFLATION DOESN'T BECOME ENTRENCHED, Bbg
US TSYS: Late Market Roundup
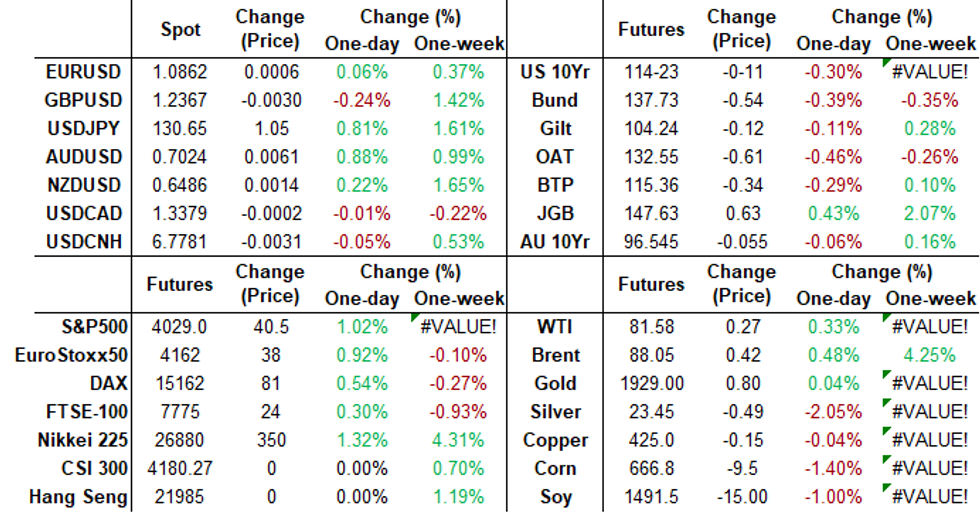
Tsys weaker after the bell, Bonds off early session lows (30YY +.0400 at 3.6947% vs. 3.7148% high) w/ curves running mixed after bear steepening earlier (2s10s -1.950 at -71.523 vs. -67.092 high).
- Trade volumes remain subdued (TYH3 <950k) w/ much of Asia out for Lunar New Year holidays this week (China, Taiwan Mon-Fri; Vietnam Mon-Thu; Hong Kong Mon-Wed; Singapore and South Korea Mon-Tue).
- No react to midmorning data: US December Leading Indicator -1.0% MoM vs. -0.7% est, while absence of Fed speak w/ members in media blackout through Feb 2, has sapped market interest somewhat.
- Equities remain strong, however, off highs amid modest profit taking in late trade Monday. Information Technology and Communication Services sectors continued to outperform.
- Pick-up in data Tue w/ Philly-Fed Non Mfg Activity (-12.8 rev, --), Richmond Fed Mfg Index (1, -5); Bizz Cond (-14, --) and S&P Global US Manufacturing PMI (46.2, 46.0), Services PMI (44.7, 45.0); Comp PMI (45, 47.0) expected.
- Treasury auctions: $34B 52W bill CMB auction at 1130ET, $42B 2Y Note auction (91282CGG0) at 1300ET.
SHORT TERM RATES
US DOLLAR LIBOR: Latest settlements:
- O/N -0.00057 to 4.30457% (-0.000857 total last wk)
- 1M -0.00728 to 4.50586% (+0.05871 total last wk)
- 3M +0.00214 to 4.81771% (+0.02314 total last wk)*/**
- 6M -0.00357 to 5.09843% (+0.00086 total last wk)
- 12M -0.00500 to 5.34229% (-0.00971 total last wk)
- * Record Low 0.11413% on 9/12/21; ** New 14Y high: 4.82971% on 1/12/23
- Daily Effective Fed Funds Rate: 4.33% volume: $99B
- Daily Overnight Bank Funding Rate: 4.32% volume: $276B
- Secured Overnight Financing Rate (SOFR): 4.30%, $1.169T
- Broad General Collateral Rate (BGCR): 4.26%, $462B
- Tri-Party General Collateral Rate (TGCR): 4.26%, $435B
- (rate, volume levels reflect prior session)
FED Reverse Repo Operation
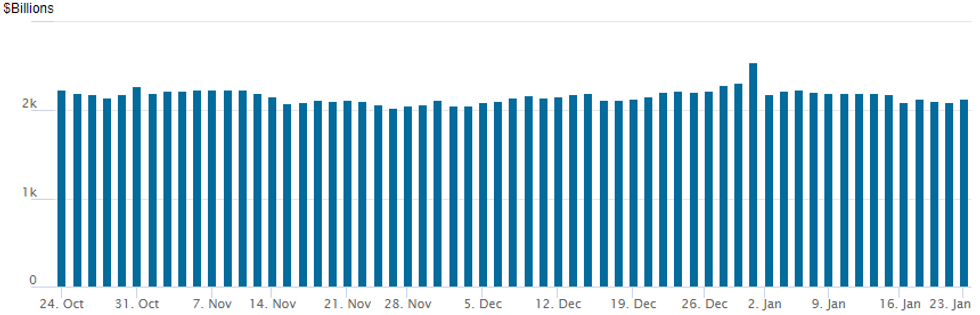
NY Federal Reserve/MNI
NY Fed reverse repo usage climbs to $2,135.499B w/ 105 counterparties vs. prior session's $2.090.523B. Compares to Friday, Dec 30 record/year-end high of $2,553.716B (prior record high was $2,425.910B on Friday, September 30.
EURODOLLAR/SOFR/TREASURY OPTIONS SUMMARY
Consistent low-delta put trade in SOFR options carried over from overnight while Tsy options saw better 10Y call fly trade on lighter volumes. Gist of short-end trade: while pivot to 25 bps hike at the Feb 1 FOMC largely expected, Fed speakers before Fri's blackout expressed likelihood of continued hikes out the curve.- SOFR Options:
- Block, Total 20,000 SFRU3 94.87/95.25/95.50 broken put trees, 9.25 net/splits
- Block, total 72,000 OQM3 95.50 puts, 0.5 ref 96.61
- Block, +10,000 SFRM3 94.62/94.75 put spds, 1.0 ref 95.105
- +3,000 SFRU3 94.87/95.12/ 2x1 put spds, 1.5 ref 95.26
- Block, total 10,000 OQJ3 96.00 puts, 7.5 ref 96.635 -.64
- Update, total +2000 OQM3 95.00/95.50/96.00 2x3x1 put flys, 2.5 ref 96.63
- 2,750 OQH3 95.87/96.12 2x1 put spds ref 96.18
- Block, total 8,000 OQZ3 95.75/96.25 put spds 9.0 ref 97.115
- 2,500 SFRH3 95.25/95.31 call spds, ref 95.16
- 3,000 OQH3 95.75/95.93 3x2 put spds, ref 96.19
- 3,500 OQJ3 95.00/95.50/96.00 put flys ref 96.68
- 6,000 SFRM3 95.37 calls, 4.75-4.5 ref 95.115
- Block/screen, 11,500 OQK3 95.00/95.50/96.00 put flys, 4.5 ref 96.70 -.685
- Block, 2,500 OQH3 94.5 puts, cab ref 96.195
- 6,000 SFRM3 95.18/95.31 put spds ref 95.115
- Treasury Options:
- -20,000 TYG3114.25/115.25/116.25 call flys, 24-19 ref 114-23.5
- 2,000 TYH3 119/120 call spdsref 114-26
- 14,000 FVH3 109.25/109.5 put spds, 7.5 ref 109-14.5
- 2,000 TUH3 103/103.5 call spds, ref 102-31.75
- 1,200 TYG3 114.75/115/115.25 call flys, ref 115-02
- 1,000 TYH3 116/117.5/119 call flys, ref 115-03
- 1,000 TYH3 114.5/115.25/116 call flys ref 115-06.5
EGBs-GILTS CASH CLOSE: ECB Hawks Continue To Move The Needle
European curves steepened Monday with Bunds underperforming Gilts.
- With a fairly thin data slate (EC consumer confidence was a little worse than expected but not a market mover), and Asian holidays muting overnight price action, ECB speakers took centre stage as the day proceeded.
- On the hawkish end of the commentary were Kazimir and Vujcic who continued to signal support for 50bp hikes, whereas Stournaras and Visco proposed a more measured approach.
- Pricing for cumulative further ECB hikes rose by nearly 4bp at one point to just under 147bp to Jul 2023, joint-highest since Jan 11.
- The German curve bear steepened, with the UK's bull steepening.
- ECB's Lagarde speaks after the cash close Monday. Attention swiftly turns to flash PMI data on Tuesday morning.
Closing Yields / 10-Yr Periphery EGB Spreads To Germany
- Germany: The 2-Yr yield is up 2.1bps at 2.598%, 5-Yr is up 3.1bps at 2.241%, 10-Yr is up 2.9bps at 2.206%, and 30-Yr is up 3.2bps at 2.173%.
- UK: The 2-Yr yield is down 2.5bps at 3.465%, 5-Yr is down 2.7bps at 3.269%, 10-Yr is down 1.8bps at 3.36%, and 30-Yr is down 0.9bps at 3.712%.
- Italian BTP spread up 0.7bps at 182.3bps / Spanish up 1bps at 96.8bps
EGB Options: Mostly Downside Monday
Monday's Europe rates / bond options flow included:
- OEH3 117.50/116.50ps vs 118.50c, bought the ps for -10 (receive) in 5k
- RXH3 136.00/134.00ps vs RXH3 140.50/142.5cs, sold the cs at flat in 5k
- RXH3 142.50/144.50/145.00c ladder, bought for 9 in 3.5k
- ERH3 96.87/97.37cs, sold at 16.25 in 2.5k
- ERU3 96.50/96.37/96.25p fly bought for 1 in 1.5k
- 0RJ3 97.00^, bought for 43.5 in 2k
- SFIH3 95.40/95.60cs, bought for 18 in 2k
FOREX: AUDJPY Matches Post-BOJ Highs, Greenback Consolidating
- The Japanese Yen remains the poorest performing currency across G10, although price action largely subsided around Friday’s best trading levels for USD/JPY around 130.60. The pair remains below last week’s high of 131.58 and the 20-day EMA, at 131.01 has capped the price action on Monday.
- Recent activity appears to be a bear flag formation - if correct it reinforces the downtrend and signals scope for a continuation of the trend. A break lower would open 126.81, a Fibonacci projection - the bear trigger is 127.23, the Jan 16 low. On the upside, clearance of 131.58, the Jan 18 high, would be bullish and signal scope for a stronger correction.
- At the other end, AUD is outperforming amid a more positive tone for equity markets with the main indices firming just under one percent. AUDJPY has risen an impressive 1.65%, and now focuses in on the post BOJ highs and horizontal resistance just below the 92.00 mark.
- By a small margin, Scandi currencies are also outperforming, putting both SEK and NOK behind the Aussie on the G10 leaderboard, however, macro drivers are few and far between ahead of the APAC crossover.
- The Chinese Lunar New Year and the beginning of the Fed's pre-rate decision media blackout period have made for a relatively quiet start to the week for the greenback with the USD index trading in marginally positive territory.
- European and US flash PMIs kick off Tuesday’s docket before the main event’s this week of Wednesday’s Bank of Canada rate decision and the advanced reading of US GDP, due Thursday.
Expiries for Jan24 NY cut 1000ET (Source DTCC)
- EUR/USD: $1.0795-05(E928mln), $1.0900(E561mln)
- USD/JPY: Y128.00-10($924mln), Y130.00($916mln), Y131.00($821mln)
- AUD/USD: $0.7000(A$524mln)
- USD/CAD: C$1.3400($726mln), C$1.3460($610mln)
Late Equity Roundup: Materials, Energy, Pharma Sales
Major indexes still bid but off the best levels since mid-December amid modest profit taking in late trade Monday. Information Technology and Communication Services sectors continued to outperform. SPX eminis currently trades +35.75 s (0.9%) at 4024.25; DJIA +162.56 (0.49%) at 33540.1; Nasdaq +172.7 (1.6%) at 11313.61.
- SPX leading/lagging sectors: Information Technology (+1.83%) sector extends gains, lead by semiconductor makers (AMD +7.85%, MPWR +7.20%, QCOM +6.05%, Nvidia +6.61%). Communication Services (+1.13%) underpinned by interactive media and entertainment names: Netflix (NFLX) up another +5.11% after reporting huge subscriber addition in 4th quarter last wk (+7.66 million vs. 4.57 million est), Dish +3.85%, Paramount +3.84%.
- Laggers: Materials (-0.29%), Energy (-0.21%) and Utilities (-0.13%) sectors underperformed, metals and mining names weighing on the former: Freeport McMoran (FCX) -2.27%, NuCor (NUE) -0.75%, Newmont Mining (NEM) -0.41%, O&G equipment and servicers weighing on Energy (SLB -2.37%, BKR -1.61%.
- Dow Industrials Leaders/Laggers: Salesforce (CRM) +4.68 at 155.93, Apple (AAPL) +3.29 at 141.16, Goldman Sachs (GS) +3.14 at 344.98. Laggers: Amgen -2.44 at 260.80, PG -2.07 at 140.9, Home Depot (HD) -0.87 at 485.85.
E-MINI S&P (H3): North of Last Week’s Highs
- RES 4: 4194.25 High Sep 13
- RES 3: 4180.00 High Dec 13 and the bull trigger
- RES 2: 4090.75 High Dec 14
- RES 1: 4051.00 High Jan 23
- PRICE: 4043.25 @ 16:55 GMT Jan 23
- SUP 1: 3901.75/3891.50 Low Jan 19 / Low Jan 10
- SUP 2: 3788.50/78.45 Low Dec 22 / 61.8% of Oct 13-Dec 13 uptrend
- SUP 3: 3735.00 Low Nov 3
- SUP 4: 3670.00 76.4% retracement of the Oct 13 - Dec 13 uptrend
S&P E-Minis have found support at 3901.75, the Jan 19 low and recovered solidly. The short-term bearish threat remains present, but for now markets continue to press high in a possible corrective recovery. A close above the 4035.25 level would work against the bearish threat, and open gains toward 4090.75 - last seen in mid-December. To the downside, price has traded through support at the 50-day EMA. The average intersects at 3933.04 and a clear break would highlight a potential bearish reversal and expose 3891.50, the Jan 10 low.
COMMODITIES: Brent Outperforms WTI, Clears Key Short-Term Resistance
- Crude oil prices have reversed course in the second half of the session, unwinding earlier gains and notably so for WTI, helped pushed lower by equities also rolling over.
- Brent has been supported by the potential impact of lower Russian output, with the Brent premium increasing from around 6$/bbl to 6.5$/bbl today.
- Goldman see WTI averaging $92/bbl in 2023 whilst sticking with the US, Energy Sec. Granholm says the US will be able to replenish its SPR at savings to taxpayers.
- WTI is -0.1% at $81.59 having earlier tested the $82.66 (Jan 18 high) needed to be cleared to reinstate the recent bullish theme and expose $83.14 (Dec 1 high).
- Brent is +0.5% at $88.08, off a high of $89.09 that easily cleared the key short-term resistance of $87.85 and came close to $89.18 (Dec 1high).
- Gold is +0.1% at $1927.73, off an overnight high of $1935.58 that came close to Friday’s high of $1937.6 that continues to form initial resistance.
Tuesday Data Calendar
| Date | GMT/Local | Impact | Flag | Country | Event |
| 24/01/2023 | 0030/0930 | ** |  | JP | Jibun Bank Flash Japan PMI |
| 24/01/2023 | 0700/0800 | * |  | DE | GFK Consumer Climate |
| 24/01/2023 | 0700/0700 | *** |  | UK | Public Sector Finances |
| 24/01/2023 | 0745/0845 | ** |  | FR | Manufacturing Sentiment |
| 24/01/2023 | 0815/0915 | ** | | FR | S&P Global Services PMI (p) |
| 24/01/2023 | 0815/0915 | ** | | FR | S&P Global Manufacturing PMI (p) |
| 24/01/2023 | 0830/0930 | ** | | DE | S&P Global Services PMI (p) |
| 24/01/2023 | 0830/0930 | ** | | DE | S&P Global Manufacturing PMI (p) |
| 24/01/2023 | 0900/1000 | ** |  | EU | S&P Global Services PMI (p) |
| 24/01/2023 | 0900/1000 | ** | | EU | S&P Global Manufacturing PMI (p) |
| 24/01/2023 | 0900/1000 | ** | | EU | S&P Global Composite PMI (p) |
| 24/01/2023 | 0930/0930 | *** | | UK | S&P Global Manufacturing PMI flash |
| 24/01/2023 | 0930/0930 | *** | | UK | S&P Global Services PMI flash |
| 24/01/2023 | 0930/0930 | *** | | UK | S&P Global Composite PMI flash |
| 24/01/2023 | 0945/1045 | | EU | ECB Lagarde Video Message at Croatia Conference | |
| 24/01/2023 | 1100/1100 | ** | | UK | CBI Industrial Trends |
| 24/01/2023 | 1330/0830 | ** |  | US | Philadelphia Fed Nonmanufacturing Index |
| 24/01/2023 | 1355/0855 | ** | | US | Redbook Retail Sales Index |
| 24/01/2023 | 1445/0945 | *** | | US | IHS Markit Manufacturing Index (flash) |
| 24/01/2023 | 1445/0945 | *** | | US | S&P Global Services Index (flash) |
| 24/01/2023 | 1500/1000 | ** | | US | Richmond Fed Survey |
| 24/01/2023 | 1630/1130 | ** | | US | US Treasury Auction Result for 52 Week Bill |
| 24/01/2023 | 1800/1300 | * | | US | US Treasury Auction Result for 2 Year Note |
| 25/01/2023 | 2145/1045 | *** |  | NZ | CPI inflation quarterly |
Why MNI
MNI is the leading provider
of intelligence and analysis on the Global Fixed Income, Foreign Exchange and Energy markets. We use an innovative combination of real-time analysis, deep fundamental research and journalism to provide unique and actionable insights for traders and investors. Our "All signal, no noise" approach drives an intelligence service that is succinct and timely, which is highly regarded by our time constrained client base.Our Head Office is in London with offices in Chicago, Washington and Beijing, as well as an on the ground presence in other major financial centres across the world.