
Why MNI
MNI is the leading provider
of intelligence and analysis on the Global Fixed Income, Foreign Exchange and Energy markets. We use an innovative combination of real-time analysis, deep fundamental research and journalism to provide unique and actionable insights for traders and investors. Our "All signal, no noise" approach drives an intelligence service that is succinct and timely, which is highly regarded by our time constrained client base.Our Head Office is in London with offices in Chicago, Washington and Beijing, as well as an on the ground presence in other major financial centres across the world.
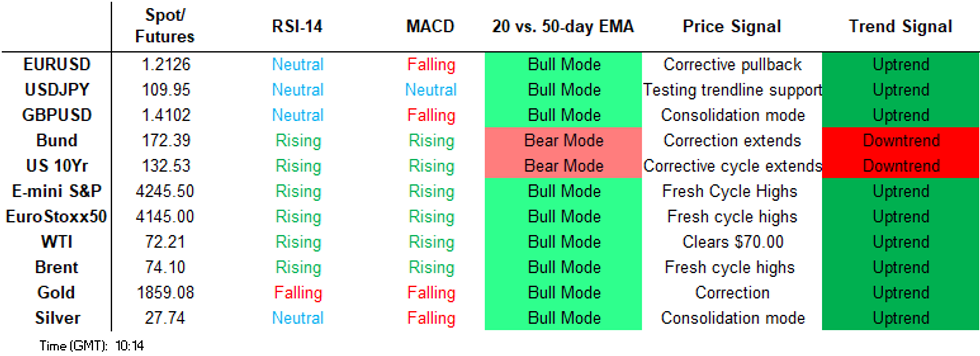
Price Signal Summary - EURUSD Appears Vulnerable
- In the equity space, sentiment remains bullish and the E-mini S&P (U1) continues to grind higher, confirming again that the path of least resistance remains up. The focus is on 4264.41, a Fibonacci projection. Further out, the recent break higher also exposes 4300.00. Initial firm support is at 4155.00, Jun 3 low.
- In the FX space, EURUSD still appears vulnerable following Friday's move lower that saw the pair breach the 50-day EMA and probe the 1.2104 Jun 4 low. These levels represent a key short-term support and a clear break would signal scope for a deeper sell-off. This would open 1.2052, May 13 low. GBPUSD attention remains on the key support at 1.4006, May 13 low. The 50-day EMA is just above at 1.4039 and also represents a key support. The outlook is bullish while these levels hold. A break of 1.4006 though would suggest scope for a deeper pullback. Recent USDJPY remains above support at 109.19, Jun 7 low. Gains Monday and yesterday have exposed resistance and the near-term bull trigger at 110.33, Jun 4 high.
- On the commodity front, Gold on Monday probed support at $1856.2, Jun 4 low. A deeper sell-off would open $1843.2, the 50-day EMA. Trend conditions in oil remain bullish and price continues to trend higher. Brent (Q1) focus is on $75.60, Apr 25 high 2019 (cont). WTI (N1) registers another high print. The focus is on $73.20, 3.236 projection of Mar 23 - 30 - Apr 5 price swing.
- Within FI, Bunds (U1) maintain a bullish tone and the recent pullback is considered corrective. The focus is on 173.32 next, 76.4% of the Mar 25 - May 19 sell-off. Support is at 171.93, 20-day EMA. Gilts (U1) cleared 127.74/82 last week, the highs between Apr 20 and May 26. This opens 128.50, 1.00 projection of the May 13 - 26 - Jun 3 price swing. Support is at 127.34, Jun 10 low.
FOREIGN EXCHANGE
EURUSD TECHS: Bear Flag
- RES 4: 1.2414 High Apr 17, 2018
- RES 3: 1.2349/53 High Jan 6 / High Apr 20, 2018
- RES 2: 1.2266/85 High May 25 and the bull trigger / High Jan 8
- RES 1: 1.2218 High Jun 9
- PRICE: 1.2128 @ 05:55 BST Jun 16
- SUP 1: 1.2093 Low Jun 11
- SUP 2: 1.2052/42 Low May 13 / 100-dma
- SUP 3: 1.1986 Low May 5
- SUP 4: 1.1919 61.8% retracement of the Mar 31 - May 25 rally
EURUSD is trading closer to recent lows and this week's consolidation appears to be a bear flag. The recent breach of the 50-day EMA and 1.2104, Jun 4 low signals scope for a deeper short-term correction and an extension would expose the next firm support at 1.2052, May 13 low with the 100-dma at 1.2042. On the upside, initial firm resistance is at 1.2218, Jun 9 high. A break would ease the bearish threat and open 1.2266 instead.
GBPUSD TECHS: Testing The 50-Day EMA
- RES 4: 1.4420 2.0% 10-dma envelope
- RES 3: 1.4377 High Apr 17, 2018 and a key resistance
- RES 2: 1.4315 High Apr 18, 2018
- RES 1: 1.4203/48 High Jun 3 / High Jun 1 and the bull trigger
- PRICE: 1.4086 @ 06:04 BST Jun 16
- SUP 1: 1.4041 50-day EMA
- SUP 2: 1.4034/06 Low Jun 15 / May 13 and key support
- SUP 3: 1.3972 Low May 10
- SUP 4: 1.3858 Low May 6
GBPUSD conditions deteriorated Tuesday, with prices testing the 50-day EMA at 1.4041. A clear break of the EMA would expose the May 13 low of 1.4006. From a trend perspective, the outlook is bullish. The probe on Jun 1 of 1.4237, Feb 24 high reinforced a bullish theme however a clear break is required to confirm a resumption of the trend. This would open 1.4315, April 18 2018 high. Weakness below 1.4006 would signal a S/T reversal instead.
EURGBP TECHS: Consolidation Mode
- RES 4: 0.8772 2.0% 10-dma envelope and high Feb 12
- RES 3: 0.8731 High Feb 26
- RES 2: 0.8701/21 High May 7 / High Apr 26 and the bull Trigger
- RES 1: 0.8646/72 High Jun 1 / High May 25
- PRICE: 0.8609 @ 06:08 BST Jun 16
- SUP 1: 0.8565/61 Low Jun 4 / Low May 12
- SUP 2: 0.8531 76.4% retracement of the Apr 5 - 26 rally
- SUP 3: 0.8472 Low Apr 5 and the bear trigger
- SUP 4: 0.8428 2.0% 10-dma envelope
EURGBP conditions are unchanged and the cross continues to consolidate and remains in a range. From a trend perspective, the outlook is bearish. Initial firm resistance is unchanged at 0.8672, May 25 high and while this holds, attention is on 0.8561, May 12 low. A break would strengthen a bearish case and expose 0.8531, a Fibonacci retracement ahead of key support at 0.8472, Apr 5 low. For bulls, a break of 0.8672 alters the picture.
USDJPY TECHS: Holding Onto Gains
- RES 4: 111.30 High Mar 26, 2020
- RES 3: 110.97 High Mar 31 and the bull trigger
- RES 2: 110.55 High Apr 6
- RES 1: 110.33 High Jun 4
- PRICE: 110.07 @ 06:20 BST Jun 16
- SUP 1: 109.19/09 Low Jun 7 / 50-day EMA
- SUP 2: 108.56/34 Low May 25 / Low May 7 and key S/T support
- SUP 3: 107.48 Low Apr 23 and the bear trigger
- SUP 4: 106.97 Low Mar 4
USDJPY is holding onto this week's gains and remains above support at 109.19. The sharp sell-off on Jun 4 and 7 resulted in a print below former support at 109.33, Jun 1 low. However there has not been any bearish follow through and instead, with the pair firmer once again, attention is on 110.33, Jun 4 high. A break would remove recent bearish concerns and refocus attention on 110.97, this year's high print. Support lies at 109.19, Jun 7 low.
EURJPY TECHS: Finds Support
- RES 4: 135.23 Bull channel top drawn off the Oct 30, 2020 low
- RES 3: 134.80 High Feb 8, 2018
- RES 2: 134.19 1.618 proj of Jun - Sep - Oct 2020 swing
- RES 1: 133.76/134.13 High Jun 10 / High Jun 1 and the bull trigger
- PRICE: 133.50 @ 06:31 BST Jun 16
- SUP 1: 132.65 Low Jun 14
- SUP 2: 132.52 Low May 24
- SUP 3: 132.13 50-day EMA
- SUP 4: 131.72 Bull channel base drawn off the Oct 30, 2020 low
EURJPY has found support this week at 132.65, Jun 14 low. The recent move lower saw price trade through the 20-day EMA signalling scope for a deeper corrective pullback with attention on the 50-day EMA at 132.13. Support is also seen at 132.52, May 24 low. On the upside, firm resistance is at 133.76, Jun 10 high. A break would expose 134.13, Jun 1 high and the bull trigger.
AUDUSD TECHS: Looking For A Break Lower
- RES 4: 0.8007 High Feb 25
- RES 3: 0.7891/95 High May 10 / 76.4% of the Feb 25 - Apr 1 sell-off
- RES 2: 0.7813/46 High May 18 / High May 12
- RES 1: 0.7776 High Jun 11
- PRICE: 0.7693 @ 06:38 BST Jun 16
- SUP 1: 0.7646 Low Jun 3
- SUP 2: 0.7635 Low Apr 14
- SUP 3: 0.7586 Low Apr 13
- SUP 4: 0.7546 200-dma
AUDUSD is softer but still trades in a range. The pair did break through 0.7675 on Jun 3 but immediately reversed the sharp move lower. The move lower though does highlight a bearish risk. A resumption of weakness would open 0.7586, Apr 13 low and 0.7532, Apr 1 low and a key support. The bear trigger is 0.7646, Jun 3 low. Initial resistance is at 0.7776, Jun 11 high and 0.7813, May 18 high. A move above the latter would ease bearish pressure.
USDCAD TECHS: Testing Key Resistance At 1.2203
- RES 4: 1.2419 High Apr 27
- RES 3: 1.2351 High May 4 and a key near-term resistance
- RES 2: 1.2231 50-day EMA
- RES 1: 1.2203/04 High May 13 / High Jun 15
- PRICE: 1.2177 @ 06:43 BST Jun 16
- SUP 1: 1.2057/2007 Low Jun 7 / Low May 18
- SUP 2: 1.2000 Psychological round number
- SUP 3: 1.1920 Low May 2015
- SUP 4: 1.1869 2.0% 10-dma envelope
USDCAD key resistance is at 1.2203, May 6 high and this level was probed yesterday. The underlying trend is bearish however a clear break higher would signal potential for a stronger corrective bounce and expose the 50-day EMA at 1.2231. A failure at current levels and a reversal lower would refocus attention on the key support and bear trigger at 1.2007, May 18 low. Initial support is at 1.2057.
FIXED INCOME
BUND TECHS: (U1) Pullback Considered Corrective
- RES 4: 174.07 High Mar 29
- RES 3: 173.79 High Apr 8
- RES 2: 173.32 76.4% retracement of the Mar 25 - May 19 sell-off
- RES 1: 173.16 High Jun 11
- PRICE: 172.31 @ 05:08 BST Jun 16
- SUP 1: 171.93 20-day EMA
- SUP 2: 170.99 Low Mar 31 and key short-term support
- SUP 3: 170.56 Low May 24
- SUP 4: 170.27 Low May 21
Bund futures maintain a firmer tone despite this week's corrective pullback. The breach last week of the 50-day EMA last week and 172.05, Jun 4 high. signals scope for stronger short-term gains. Attention is on 173.32 next, a Fibonacci retracement. On the downside, initial support lies at the 20-day EMA that intersects at 171.93. Key near-term support has been defined at 170.99, Mar 31 low where a break is required to signal a reversal.
BOBL TECHS: (U1) Trend Conditions Remain Bullish
- RES 4: 134.835 1.500 proj of the May 20 - 26 - 31 price swing
- RES 3: 134.758 1.382 proj of the May 20 - 26 - 31 price swing
- RES 2: 134.663 1.236 proj of the May 20 - 26 - 31 price swing
- RES 1: 134.510 1.00 proj of the May 20 - 26 - 31 price swing
- PRICE: 134.240 @ 05:07 BST Jun 16
- SUP 1: 134.137 20-day EMA
- SUP 2: 133.860 Low May 28 and 31 and key short-term support
- SUP 3: 133.690 Low May 24
- SUP 4: 133.450 Low May 20 and the bear trigger
Bobl futures remain bullish and the recent pullback is still considered corrective. On Jun 4, price cleared 134.100. May 26 and 27 high. The break confirms a bullish price sequence of higher highs and higher lows, highlighting an uptrend. Scope is for a move towards 134.510 next, a Fibonacci projection and the Jun 11 high. Key short-term support has been defined at 133.860, May 28 and 31 low. Initial support is at 134.137.
SCHATZ TECHS: (U1) Remains Below Recent Highs
- RES 4: 112.235 2.00 proj of the May 24 - 27 - 31 price swing
- RES 3: 112.213 1.764 proj of the May 24 - 27 - 31 price swing
- RES 2: 112.216 1.618 proj of the May 24 - 27 - 31 price swing
- RES 1: 112.210 High Jun 11
- PRICE: 112.170 @ 05:13 BST Jun 16
- SUP 1: 112.160 Low Jun 9 and 10
- SUP 2: 112.150 Low Jun 4, 7, 8
- SUP 3: 112.145 Low Jun 3
- SUP 4: 112.135 Low May 27, 28 and 31 and key near-term support
Schatz futures maintain a bullish tone and the recent pullback is considered corrective. Last week the contract cleared resistance at 112.180, May 27 high. The break highlights a stronger short-term bullish tone signalling scope for a climb towards 112.216 and 112.223 next, Fibonacci projections. Key trend support has been defined at 112.135, late May lows where a break is required to reinstate a bearish theme. Initial support is at 112.160, Jun 10 low.
GILT TECHS: (U1) Watching Support
- RES 4: 129.19 1.382 proj of the May 13 - 26 - Jun 3 price swing
- RES 3: 128.92 1.236 proj of the May 13 - 26 - Jun 3 price swing
- RES 2: 128.50 1.00 proj of the May 13 - 26 - Jun 3 price swing
- RES 1: 128.39 High Jun 11
- PRICE: 127.64 @ Close Jun 15
- SUP 1: 127.34 Low Jun 10
- SUP 2: 127.13 Low Jun 8
- SUP 3: 126.70 Low Jun 3 and key near-term support
- SUP 4: 126.55 Low May 21
Last week Gilt futures cleared 127.74/85, Apr 20 and May 7, 26 highs respectively and a key resistance zone. The move through 127.74 confirms a bullish price sequence of higher highs and higher lows, highlighting a bull theme. This week's pullback is likely a correction with initial support seen at 127.34, Jun 10 low. Key short-term trend support has been defined at 126.70, Jun 3 low. The focus is on a climb to 128.50 next, a Fibonacci projection.
BTP TECHS: (U1) Needle Still Points North
- RES 4: 153.82 High Feb 12 (cont)
- RES 3: 153.40 1.236 proj of the May 19 - 28 price swing
- RES 2: 152.66 1.00 proj of the May 19 - 28 price swing
- RES 1: 152.47 High Jun 14
- PRICE: 151.82 @ Close Jun 15
- SUP 1: 150.75 Low Jun 10
- SUP 2: 150.11 Low Low Jun 8 and key near-term support
- SUP 3: 149.53 Low May 28
- SUP 4: 148.80 Low May 25
BTP futures maintain the current bullish cycle following the reversal from the 147.00 low on Mar 19 and last week's gains. With bulls clearly in control and momentum still positive, attention is on 152.66 next, a Fibonacci projection. The contract is also approaching the Feb high of 153.82. On the downside, firm support has been defined at 150.11, Jun 8 low. Initial support lies at 150.75, Jun 10 low.
EQUITIES
EUROSTOXX 50 TECHS: (M1) Holding Onto Gains
- RES 4: 4290.00 High Jan 14, 2008
- RES 3: 4265.00 High Jan 15, 2008
- RES 2: 4235.67 Bull channel top drawn off the Feb 26 low
- RES 1: 4158.00/75.00 High Jun 15 / Low Nov 26, 2007 (cont)
- PRICE: 4147.00 @ 05:39 BST Jun 16
- SUP 1: 4072.94/4016.00 20-day EMA / Low May 27
- SUP 2: 3988.18/75.54 50-day EMA / Channel base from Feb 26 low
- SUP 3: 3882.00 Low May 19
- SUP 4: 3844.00 Low May 13 and the bear trigger
EUROSTOXX 50 futures traded higher once again yesterday as the contract extends its climb and maintains a bullish price sequence of higher highs and higher lows. Furthermore, moving average studies also remain in bull mode, reinforcing current trend conditions. The focus is on 4175.00 next, Nov 26 2008 low. On the downside, firm trend support is unchanged at 3844.00, May 13 low. Initial support lies at 4072.94, the 20-day EMA.
E-MINI S&P (U1): Bullish Conditions Intact
- RES 4: 4344.98 3.0% 10-dma envelope
- RES 3: 4300.00 Round Number Resistance
- RES 2: 4264.41 1.618 proj of Mar 25 - May 10 - 13 price swing
- RES 1: 4258.25 High Jun 15
- PRICE: 4236.50 @ 07:20 BST Jun 16
- SUP 1: 4194.57/55.50 20-day EMA / Low Jun 3
- SUP 2: 4136.27/4046.00 50-day EMA / Low May 19
- SUP 3: 4020.20 Low May 13 and key short-term support
- SUP 4: 4005.50 Low Apr 5
S&P E-minis maintains a bullish tone and traded higher once again yesterday. The contract recently moved above 4228.25 on May 10. The break confirms a resumption of the broader uptrend and signals potential for further gains with the next objective at 4264.41, a Fibonacci projection. Further out, the break higher also opens 4300.00. Initial firm support is at 4155.00, Jun 3 low. The broader medium-term trend support is at 4020.00, May 13 low.
COMMODITIES
BRENT TECHS: (Q1) Defying Gravity
- RES 4: $76.97 1.23 proj of Mar 23 - May 18 - May 21 price swing
- RES 3: $75.00 - Round number resistance
- RES 2: $75.60 - High Apr 25, 2019 (cont)
- RES 1: $74.73 - Intraday high
- PRICE: $74.47 @ 07:02 BST Jun 16
- SUP 1: $70.84 - 20-day EMA
- SUP 2: $69.90 - High May 18 and the recent break out level
- SUP 3: $66.39/64.50 - Low May 24 / Low May 21 and key support
- SUP 4: $63.51 - Low Apr 22
Brent crude futures have traded higher again today, extending the underlying uptrend. The $72.00 handle was cleared last week and the price is above the $74.00 mark. Attention turns to $75.60 next, Apr 25, 2019 high. Moving average studies remain bullish too, reinforcing current conditions. Weakness through $64.50, the May 21 low is required to highlight a key short-term top. Initial support lies at $70.84, the 20-day EMA ahead of $69.90, May 18 high.
WTI TECHS: (N1) Still Heading North
- RES 4: $74.47 - 3.382 proj of Mar 23 - 30 - Apr 5 price swing
- RES 3: $74.00 - Round number resistance
- RES 2: $73.20 - 3.236 proj of Mar 23 - 30 - Apr 5 price swing
- RES 1: $72.83 - Intraday high
- PRICE: $72.60 @ 07:07 BST Jun 16
- SUP 1: $70.65 - Low Jun 14
- SUP 2: $68.44 - 20-day EMA
- SUP 3: $67.02 - High May 18
- SUP 4: $63.63/61.56 - Low May 24 / Low May 21
WTI crude futures remain bullish and the contract has traded higher once again today. The psychological $70.00 handle has recently been cleared. The break reinforces current trend conditions and the focus is on $73.20 next, a Fibonacci projection. Key trend support has been defined at $61.56, May 21 low. A break is required to suggest a key short-term top. Firm support is seen at $68.06, the 20-day EMA.
GOLD TECHS: 50-day EMA Remains Exposed
- RES 4: $1959.4 - High Jan 6 and key resistance
- RES 3: $1927.7 - High Jan 7
- RES 2: $1903.8/16.6 - High Jun 8 / High Jun 1 and the bull trigger
- RES 1: $1877.7 - High Jun 14
- PRICE: $1860.1 07:24 BST Jun 16
- SUP 1: $1844.9 - Low Jun 14
- SUP 2: $1843.2 - 50-day EMA
- SUP 3: $1808.9 - Low May 13
- SUP 4: $1785.1 - Low May 6
Gold traded lower Monday, extending Friday's sell-off. The yellow metal pushed through $1856.2, Jun 4 low. The break strengthens a short-term bearish case exposing the 50-day EMA at $1843.2. The 50-day EMA also represents a strong area of trend support. For bulls, Monday's rebound does highlight a short-term bullish signal. The yellow metal will need to extend the rebound to suggest a base has instead been established.
SILVER TECHS: Key Resistance Remains Intact
- RES 4: $30.100 - High Feb 1 and key resistance
- RES 3: $29.053 - High Feb 2
- RES 2: $28.753 - High May 18 and the bull trigger
- RES 1: $28.556 - High Jun 1
- PRICE: $27.758 @ 07:57 BST Jun 16
- SUP 1: $27.178 - 50-day EMA
- SUP 2: $27.040 - Low Jun 3 and key near-term support
- SUP 3: $26.721 - Low Mar 13
- SUP 4: $25.718 - Low Apr 29
Silver has failed to hold above the $28.00 handle and key resistance at $28.556/753, Jun 1 and May 18 highs respectively remains intact. A break of this zone is required to negate recent bearish concerns following the sharp sell-off on Jun 3. Clearance of $28.753 would also confirm a resumption of the uptrend. On the downside, key short-term support has been defined at $27.040, Jun 3 low. A break would be bearish.
Why MNI
MNI is the leading provider
of intelligence and analysis on the Global Fixed Income, Foreign Exchange and Energy markets. We use an innovative combination of real-time analysis, deep fundamental research and journalism to provide unique and actionable insights for traders and investors. Our "All signal, no noise" approach drives an intelligence service that is succinct and timely, which is highly regarded by our time constrained client base.Our Head Office is in London with offices in Chicago, Washington and Beijing, as well as an on the ground presence in other major financial centres across the world.