
Why MNI
MNI is the leading provider
of intelligence and analysis on the Global Fixed Income, Foreign Exchange and Energy markets. We use an innovative combination of real-time analysis, deep fundamental research and journalism to provide unique and actionable insights for traders and investors. Our "All signal, no noise" approach drives an intelligence service that is succinct and timely, which is highly regarded by our time constrained client base.Our Head Office is in London with offices in Chicago, Washington and Beijing, as well as an on the ground presence in other major financial centres across the world.
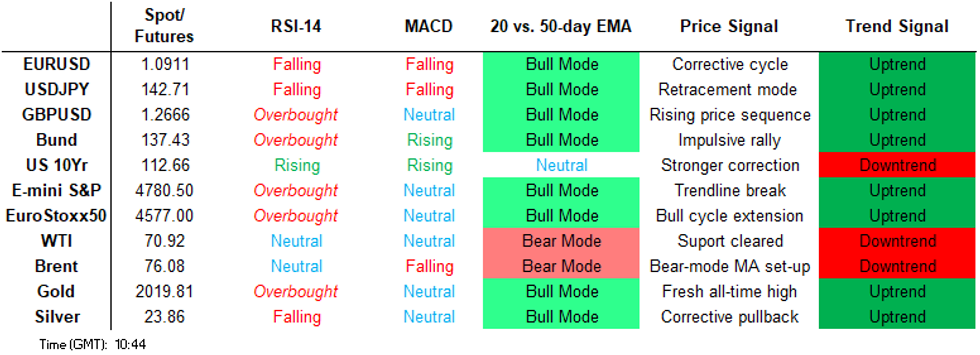
Price Signal Summary - Key Resistance In EURUSD Remains Exposed
- In the equity space, a bullish theme in S&P E-Minis remains intact and the contract is trading closer to its recent highs. The rally last week confirmed a resumption of the uptrend that started Oct 27. Note too that the contract has cleared resistance at 4738.50, the Jul 27 high, reinforcing current positive trend conditions. This signals scope for a climb towards 4800.00 next. On the downside, initial firm support lies at 4645.17, the 20-day EMA. A bullish theme in EUROSTOXX 50 futures remains intact and the contract traded to a fresh trend high last week. This confirms, once again, a resumption of the uptrend and maintains a bullish price sequence of higher highs and higher lows. The focus is on 4636.70, the 76.4% retracement of the 2000 - 2009 downleg (cont). Support to watch is at 4480.80, the 20-day EMA.
- In FX, EURUSD traded sharply higher last week. The recovery is a bullish development and signals the end of the recent corrective pullback between Nov 29 - Dec 8. Scope is for a test of key short-term resistance at 1.1017, the Nov 29 high and a bull trigger. Moving average studies are in a bull-mode position, highlighting an uptrend. Initial support lies at 1.0845, the 20-day EMA. A bullish theme in GBPUSD remains intact and last week’s rally reinforces this theme. Key resistance and the bull trigger at 1.2733, the Nov 29 high, has been cleared, confirming a resumption of the uptrend. Sights are on 1.2800 next. Initial firm support to watch is 1.2579, the 20-day EMA. A sharp sell-off in USDJPY last week reinforces current bearish conditions. The pair has cleared support at 141.71, the Dec 7 low, to confirm a resumption of the downtrend that started on Nov 13. Sights are on 140.71, 76.4% of the Jul 14 - Nov 13 bull run. Clearance of this level would further reinforce bearish conditions. Initial resistance is at 143.78, 50.% of the Dec 11 - 14 sell-off.
- On the commodity front, Gold traded sharply higher last Wednesday. This signals a S/T reversal and the end of the recent Dec 4 - 13 corrective pullback. Moving average studies remain in a bull-mode position, highlighting an uptrend. A continuation higher would signal scope for a climb toward key resistance and the Dec 4 all-time high of $2135.4. Initial firm support lies at $1973.2, the Dec 13 low. In the oil space, bearish conditions in WTI futures remain intact and last Tuesday’s sell-off reinforced this condition. The contract has cleared $69.08, Dec 7 low, to confirm a resumption of the downtrend. This maintains the price sequence of lower lows and lower highs and note that MA studies are in a bear-mode position, highlighting a downtrend. The focus is on $67.07, Jun 23 low. Gains are considered corrective. Resistance to watch is $73.27, the 20-day EMA.
- In the FI space, Bund futures maintain a firmer short-term tone following last week’s gains. The break of resistance at 135.81, the Dec 7 high, confirmed a resumption of the uptrend. This opens 137.58, a 3.00 projection of the Nov of the 13 - 17 - 24 price swing. Key short-term support has been defined at 134.37, the Dec 8 low. A short-term pullback would be considered corrective. The current uptrend in Gilt futures remains intact. Last week’s rally reinforces this theme and confirms once again, a resumption of the underlying uptrend. The focus is on 102.09, a 2.236 projection of the Nov 24 - 29 - 30 price swing. Initial firm support lies at 98.97, the Dec 6 high and a recent breakout level. Short-term weakness would be considered corrective.
FOREIGN EXCHANGE
EURUSD TECHS: Bull Trigger Remains Exposed
- RES 4: 1.1081 76.4% retracement of the Jul 18 - Oct 3 downleg
- RES 3: 1.1065 High Aug 10
- RES 2: 1.1017 High Nov 29 and the bull trigger
- RES 1: 1.1009 High Dec 14
- PRICE: 1.0912 @ 05:50 GMT Dec 18
- SUP 1: 1.0845/1.0791 20- and 50-day EMA values
- SUP 2: 1.0724 Low Dec 8 and the bear trigger
- SUP 3: 1.0693 Low Nov 14
- SUP 4: 1.0665 61.8% retracement of the Oct 3 - Nov 29 rally
EURUSD traded sharply higher last week. The recovery is a bullish development and signals the end of the recent corrective pullback between Nov 29 - Dec 8. The rally suggests scope for a test of key short-term resistance at 1.1017, the Nov 29 high and a bull trigger. Moving average studies are in a bull-mode position, highlighting an uptrend. Key support has been defined at 1.0724, the Dec 8 low.
GBPUSD TECHS: Bullish Trend Structure
- RES 4: 1.2996 High Jul 27
- RES 3: 1.2881 76.4% retracement of the Jul 14 - Oct 4 bear leg
- RES 2: 1.2819 High Aug 10
- RES 1: 1.2800 High Aug 22
- PRICE: 1.2689 @ 06:06 GMT Dec 18
- SUP 1: 1.2612 Low Dec 14
- SUP 2: 1.2579/00 20-day EMA / Low Dec 13 and key support
- SUP 3: 1.2482 50-day EMA
- SUP 4: 1.2374 Low Nov 17
A bullish theme in GBPUSD remains intact and last week’s rally reinforces this theme. Note that moving average studies are in a bull-mode set-up, highlighting a rising trend. Key resistance and the bull trigger at 1.2733, the Nov 29 high, has been cleared, confirming a resumption of the uptrend. Sights are on 1.2800 next. Initial firm support to watch is 1.2579, the 20-day EMA.
EURGBP TECHS: Corrective Cycle Still In Play
- RES 4: 0.8725 High Nov 22
- RES 3: 0.8690 High Nov 27
- RES 2: 0.8646 50-day EMA
- RES 1: 0.8634 High Dec 14
- PRICE: 0.8604 @ 06:23 GMT Dec 18
- SUP 1: 0.8549 Low Dec 11 and the bear trigger
- SUP 2: 0.8524 Low Sep 5
- SUP 3: 0.8493 Low Aug 23 and a key support
- SUP 4: 0.8414 2.0% 10-dma envelope
The EURGBP trend needle continues to point south and the latest recovery appears to be a correction - for now. Moving average studies are in a bear-mode position highlighting a downtrend. A resumption of weakness would open 0.8524, the Sep 5 low. On the upside, initial firm resistance to watch is at 0.8646, the 50-day EMA. A clear break of this average would instead highlight a stronger short-term reversal.
USDJPY TECHS: Bear Cycle Intact
- RES 4: 147.32 High Dec 7
- RES 3: 146.59 High Dec 11 and key short-term resistance
- RES 2: 143.78 50.% retracement of the Dec 11 - 14 sell-off
- RES 1: 142.90 High Dec 14
- PRICE: 142.17 @ 06:51 GMT Dec 18
- SUP 1: 140.71 76.4% of the Jul 14 - Nov 13 bull run
- SUP 2: 140.23 2.00 proj of the Nov 13 - 21 - 22 price swing
- SUP 3: 139.11 1.764 proj of the Nov 13 - 21 - 22 price swing
- SUP 4: 138.07 Low Jul 28
A sharp sell-off in USDJPY last week reinforces current bearish conditions. The pair has cleared support at 141.71, the Dec 7 low, to confirm a resumption of the downtrend that started on Nov 13. Sights are on 140.71, a Fibonacci retracement point. Clearance of this level would further reinforce bearish conditions. On the upside, key short-term resistance has been defined at 146.59, the Dec 11 high.
EURJPY TECHS: Key Support Remains Exposed
- RES 4: 159.93 High Dec 4
- RES 3: 159.17 50-day EMA
- RES 2: 158.44 20-day EMA
- RES 1: 157.68 High Dec 11 and key short-term resistance
- PRICE: 155.26 @ 07:01 GMT Dec 18
- SUP 1: 153.23 Low Dec 7 and the bear trigger
- SUP 2: 152.24 3.764 proj of the Nov 16 - 21 - 27 price swing
- SUP 3: 151.42 Low Jul 28 and a key support
- SUP 4: 150.92 Low Jun 14
A bear threat in EURJPY remains present. Last week’s move lower reinforces the bearish theme and the recent recovery from 153.23, the Dec 7 low is considered corrective. Key short-term resistance to watch is at 157.68, the Dec 11 high. A break would signal a short-term reversal. On the downside, sights are on the bear trigger at 153.23, the Dec 7 low. A break would open 151.42, the Jul 28 low.
AUDUSD TECHS: Bulls Remain In The Driver’s Seat
- RES 4: 0.6847 High Jul 20
- RES 3: 0.6821 High Jul 27
- RES 2: 0.6747 76.4% retracement of the Jul 13 - Oct 26 bear leg
- RES 1: 0.6735 Intraday high
- PRICE: 0.6726 @ 10:06 GMT Dec 18
- SUP 1: 0.6655 Low Dec 14
- SUP 2: 0.6591/26 20-day EMA / Low Dec 07
- SUP 3: 0.6524 50-day EMA
- SUP 4: 0.6453 Low Nov 17
The uptrend in AUDUSD remains intact and last week’s gains reinforce this theme. The pair has traded through resistance at 0.6691, the Dec 4 high and a bull trigger. This confirms a resumption of the uptrend and paves the way for a climb towards 0.6747 next, 76.4% of the Jul 13 - Oct 26 bear leg. On the downside, key short-term support has been defined at 0.6526, the Dec 7 low. A break would threaten the uptrend.
USDCAD TECHS: Bears Remain In The Driver’s Seat
- RES 4: 1.3777 High Nov 16
- RES 3: 1.3712 High Nov 24
- RES 2: 1.3619 High Dec 7 and 12 and key short-term resistance
- RES 1: 1.3520 High Dec 14
- PRICE: 1.3380@ 07:57 GMT Dec 18
- SUP 1: 1.3320 Low Aug 4
- SUP 2: 1.3283 76.4% retracement of the Jul 14 - Nov 1 bull phase
- SUP 3: 1.3267 2.0% 10-dma envelope
- SUP 4: 1.3184 Low Aug 1
The USDCAD trend outlook remains bearish and the latest sell-off reinforces this condition. The pair has cleared the bear trigger at 1.3480, the Dec 4 low. This confirms a resumption of the downtrend and ends the consolidation phase posted since the beginning of December. Sights are on 1.3283, a Fibonacci retracement. On the upside, key short-term resistance has been defined at 1.3619, the Dec 7 / 12 high.
FIXED INCOME
BUND TECHS: (H4) Bullish Price Sequence Remains Intact
- RES 4: 138.76 3.50 proj of the Nov of the 13 - 17 - 24 price swing
- RES 3: 138.49 3.382 proj of the Nov of the 13 - 17 - 24 price swing
- RES 2: 138.00 Round number resistance
- RES 1: 137.58 3.00 proj of the Nov of the 13 - 17 - 24 price swing
- PRICE: 137.33 @ 05:28 GMT Dec 18
- SUP 1: 135.81/134.37 Low Dec 15 / 8 and a key support
- SUP 2: 134.03 20-day EMA
- SUP 3: 133.42 Low Dec 4
- SUP 4: 132.59 Low Dec 1
Bund futures maintain a firmer short-term tone following last week’s gains. The break of resistance at 135.81, the Dec 7 high, confirmed a resumption of the uptrend and maintains the bullish price sequence of higher highs and higher lows. This opens 137.58, a Fibonacci projection. On the downside, key short-term support has been defined at 134.37, the Dec 8 low. A short-term pullback would be considered corrective.
BOBL TECHS: (H4) Trend Needle Points North
- RES 4: 119.438 3.618 proj of the Sep 28 - Oct 10 - 19 price swing
- RES 3: 119.320 3.50 proj of the Sep 28 - Oct 10 - 19 price swing
- RES 2: 119.202 3.382 proj of the Nov 14 - 17 - 24 price swing
- RES 1: 119.160 High Dec 14
- PRICE: 119.020 @ 05:44 GMT Dec 18
- SUP 1: 118.330 Low Dec 15
- SUP 2: 117.910 Low Dec 13
- SUP 3: 117.800 Low Dec 8 and a key support
- SUP 4: 117.610 20-day EMA
A bull cycle in Bobl futures remains in play and the latest recovery is a positive development. Key short-term resistance at 118.480 has been cleared, the Dec 7 high, resuming the uptrend. This maintains the bullish price sequence of higher highs and higher lows and opens the 119.202 next, a Fibonacci projection. On the downside, key short-term support has been defined at 117.800, Dec 8 low. A pullback would be considered corrective.
SCHATZ TECHS: (H4) Bullish Outlook
- RES 4: 106.774 1.618 proj of the Nov 24 - 30 minor price swing
- RES 3: 106.698 1.50 proj of the Nov 24 - 30 minor price swing
- RES 2: 106.621 1.382 proj of the Nov 24 - 30 minor price swing
- RES 1: 106.527 1.236 proj of the Nov 24 - 30 minor price swing
- PRICE: 106.385 @ 05:56 GMT Dec 18
- SUP 1: 106.160 Low Dec 15
- SUP 2: 105.955 Low Dec 13
- SUP 3: 105.780 Low Dec 1
- SUP 4: 105.640 Low Nov 29
Trend conditions in Schatz futures remain bullish and last week’s rally reinforces current conditions. The contract has cleared 106.290, the Dec 6 high. This confirms a resumption of the uptrend and maintains the positive price sequence of higher highs and higher lows. Scope is seen for a climb towards 106.527, a Fibonacci projection. Key short-term support has been defined at 105.955, Dec 13 low. A pullback would be considered corrective.
GILT TECHS: (H4) Uptrend Remains Intact
- RES 4: 102.80 2.50 proj of the Nov 24 - 29 - 30 price swing
- RES 3: 102.48 2.382 proj of the Nov 24 - 29 - 30 price swing
- RES 2: 102.09 2.236 proj of the Nov 24 - 29 - 30 price swing
- RES 1: 101.98 High May 11 (cont)
- PRICE: 101.18 @ Close Dec 15
- SUP 1: 100.20 High Dec 13 and gap high
- SUP 2: 98.97 High Dec 6 and a recent breakout level
- SUP 3: 98.07 20-day EMA
- SUP 4: 97.39 Low Dec 11 and a key support
The current uptrend in Gilt futures remains intact. Last week’s rally reinforces this theme and confirms once again, a resumption of the underlying uptrend. This also maintains a bullish price sequence of higher highs and higher lows. The focus is on 102.09, a Fibonacci projection point. Initial firm support lies at 98.97, the Dec 6 high and a recent breakout level. Short-term weakness would be considered corrective.
BTP TECHS: (H4) Northbound
- RES 4: 120.60 2.50 proj of the Nov 10 - 17 - 24 price swing
- RES 3: 120.00 Psychological round number
- RES 2: 119.77 2.236 proj of the Nov 10 - 17 - 24 price swing
- RES 1: 119.27 High Dec 15
- PRICE: 118.96 @ Close Dec 15
- SUP 1: 117.18 High Dec 13 and gap high
- SUP 2: 115.70 Low Dec 8 and key short-term support
- SUP 3: 114.13 Low Nov 30
- SUP 4: 112.70 Low Nov 24
A bull cycle in BTP futures remains in play. Last week’s move higher reinforces bullish conditions and confirms a resumption of the uptrend. The contract has cleared former resistance at 117.22, the Dec 7 high and a bull trigger. This maintains the current positive price sequence of higher highs and higher lows. 119.77, a Fibonacci projection, is the next objective. On the downside, key short-term support has been defined at 115.70, the Dec 8 low.
US 10YR FUTURE TECHS: (H4) Bull Rally Remains Intact
- RES 4: 114-06 2.00 proj of the Oct 19 - Nov 3 - Nov 13 price swing
- RES 3: 114-00 Round number resistance
- RES 2: 113-12+ 1.764 proj of the Oct 19 - Nov 3 - Nov 13 price swing
- RES 1: 112-28+ 1.618 proj of the Oct 19 - Nov 3 - Nov 13 price swing
- PRICE: 112-19 @ 11:13 GMT Dec 15
- SUP 1: 111-09+ High Dec 7 and a recent breakout level
- SUP 2: 110-09+ 20-day EMA
- SUP 3: 109-31+ Low Dec 11 and key short-term support
- SUP 4: 109-16 50-day EMA
Treasuries rallied sharply higher this week. Resistance at 111-09+, the Dec 7 high, has been cleared. This confirms a resumption of the uptrend and an extension of the price sequence of higher highs and higher lows. Sights are on 112-28+ next and 113-12+, Fibonacci projection points. On the downside, key short-term support has been defined at 109-31+, the Dec 11 low. First support is at 111-09+, the Dec 7 high.
EQUITIES
EUROSTOXX50 TECHS: (H4) Bulls Remains In The Driver’s Seat
- RES 4: 4697.50 1.382 projection of the Nov 8 - 24 - 28 price swing
- RES 3: 4662.90 1.236 projection of the Nov 8 - 24 - 28 price swing
- RES 2: 4636.70 76.4% retracement of the 2000 - 2009 downleg (cont)
- RES 1: 4634.00 High Dec 14
- PRICE: 4581.00 @ 06:30 GMT Dec 18
- SUP 1: 4553.00 Low Dec 14
- SUP 2: 4480.80 20-day EMA
- SUP 3: 4447.00 Low Dec 5
- SUP 4: 4370.00 Low Nov 28
A bullish theme in Eurostoxx 50 futures remains intact and the contract traded to a fresh trend high last week. This confirms, once again, a resumption of the uptrend and maintains a bullish price sequence of higher highs and higher lows. Moving average studies are in a bull-mode position too, signalling a rising cycle. The focus is on 4636.7, a long-term Fibonacci retracement. Support to watch is at 4480.80, the 20-day EMA.
E-MINI S&P TECHS: (H4) Trading Closer To Its Recent Highs
- RES 4: 4899.09 1.382 proj of Nov 10 - Dec 1 - 7 price swing (cont)
- RES 3: 4862.08 1.236 proj of Nov 10 - Dec 1 - 7 price swing (cont)
- RES 2: 4808.25 High Jan 4 2022 and major resistance
- RES 1: 4800.00 Round number resistance
- PRICE: 4779.00 @ 07:13 GMT Dec 18
- SUP 1: 4696.75 Low Dec 13
- SUP 2: 4632.25 20-day EMA
- SUP 3: 4594.00 Low Nov 30
- SUP 4: 4548.59 50-day EMA
A bullish theme in S&P e-minis remains intact and the contract is trading closer to its recent highs. The rally last week confirmed a resumption of the uptrend that started Oct 27. Note too that the contract has cleared resistance at 4738.50, the Jul 27 high, reinforcing current positive trend conditions. This signals scope for a climb towards 4800.00 next. On the downside, initial firm support lies at 4645.17, the 20-day EMA.
COMMODITIES
BRENT TECHS: (G4) Gains Considered Corrective
- RES 4: $87.12 - High Nov 3
- RES 3: $84.61 - High Nov 30 and key short-term resistance
- RES 2: $80.76 - 50-day EMA
- RES 1: $77.81 - 20-day EMA
- PRICE: $77.37 @ 06:59 GMT Dec 18
- SUP 1: $72.29/71.45 - Low Dec 13 / Low Jun 23
- SUP 2: $69.86 - Low May 4 and a key support
- SUP 3: $66.90 - 1.236 proj of the Oct 20 - Nov 16 - 30 price swing
- SUP 4: $64.81 - 1.382 proj of the Oct 20 - Nov 16 - 30 price swing
Brent futures remain in a downtrend and the recent sell-off reinforces the bear theme. The break lower confirmed once again, a resumption of the downtrend and maintains the bearish price sequence of lower lows and lower highs. Scope is seen for a move towards $71.45 next, the Jun 23 low. The recovery from last Wednesday’s low is considered corrective. The next resistance is $77.81, the 20-day EMA.
WTI TECHS: (G4) Trend Needle Continues To Point South
- RES 4: $82.64 - High Nov 3
- RES 3: $79.67 - High Nov 30 and a key short-term resistance
- RES 2: $76.37 - 50-day EMA
- RES 1: $73.27 - 20-day EMA
- PRICE: $72.51 @ 07:10 GMT Dec 18
- SUP 1: $67.07 - Jun 23 low
- SUP 2: $65.24 - Low May 4 and a key support
- SUP 3: $63.79 - 2.236 proj of the Sep 28 - Oct 6 - Oct 20 price swing
- SUP 4: $60.00 - Round number support
Bearish conditions in WTI futures remain intact and last Tuesday’s sell-off reinforced this condition. The contract has cleared $69.08, Dec 7 low, to confirm a resumption of the downtrend. This maintains the price sequence of lower lows and lower highs and note that MA studies are in a bear-mode position, highlighting a downtrend. The focus is on $67.07, Jun 23 low. Gains are considered corrective. Resistance to watch is $73.27, the 20-day EMA.
GOLD TECHS: Bullish Reversal
- RES 4: $2206.6 - 1.382 proj of the Oct 6 - 27 - Nov 13 price swing
- RES 3: $2177.6 - 1.236 proj of the Oct 6 - 27 - Nov 13 price swing
- RES 2: $2135.4 - High Dec 4 and all-time high
- RES 1: $2054.30- 50.0% retracement of the Dec 4 - 13 bear leg
- PRICE: $2023.8 @ 07:20 GMT Dec 15
- SUP 1: $1973.2 - Low Dec 13
- SUP 2: $1931.7 - Low Nov 13 and key support
- SUP 3: $1908.3 - Low Oct 16
- SUP 4: $1868.8 - Low Oct 13
Gold traded sharply higher last Wednesday. This signals a S/T reversal and the end of the recent Dec 4 - 13 corrective pullback. Moving average studies remain in a bull-mode position, highlighting an uptrend. A continuation higher would signal scope for a climb toward key resistance and the Dec 4 all-time high of $2135.4. A break of this level would confirm a resumption of the primary bull trend. Initial firm support lies at $1973.2, the Dec 13 low.
SILVER TECHS: Bullish Engulfing Candle Still In Play
- RES 4: $26.397 - 1.50 proj of the Oct 3 - 20 - Nov 13 price swing
- RES 3: $26.222 - High Apr 18 2022
- RES 2: $26.135 - High May 5 and a key resistance
- RES 1: $24.519/25.761 - 61.8% of Dec 4 - 13 bear leg / High Dec 4
- PRICE: $23.935 @ 08:00 GMT Dec 18
- SUP 1: $22.510 - Low Dec 13 and key short-term support
- SUP 2: $21.883 - Low Nov 13 and a key support
- SUP 3: $20.689 - Low Oct 3 and the bear trigger
- SUP 4: $19.904 - Low Mar 10 and a key support
Silver traded sharply higher last Wednesday highlighting a reversal. The metal is also trading closer to its recent highs, reinforcing the developing bullish theme. The Dec 13 price pattern appears to be a bullish engulfing candle. If correct, this highlights potential for a continuation higher. An extension would open $24.519, a Fibonacci retracement. Key resistance is at $25.761, the Dec 4 high. Key support lies at $22.510, the Dec 13 low.
Why MNI
MNI is the leading provider
of intelligence and analysis on the Global Fixed Income, Foreign Exchange and Energy markets. We use an innovative combination of real-time analysis, deep fundamental research and journalism to provide unique and actionable insights for traders and investors. Our "All signal, no noise" approach drives an intelligence service that is succinct and timely, which is highly regarded by our time constrained client base.Our Head Office is in London with offices in Chicago, Washington and Beijing, as well as an on the ground presence in other major financial centres across the world.