
Why MNI
MNI is the leading provider
of intelligence and analysis on the Global Fixed Income, Foreign Exchange and Energy markets. We use an innovative combination of real-time analysis, deep fundamental research and journalism to provide unique and actionable insights for traders and investors. Our "All signal, no noise" approach drives an intelligence service that is succinct and timely, which is highly regarded by our time constrained client base.Our Head Office is in London with offices in Chicago, Washington and Beijing, as well as an on the ground presence in other major financial centres across the world.
Price Signal Summary - FI Futures Resume Their Downtrend
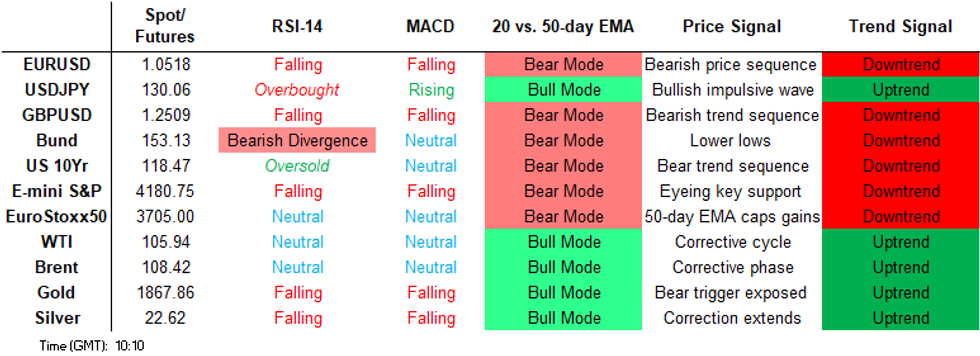
- In the equity space, S&P E-Minis remain in a downtrend, despite the recovery from Monday’s low. Fresh lows have reinforced underlying bearish conditions and Monday’s move lower resulted in a probe of key support at 4094.25, the Feb 25 low. A clear break of this level would reinforce bearish conditions. 4056.00, Monday’s low, has also been defined as an important bear trigger. EUROSTOXX 50 futures are consolidating but remain vulnerable. The moving average set-up continues to highlight a bear mode condition. A resumption of weakness would open 3551.60, the 61.8% retracement of the Mar 7 - 29 rally. Key resistance is unchanged at 3883.00, Apr 21 high.
- In FX, EURUSD is trading near its recent lows and remains in a clear downtrend. The recent consolidation appears to be a bear flag. A resumption of the downtrend would open 1.0454, the Jan 1 2017 low. The GBPUSD outlook remains bearish, following the recent impulsive selling pressure. The focus is on 1.2375, the 2.382 projection of the Mar 23 - Apr 13 - 14 price swing. USDJPY bulls have paused for breath. Last week’s resumption of the primary uptrend and the break of 130.00 suggests scope for further upside. The focus is on 131.96, the 1.00 projection of the Feb 24 - Mar 28 - 31 price swing.
- On the commodity front, Gold remains weak. The recent pullback from the $1998.4 high (Apr 18), and the breach last week of $1890.2, the Mar 29 low, continues to highlight a bearish threat. Attention is on $1848.8, 76.4% retracement of the Jan 28 - Mar 8 rally. On the upside, $1917.3 the 20-day EMA is seen as a firm short-term resistance. In the Oil space, WTI futures continue to trade inside a triangle formation that has appeared on the daily chart and is drawn from the Mar 15 low. The pattern is a bearish signal and suggests potential for a test and break of support at $95.28, Apr 25 low. Resistance is at $105.97/107.99, triangle resistance and the Apr 29 high. The triangle resistance has been probed, a clear break of this level is required to instead highlight a bullish breakout.
- The trend condition in the FI space remains bearish. Bund futures have traded lower today. This once again reinforces bearish conditions and an extension lower would open 151.99, the 0.618 projection of the Mar 7 - 29 - Apr 4 price swing. The broader trend condition in Gilts remains bearish. Resistance has been defined at 119.79, the Apr 26 high. Attention is on the bear trigger at 117.22 bear trigger, Apr 22 low.
FOREIGN EXCHANGE
EURUSD TECHS: Bear Flag
- RES 4: 1.0936 High Apr 21 and a key resistance
- RES 3: 1.0852 High Apr 22
- RES 2: 1.0721/58 20-day EMA / Low Apr 14 - recent breakout level
- RES 1: 1.0655 High Apr 27
- PRICE: 1.0516 @ 06:02 BST May 4
- SUP 1: 1.0472/54 Low Apr 28 / Low Jan 1 2017
- SUP 2: 1.0390 Low Jan 4 2017
- SUP 3: 1.0341 Low Jan 3 2017 and a key support
- SUP 4: 1.0333 1.236 proj of the Feb 10 - Mar 7 - 31 price swing
EURUSD remains in consolidation mode. This pause in the trend appears to be a bear flag - a bearish continuation pattern. The trend direction remains down and the move to fresh cycle lows last week confirmed an extension of the bearish price sequence of lower lows and lower highs. Further weakness is likely and the focus is on 1.0454 next, the Feb 22 2017 low. Initial firm resistance is seen at 1.0758.
GBPUSD TECHS: Bearish Outlook
- RES 4: 1.2974 Low Apr 13 and a recent breakout level
- RES 3: 1.2877 High Apr 25
- RES 2: 1.2772/2798 High Apr 26 / 20-day EMA
- RES 1: 1.2614 High Apr 29
- PRICE: 1.2479 @ 06:10 BST May 4
- SUP 1: 1.2412 Low Apr 28 and the bear trigger
- SUP 2: 1.2375 2.382 proj of the Mar 23 - Apr 13 - 14 price swing
- SUP 3: 1.2252 Low Jun 29 2020
- SUP 4: 1.2162 Low May 22 2020
GBPUSD remains above recent lows. The outlook is bearish following last week’s acceleration of the downtrend. Price has recently cleared 1.2974, Apr 13 low and 1.2676, last printed in September 2020. This has reinforced bearish conditions. The trend remains oversold, however, a reversal pattern is still required to signal a short-term base and possible reversal. The focus is 1.2375, a Fibonacci projection. 1.2614 marks initial resistance.
EURGBP TECHS: Needle Points North
- RES 4: 0.8600 High Dec 8 2021
- RES 3: 0.8552/53 2.0% 10-dma envelope / High Dec 14 2020
- RES 2: 0.8512 High Mar 31 and a key resistance
- RES 1: 0.8433/68 High Apr 29 / High Apr 27
- PRICE: 0.8429 @ 06:25 BST May 4
- SUP 1: 0.8371/67 50-day EMA / Low May 2
- SUP 2: 0.8313 Low Apr 22
- SUP 3: 0.8250 Low Apr 14 and key short-term support
- SUP 4: 0.8203 Low Mar 7 and the bear trigger
The EURGBP outlook remains bullish. Recent gains resulted in a break of 0.8405, the Apr 11 high. Clearance of this level highlights a bullish development and this also resulted in a move above 0.8435, the Apr 4 high. An extension higher would open 0.8512, the Mar 31 high and the next key resistance point. Firm support to watch lies at 0.8367, Monday’s low and just below the 50-day EMA.
USDJPY TECHS: Consolidating
- RES 4: 133.11 High Apr 4 2002
- RES 3: 132.39 High Apr 15 2002
- RES 2: 131.96 1.00 proj of the Feb 24 - Mar 28 - 31 price swing
- RES 1: 131.25 High Apr 28
- PRICE: 130.13 @ 06:32 BST May 4
- SUP 1: 128.34 Low Apr 28
- SUP 2: 126.95 Low Apr 27 and a key support
- SUP 3: 125.09 Low Apr 14
- SUP 4: 124.01 Low Apr 11
USDJPY is unchanged and continues to consolidate. The outlook remains bullish - the rally last Thursday confirmed a resumption of the uptrend. The psychological 130.00 handle has been cleared and 131.00 remains exposed. The focus is on 131.96 next, a Fibonacci projection. 126.95, the Apr 27 low, represents a key short-term support. A break would signal a possible short-term top.
EURJPY TECHS: Support Remains Intact
- RES 4: 141.41 3.0% 10-dma envelope
- RES 3: 141.06 High Jun 4 2015 and a key resistance
- RES 2: 140.93 0.50 proj of the Mar 7 - 28 - Apr 8 price swing
- RES 1: 138.00/140.00 High Apr 28 / High Apr 21 and the bull trigger
- PRICE: 136.83 @ 06:40 BST May 4
- SUP 1: 134.79/55 Low Apr 27 / 2.0% 10-dma envelope
- SUP 2: 134.46/30 50-day EMA / Low Apr 5 and a key support
- SUP 3: 132.95 Low Mar 24
- SUP 4: 132.33 Low Mar 23
The recent pullback in EURJPY appears to be a correction. The cross has remained above key support highlighted by the 50-day EMA. The average intersects at 134.46, just above an important support at 134.30, Apr 5 low. While this 134.46-30 zone holds, the trend condition remains bullish. Initial resistance is unchanged at 138.00, Apr 28 high. The bull trigger is also unchanged at 140.00, Apr 21 high.
AUDUSD TECHS: Bearish Threat Still Present
- RES 4: 0.7458 High Apr 20/21 and a key resistance
- RES 3: 0.7379 High Apr 22
- RES 2: 0.7301 50-day EMA
- RES 1: 0.7180/7261 High Apr 29 / High Apr 25
- PRICE: 0.7107 @ 06:45 BST May 4
- SUP 1: 0.7030 Low May 2
- SUP 2: 0.6985 Low Jan 31
- SUP 3: 0.6968 Low Jan 28 and a bear trigger
- SUP 4: 0.6921 Low Jul 14 2020
AUDUSD technical signals are unchanged and remain bearish. The pair has recently cleared support at 0.7165, the Mar 15 low and a former bear trigger. The break has reinforced bearish conditions and has also resulted in a breach of 0.7095, the Feb 24 low. This opens 0.6968 next, the Jan 28 low and a key support. Resistance is seen at 0.7261, Apr 5 high. Firmer resistance however is at 0.7301, the 50-day EMA.
USDCAD TECHS: Eyeing The M/T Bull Trigger
- RES 4: 1.3024 38.2% retracement of the Mar ‘20 - Jun ‘21 downleg
- RES 3: 1.3010 2.0% 10-dma envelope
- RES 2: 1.2964 High Dec 20 2021 and a key bull trigger
- RES 1: 1.2914 High May 2
- PRICE: 1.2839 @ 06:53 BST May 4
- SUP 1: 1.2719/2671 Low Apr 29 / 50-day EMA
- SUP 2: 1.2568 Low Apr 22
- SUP 3: 1.2459 Low Apr 21
- SUP 4: 1.2403 Low Apr 5 and a key support
The USDCAD trend needle continues to point north. The pair traded higher Monday and probed resistance at 1.2901, Mar 8 high. The strong recovery from the Apr 29 low of 1.2719 reinforces a bullish theme. A clear break of 1.2901 would pave the way for a climb towards the Dec 20 2021 high of 1.2964 - a key medium-term bull trigger. On the downside, first support lies at 1.2719.
FIXED INCOME
BUND TECHS: (M2) Trend Conditions Remain Bearish
- RES 4: 158.44 50-day EMA
- RES 3: 157.87 High Apr 7
- RES 2: 156.00 High Apr 28 and a key short-term resistance
- RES 1: 155.38 20-day EMA
- PRICE: 152.75 @ 07:41 BST May 4
- SUP 1: 152.44 Intraday low
- SUP 2: 151.99 0.618 proj of the Mar 7 - 29 - Apr 4 price swing
- SUP 3: 150.15 0.764 proj of the Mar 7 - 29 - Apr 4 price swing
- SUP 4: 150.00 Psychological round number
Trend signals in Bund futures continue to point south. The contract traded to a fresh cycle low yesterday of 152.66. The move lower confirms an extension of the bearish price sequence of lower lows and lower highs. Furthermore, moving average studies remain in bear mode. Attention is on 152.65 next, the Sep 1 2015 low (cont). Firm resistance has been defined at 156.00, the Apr 28 high.
BOBL TECHS: (M2) Path Of Least Resistance Remains Down
- RES 4: 129.209 50-day EMA
- RES 3: 129.350 High Apr 4 and a reversal point
- RES 2: 128.830 High Apr 7
- RES 1: 128.310 High Apr 8/28 and a key near-term resistance
- PRICE: 126.710 @ 07:42 BST May 4
- SUP 1: 126.530 Intraday low
- SUP 2: 126.480 Low Jun 5 2014 (cont)
- SUP 3: 126.196 0.50 proj of the Mar 7 - 29 - Apr 4 price swing
- SUP 4: 126.00 Round number support
Bobl futures remain below last week’s 128.310 high. The pullback from this level signals the end of the recent corrective bounce. Fresh cycle lows in April reinforce the primary downtrend, maintaining the broader bearish price sequence of lower lows and lower highs. Note that moving averages continue to point south. An extension lower would open 126.480 next, Jun 5 2014 low (cont). Key short-term trend resistance is at 128.310, the Apr 14/28 high.
SCHATZ TECHS: (M2) Fresh Cycle Low
- RES 4: 110.850 50-day EMA
- RES 3: 110.855 High Apr 4
- RES 2: 110.540 High Apr 28 and a key resistance
- RES 1: 110.458 20-day EMA
- PRICE: 110.060 @ 07:43 BST May 4
- SUP 1: 110.015 Intraday low
- SUP 2: 110.000 Round number support
- SUP 3: 109.983 0.50 proj of the Mar 7 - 30 - Apr 4 price swing
- SUP 4: 109.777 0.618 proj of the Mar 7 - 30 - Apr 4 price swing
The trend direction in Schatz futures remains down and today’s fresh cycle low reinforces this condition. The move lower confirms a resumption of the primary downtrend and an extension of the broader bearish price sequence of lower lows and lower highs. Moving average studies remain in a bear mode. The focus is on 109.983 next, a Fibonacci projection. Key short-term resistance is 110.540, the Apr 28 high.
GILT TECHS: (M2) Eyeing The Bear Trigger
- RES 4: 122.35 High Apr 4
- RES 3: 120.66 50-day EMA
- RES 2: 120.47 High Apr 8
- RES 1: 119.79 High Apr 25 and a bull trigger
- PRICE: 118.07 @ Close May 3
- SUP 1: 117.22 Low Apr 22 and a bear trigger
- SUP 2: 117.04 0.764 proj of the Mar 1 - 28 - Apr 4 price swing
- SUP 3: 116.35 Low Dec 30 2015
- SUP 4: 115.40 1.00 proj of the Mar 1 - 28 - Apr 4 price swing
The trend condition in Gilt futures remains bearish. Moving average studies continue to point south and the dominant bearish price sequence of lower lows and lower highs remains intact. A firm resistance has been defined at 119.79, Apr 26 high where a break is required to reinstate a bullish theme. Attention is on the 117.22 bear trigger. A break of this level would confirm a resumption of the primary downtrend.
BTP TECHS: (M2) Fresh Cycle Low Print
- RES 4: 136.62 50-day EMA
- RES 3: 136.12 High Apr 7
- RES 2: 135.23 High Apr 14
- RES 1: 133.04/53 20-day EMA / High Apr 28
- PRICE: 128.70 @ 07:44 BST May 4
- SUP 1: 128.42 Intraday low
- SUP 2: 128.08 2.00 proj of the Mar 31 - Feb 16 - Mar 1 price swing
- SUP 3: 127.63 1.00 proj of the Mar 1 - 29 - 31 price swing
- SUP 4: 125.88 2.236 proj of the Mar 31 - Feb 16 - Mar 1 price swing
The trend condition in BTP futures remains bearish - today’s move lower resulted in another fresh trend low print. This maintains the broader bearish price sequence of lower lows and lower highs that defines a downtrend. Moving average studies are in a bear mode too and the focus is on 128.08 next, a Fibonacci projection. Firm short-term resistance has been defined at 133.53, the Apr 28 high.
EQUITIES
EUROSTOXX50 TECHS: (M2) Bearish Price Structure
- RES 4: 4132.00 High Feb 10
- RES 3: 4072.00 High Feb 16
- RES 2: 3944.00 High Mar 29 and a key resistance
- RES 1: 3794.90/3883.00 50-day EMA / High Apr 21
- PRICE: 3713.00 @ 05:41 BST May 4
- SUP 1: 3608.00 Low Apr 27 and the bear trigger
- SUP 2: 3551 60 61.8% retracement of the Mar 7 - 29 rally
- SUP 3: 3523.00 Low Mar 11
- SUP 4: 3458.90 76.4% retracement of the Mar 7 - 29 rally
EUROSTOXX 50 futures remain in consolidation mode. The outlook remains bearish. This follows a reversal from the Apr 21 high of 3883.00. Price is trading below the 50-day EMA and last week’s breach of support at 3684.00, Apr 12 low and a bear trigger, reinforces a bearish condition. A resumption of weakness would open 3551.60, a Fibonacci retracement. Resistance is at 3883.00, Apr 21 high.
E-MINI S&P (M2): Probes Key Support
- RES 4: 4631.00 High Mar 29 and key resistance
- RES 3: 4588.75 High Apr 5
- RES 2: 4509.00 High Apr 21 and a key short-term resistance
- RES 1: 4303.50/4355.50 High Apr 26/28 / Low Apr 18
- PRICE: 4174.25 @ 06:46 BST May 4
- SUP 1: 4056.00 Low May 2
- SUP 2: 4029.25 High May 13 2021
- SUP 3: 4000.00 Psychological round number
- SUP 4: 3958.00 2.00 proj of the Mar 29 - Apr 18 - 21 price swing
S&P E-Minis remain in a downtrend, despite the recovery from Monday’s low. Fresh cycle lows continue to reinforce underlying bearish conditions and Monday’s move lower resulted in a probe of key support at 4094.25, the Feb 25 low. A clear break of this level would reinforce bearish conditions and open the 4000.00 handle. 4056.00, Monday’s low, has also been defined as an important bear trigger. Firm short-term resistance is at 4303.5.
COMMODITIES
BRENT TECHS: (N2) Triangle Highlights Bearish Risk
- RES 4: $121.13 - 76.4% retracement of the Mar 7 - 15 downleg
- RES 3: $115.76 - High Mar 24 and a bull trigger
- RES 2: $113.61 - High Apr 18 and a key near-term resistance
- RES 1: $110.00/112.00 - High Apr 29 / Triangle resistance
- PRICE: $106.13 @ 06:54 BST May 4
- SUP 1: $99.25 - Low Apr 25
- SUP 2: $97.18 - Low Apr 11
- SUP 3: $92.59 - Low Mar 15 and a key support
- SUP 4: $89.01 - Low Feb 25
Brent futures remain above the $99.25 low from Apr 25. A bearish threat remains present despite recent gains. The contract is trading inside a triangle, drawn from the Mar 15 low. This appears to be a bearish pattern. A break below $99.25 would highlight a triangle breakout and expose $97.18, the Apr 11 low, and $92.59, the Mar 15 low. Triangle resistance intersects at $112.00 today.
WTI TECHS: (M2) Remains Inside The Triangle Formation
- RES 4: $118.13 - High Mar 9
- RES 3: $113.51/113.90 - High Mar 24 / 76.4% of Mar 7 - 15 downleg
- RES 2: $109.20 - High Apr 18
- RES 1: $105.97/107.99 - Triangle resistance / High Apr 29
- PRICE: $103.68 @ 06:59 BST May 4
- SUP 1: $99.80/95.28 - Low Apr 27 / Low Apr 25
- SUP 2: $92.60 - Low Apr 11 and a key support
- SUP 3: $90.37 - Low Mar 15 and a bear trigger
- SUP 4: $86.67 - Low Feb 25
WTI futures remain above the Apr 25 low of $95.28. A triangle pattern has appeared on the daily chart, drawn from the Mar 15 low. This is a bearish pattern and a break of $95.28 would confirm a resumption of weakness and expose $92.60, Apr 11 low, and $90.37, the Mar 15 low and a key bear trigger. Triangle resistance intersects at $105.97 ahead of a key resistance at $109.20, Apr 18 high. A clear breach of these hurdles would be bullish.
GOLD TECHS: Trading Near Its Recent Lows
- RES 4: $2001.6 - 61.8% retracement of the Mar 8 - 29 downleg
- RES 3: $1998.4 - High Apr 18 and a bull trigger
- RES 2: $1958.4 - High Apr 20
- RES 1: $1900.0/1917.3 - High May 2 / 20-day EMA
- PRICE: $1863.4 @ 07:14 BST May 4
- SUP 1: $1850.5 - Low May 3
- SUP 2: $1848.8 - 76.4% retracement of the Jan 28 - Mar 8 rally
- SUP 3: $1821.1 - Low Feb 11
- SUP 4: $1780.4 - Low Jan 28
Gold remains vulnerable and is trading near its recent lows. The yellow metal has recently cleared support at the 50-day EMA. Furthermore, the pullback from $1998.4 (Apr 18 high), continues to highlight a bearish threat. This was reinforced last week by the break of $1890.2, Mar 29 low. The move lower yesterday opens $1848.8, a Fibonacci retracement. On the upside, $1917.3, the 20-day EMA is seen as a firm short-term resistance.
SILVER TECHS: Key Support Appears Exposed
- RES 4: $27.245 - High Jun 17 2021
- RES 3: $26.943 - High Mar 8 and the bull trigger
- RES 2: $26.222 - High Apr 18 and a key short-term resistance
- RES 1: $24.338 - 50-day EMA
- PRICE: $22.555 @ 07:18 BST May 4
- SUP 1: $22.123 - Low May 2
- SUP 2: $22.008 - Low Feb 3 and a key support
- SUP 3: $21.949 - Low Jan 7 2022
- SUP 4: $21.427 - Low Dec 15
Silver remains soft following the recent reversal from $26.222, Apr 18 high. Last week’s continuation lower, and Monday’s fresh low, has reinforced bearish conditions. Support at $23.974, Mar 29 low and $23.173, 76.4% of the Feb 3 - Mar 8 rally, have been cleared. The clear break of the latter has opened $22.008, the Feb 3 low and the next key support. The 50-day EMA, at $24.338, marks resistance.
Why MNI
MNI is the leading provider
of intelligence and analysis on the Global Fixed Income, Foreign Exchange and Energy markets. We use an innovative combination of real-time analysis, deep fundamental research and journalism to provide unique and actionable insights for traders and investors. Our "All signal, no noise" approach drives an intelligence service that is succinct and timely, which is highly regarded by our time constrained client base.Our Head Office is in London with offices in Chicago, Washington and Beijing, as well as an on the ground presence in other major financial centres across the world.