
Why MNI
MNI is the leading provider
of intelligence and analysis on the Global Fixed Income, Foreign Exchange and Energy markets. We use an innovative combination of real-time analysis, deep fundamental research and journalism to provide unique and actionable insights for traders and investors. Our "All signal, no noise" approach drives an intelligence service that is succinct and timely, which is highly regarded by our time constrained client base.Our Head Office is in London with offices in Chicago, Washington and Beijing, as well as an on the ground presence in other major financial centres across the world.
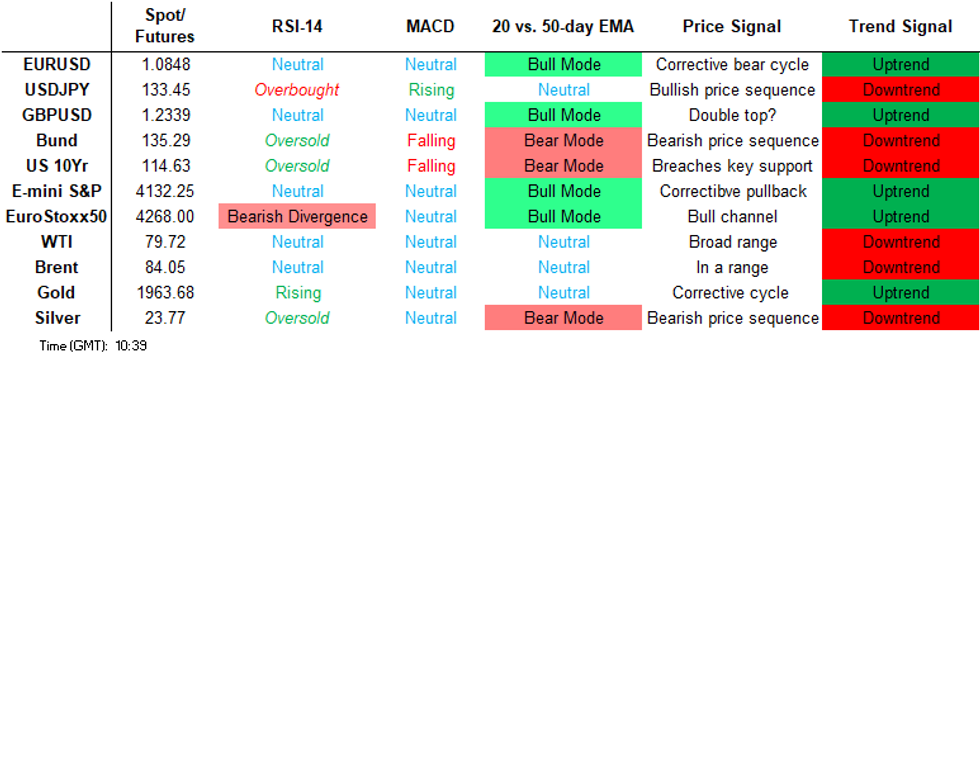
Price Signal Summary - Oil Futures Remain Bullish Following Today's Gap Higher
- In the equity space, S&P E-Minis ended last week on a bullish note. Price has breached 4119.50, reinforcing the bullish conditions. The move higher exposes 4148.48, 76.4% of the Feb 2 - Mar 13 downleg. Clearance of this level would signal scope for an extension towards 4205.50, Feb 16 high ahead of 4244.00, Feb 2 high and a key medium-term resistance. Firm support is at 4027.87, the 50-day EMA. EUROSTOXX 50 futures traded higher last week and the contract remains bullish. Price has pierced resistance at 4268.00, the Mar 6 high and a key resistance. A clear break of this hurdle would strengthen bullish conditions and open 4300.00 next. Moving average studies are in a bull-mode set-up and this highlights a broader uptrend. Initial firm support lies at 4146.30, the 20-day EMA.
- In FX, EURUSD remains below last week’s 1.0926 high. Resistance at 1.0930 is intact - for now - the Mar 23 high. This level represents a key short-term hurdle for bulls and a break would reinstate the recent bull theme and open 1.1033, the Feb 2 high. On the downside, support to watch lies at 1.0761 (20-day EMA) and 1.0706 (50-day EMA). A move through this support zone would be bearish. Short-term weakness in GBPUSD is considered corrective and support to watch lies at 1.2216, the 20-day EMA. A clear break of this average would signal scope for a deeper pullback. Recent gains have exposed resistance at 1.2448, Jan 23 high and a key hurdle for bulls. A break would highlight a 3 months range breakout and strengthen bullish conditions. The trend direction in USDJPY remains down and last week’s gains are considered corrective. However, the 50-day EMA has been tested, it intersects at 133.34 and represents a key S/T hurdle for bulls. A clear break would alter the picture and suggest scope for a stronger recovery. This would open 133.77, a Fibonacci retracement. On the downside, the bear trigger is at 129.64, the Mar 24 low. A break would resume the downtrend. Initial support lies at 132.21, the Mar 3.
- On the commodity front, trend conditions in Gold remain bullish and the recent short-term pullback is considered corrective. Note that price action since Mar 20 appears to be a pennant - a continuation pattern. This reinforces bullish conditions and signals scope for an extension higher near-term. The recent test above $2000.0 opens $2034.0 next, a Fibonacci projection. $1918.3 marks a firm support, the Mar 17 low - a break would signal scope for a deeper pullback. In the Oil space, WTI futures remain in a bull cycle and today’s gap higher at the open, strengthens this current condition. The contract has touched a high of $81.69, just above resistance at $81.04, the Mar 7 high. A clear break of $81.04 would signal scope for a continuation higher and open $83.04, the Jan 23 high. Key support is seen at $75.72, the Mar 31 high and the gap low on the daily chart. Initial support lies at $77.60, 23.6% retracement of the Mar 20 - Apr 3 rally .
- In the FI space, Bund futures maintain a softer tone following last week’s move lower as the contract extended the pullback from 139.54, Mar 24 high. Price has breached a key support at the 20-day EMA which intersects at 135.56. It represents an important pivot level and the break strengthens a bearish threat. 134.80, the Mar 22 low, has been tested. A breach of this support would open 134.15, a Fibonacci retracement. Initial resistance is at 136.77, the Mar 30 high. Gilt futures traded lower again Friday and the contract maintains a bearish short-term tone. Last week’s move down resulted in a break of support at the 20-day EMA which intersects at 103.68. The average represents an important short-term support and the clear break signals scope for a continuation lower near-term, towards 102.31 next, a Fibonacci retracement On the upside, initial resistance is seen at 104.47, last Thursday’s intraday high.
FOREIGN EXCHANGE
EURUSD TECHS: Approaching First Support At The 20-Day EMA
- RES 4: 1.1076 High Apr 1 2022
- RES 3: 1.1033 High Feb 2 and key resistance
- RES 2: 1.0940 High Feb 3
- RES 1: 1.0926/0930 High Mar 30 and 31 / High Mar 23
- PRICE: 1.0795 @ 05:41 BST Apr 3
- SUP 1: 1.0788 Intraday low
- SUP 2: 1.0761 20-day EMA
- SUP 3: 1.0706 50-day EMA
- SUP 4: 1.0631 Low Mar 20
EURUSD is starting the week on a softer note as the pair pulls away from last week’s 1.0926 high. Resistance at 1.0930 remains intact, Mar 23 high. This level represents a key short-term hurdle for bulls and a break would reinstate the recent bull theme and signal scope for a climb towards 1.1033, the Feb 2 high. On the downside, support to watch lies at 1.0761 (20-day EMA) and 1.0706 (50-day EMA). A move through this support zone would be bearish.
GBPUSD TECHS: Pulls Back From Last Week’s Highs
- RES 4: 1.2558 High Jun 9 2022
- RES 3: 1.2524 2.0% 10-dma envelope
- RES 2: 1.2448 High Jan 23 and a key medium-term resistance
- RES 1: 1.2342/2423 Intraday high / High Mar 31
- PRICE: 1.2280 @ 06:02 BST Apr 3
- SUP 1: 1.2216 20-day EMA
- SUP 2: 1.2191 Low Mar 24
- SUP 3: 1.2147 50-day EMA
- SUP 4: 1.2011 Low Mar 15
GBPUSD is trading lower today as the pair pulls back from last week’s highs. The move lower is considered corrective - for now - and support to watch lies at 1.2216, the 20-day EMA. A clear break of this average would signal scope for a deeper pullback. Recent gains have exposed resistance at 1.2448, the Jan 23 high and a key medium-term hurdle for bulls. A break would highlight a 3 months range breakout and strengthen bullish conditions.
EURGBP TECHS: Bullish Outlook
- RES 4: 0.8925 High Mar 7 and a key resistance
- RES 3: 0.8918 76.4% retracement of the Feb 3 - Mar 15 bear leg
- RES 2: 0.8866/78 High Mar 23 / Trendline drawn from the Feb 3 high
- RES 1: 0.8829 High Mar 30
- PRICE: 0.8787 @ 06:26 BST Apr 3
- SUP 1: 0.8771 Low Mar 28
- SUP 2: 0.8719 Low Mar 15 and key support
- SUP 3: 0.8712 61.8% retracement of the Dec 1 - Feb 3 bull leg
- SUP 4: 0.8691 Low Dec 19
EURGBP remains in consolidation mode and the cross continues to trade below 0.8866, the Mar 23 high. Recent gains, between Mar 15 - 23, highlight a bullish picture and attention is on a key short-term trendline resistance at 0.8878. The trendline is drawn from the Feb 3 high and a break would strengthen bullish conditions. Key support to watch is unchanged at 0.8719, Mar 15 low. Clearance of this level would instead reinstate a bearish theme.
USDJPY TECHS: Testing Resistance At The 50-Day EMA
- RES 4: 135.96 76.4% retracement of the Mar 8 - 24 bear leg
- RES 3: 135.11 High Mar 15
- RES 2: 134.75 61.8% retracement of the Mar 8 - 24 bear leg
- RES 1: 133.77 50.0% retracement of the Mar 8 - 24 bear leg
- PRICE: 133.39 @ 06:39 BST Apr 3
- SUP 1: 132.21/130.76 Low Mar 30 / 29
- SUP 2: 129.64 Low Mar 24 and the bear trigger
- SUP 3: 128.09 Low Feb 2
- SUP 4: 127.23 Low Jan 16 and key support
The trend direction in USDJPY remains down and last week’s gains are considered corrective. However, the 50-day EMA has been tested, it intersects at 133.34 and represents a key S/T hurdle for bulls. A clear break, if seen, would alter the picture and suggest scope for a stronger recovery. This would open 133.77, a Fibonacci retracement. On the downside, the bear trigger is at 129.64, the Mar 24 low. A break would resume the downtrend.
EURJPY TECHS: Key Short-Term Resistance Remains Exposed
- RES 4: 147.75 High Oct 31
- RES 3: 147.10 High Nov 9 2022
- RES 2: 146.73 High Dec 15
- RES 1: 145.80 76.4% retracement of the Oct 21 - Jan 3 downleg
- PRICE: 144.12 @ 06:57 BST Apr 3
- SUP 1: 143.63 Intraday low
- SUP 2: 142.72 50-day EMA
- SUP 3: 141.79 Low Mar 29
- SUP 4: 141.05 Low Mar 28
EURJPY is trading closer to its recent highs. The cross has pierced key resistance at 145.57, the Mar 2 high. A clear break of this level would strengthen bullish conditions and pave the way for gains above 146.00, towards 146.73, the Dec 15 high. Momentum studies remain in a bull-mode set-up highlighting a likely uptrend. On the downside, initial firm support lies at 142.72, the 50-day EMA.
AUDUSD TECHS: Trend Condition Remains Bearish
- RES 4: 0.6865 High Feb 22
- RES 3: 0.6824 High Feb 24
- RES 2: 0.6784 High Mar 1
- RES 1: 0.6751 50-day EMA and a key resistance
- PRICE: 0.6679 @ 08:00 BST Apr 3
- SUP 1: 0.6625 Low Mar 24
- SUP 2: 0.6590 Low Mar 15
- SUP 3: 0.6565/47 Low Mar 10 / 61.8% of the Oct - Feb bull cycle
- SUP 4: 0.6500 Round number support
AUDUSD continues to consolidate. The trend condition is unchanged and remains bearish - recent gains, since Mar 10, still appear to be a correction. The 20-day EMA has been breached but resistance at the 50-day EMA remains intact. The average intersects at 0.6751. A clear breach of it would signal scope for a stronger short-term recovery. Key support and the bear trigger lies at 0.6565, the Mar 10 low.
USDCAD TECHS: Heading South
- RES 4: 1.3805/3862 High Mar 24 / 10 and the bull trigger
- RES 3: 1.3745 High Mar 27
- RES 2: 1.3695 High Mar 28
- RES 1: 1.3590/3637 50- and 20-day EMA values
- PRICE: 1.3512 @ 08:06 BST Apr 3
- SUP 1: 1.3442 Low Feb 20 / 21
- SUP 2: 1.3404 76.4% retracement of the Feb 2 - Mar 10 rally
- SUP 3: 1.3358 Low Feb 16
- SUP 4: 1.3334 Low Feb 15
The current bear cycle in USDCAD remains in play and the pair continues to weaken. Last week’s bearish extension resulted in a break of the 50-day EMA and 1.3562, the 50% retracement for the Feb 2 - Mar 10 rally. The move lower signals scope for a continuation lower and note that 1.3491, the 61.8% retracement, has been pierced. A clear break of this level would open 1.3442, the Feb 20 / 21 low. Initial firm resistance is seen at 1.3590, the 50-day EMA.
FIXED INCOME
BUND TECHS: (M3) Maintains A Softer Tone
- RES 4: 140.30 High Mar 20 and the bull trigger
- RES 3: 140.00 Round number resistance
- RES 2: 137.85/139.54 High Mar 27 / 24
- RES 1: 136.77 High Mar 30
- PRICE: 135.80 @ 05:17 BST Apr 3
- SUP 1: 134.70 Low Mar 31
- SUP 2: 134.15 61.8% retracement of the Mar 2 - 20 rally
- SUP 3: 133.33 Low Mar 15
- SUP 4: 132.70 76.4% retracement of the Mar 2 - 20 rally
Bund futures maintain a softer tone following last week’s move lower as the contract extended the pullback from 139.54, Mar 24 high. Price has breached a key support at the 20-day EMA which intersects at 135.56. It represents an important pivot level and the break strengthens a bearish threat. 134.80, the Mar 22 low, has been tested. A breach of this level would open 134.15, a Fibonacci retracement. Initial resistance is at 136.77, the Mar 30 high.
BOBL TECHS: (M3) Trading Closer To Its Recent Lows
- RES 4: 121.000 Round number resistance
- RES 3: 120.610 High Mar 20 and the bull trigger
- RES 2: 119.170/120.130 High Mar 27 / 24
- RES 1: 118.640 High Mar 30
- PRICE: 117.880 @ 05:39 BST Apr 3
- SUP 1: 117.280 Low Mar 30
- SUP 2: 116.982 61.8% retracement of the Mar 6 - 20 rally
- SUP 3: 116.370 Low Mar 15
- SUP 4: 116.125 76.4% retracement of the Mar 6 - 20 rally
Bobl futures are trading closer to recent lows and maintain a softer tone. An important pivot support has been breached at 117.773 which is the 20-day EMA. Additionally, support at 117.300, the Mar 22 low, has been pierced. A clear break of this level would strengthen current bearish conditions and open 116.982, a Fibonacci retracement. On the upside, initial resistance is seen at 118.640, the Mar 30 high.
SCHATZ TECHS: (M3) Trend Needles Points South
- RES 4: 107.110 High Dec 7 2022 (cont)
- RES 3: 106.955 High Mar 20 and key resistance
- RES 2: 106.315/695 High Mar 27 / 24
- RES 1: 106.095 High Mar 30
- PRICE: 105.690 @ 05:58 BST Apr 3
- SUP 1: 105.465 Low Mar 31
- SUP 2: 105.336 61.8% retracement of the Mar 9 - 20 rally
- SUP 3: 105.030 Low Mar 15
- SUP 4: 104.953 76.4% retracement of the Mar 9 - 20 rally
Schatz futures traded lower last week, breaching a key support at 105.713, the 20-day EMA. Price has also traded through support at 105.575, the Mar 22, where a clear break would strengthen a bearish threat and signal scope for a deeper pullback. This would open 105.336, a Fibonacci retracement. On the upside, key resistance and the bull trigger is at 106.955, the Mar 20 high. Initial resistance is seen at 106.095, last Thursday’s high.
GILT TECHS: (M3) Remains Vulnerable
- RES 4: 107.33 High Mar 20
- RES 3: 105.62 High Mar 27
- RES 2: 105.00 Round number resistance
- RES 1: 104.47 High Mar 30
- PRICE: 103.35 @ Close Mar 31
- SUP 1: 102.74 Low Mar 31
- SUP 2: 102.31 61.8% retracement of the Feb 28 - Mar 20 rally
- SUP 3: 102.00 Round number support
- SUP 4: 101.12 76.4% retracement of the Feb 28 - Mar 20 rally
Gilt futures traded lower again Friday and the contract maintains a bearish short-term tone. Last week’s move down resulted in a break of support at the 20-day EMA which intersects at 103.68. The average represents an important short-term support and the clear break signals scope for a continuation lower near-term, towards 102.31 next, a Fibonacci retracement On the upside, initial resistance is seen at 104.47, last Thursday’s intraday high.
BTP TECHS: (M3) Continues To Challenge Support At The 20-Day EMA
- RES 4: 118.18 High Feb 2 (cont)
- RES 3: 118.00 Round number resistance
- RES 2: 117.17 High Mar 24 and the bull trigger
- RES 1: 116.08 High Mar 30
- PRICE: 115.35 @ Close Apr 3
- SUP 1: 114.04 Low Mar 31
- SUP 2: 113.71 50.0% retracement of the Mar 2 - 24 rally
- SUP 3: 113.22 Low Mar 15
- SUP 4: 112.89 61.8% retracement of the Mar 2 - 24 rally
BTP futures continue to trade below 117.17, the Mar 24 high and the contract traded lower last week. The short-term outlook is bullish and the recent pullback still appears corrective. However, price has traded through support at 114.74, the 20-day EMA. A clear breach of this average would signal scope for a continuation lower and open 113.71, a Fibonacci retracement. Initial resistance is at 116.08, the Mar 30 high.
EQUITIES
EUROSTOXX50 TECHS: (M3) Pierces Key Resistance
- RES 4: 4381.50 High Jan 5
- RES 3: 4324.50 High Jan 13 2022 (cont)
- RES 2: 4300.00 Round number resistance
- RES 1: 4275.00 Intraday high
- PRICE: 4254.00 @ 09:55 BST Apr 3
- SUP 1: 4221.00 Low Mar 31
- SUP 2: 4146.30 20-day EMA
- SUP 3: 4083.00 Low Mar 27
- SUP 4: 4034.00 Low Mar 24
Eurostoxx 50 futures traded higher last week and the contract is holding on to its latest gains. The contract has pierced resistance at 4268.00, the Mar 6 high and a key resistance. A clear break of this hurdle would strengthen bullish conditions and open 4300.00 next. Moving average studies are in a bull-mode set-up and this highlights a broader uptrend. Initial firm support lies at 4146.30, the 20-day EMA.
E-MINI S&P (M3): Bull Cycle Remains In Play
- RES 4: 4223.00 High Feb 14
- RES 3: 4205.50 High Feb 16
- RES 2: 4148.48 76.4% retracement of the Feb 2 - Mar 13 downleg
- RES 1: 4142.50 High Mar 31
- PRICE: 4124.25 @ 07:01 BST Apr 3
- SUP 1: 4078.00 Low Mar 31
- SUP 2: 4027.87 50-day EMA
- SUP 3: 3980.75 Low Mar 28
- SUP 4: 3937.00 Low Mar 24
S&P E-minis ended last week on a bullish note and the contract is trading at its recent highs. Price has breached resistance at 4119.50, reinforcing the bullish conditions. The move higher exposes 4148.48, a Fibonacci retracement. Clearance of this level would signal scope for an extension towards 4205.50, the Feb 16 high ahead of 4244.00, the Feb 2 high and a key medium-term resistance. Firm support lies at 4027.87, the 50-day EMA.
COMMODITIES
BRENT TECHS: (M3) Gap Higher Reinforces Bullish Condition
- RES 4: $90.00 - Round number resistance
- RES 3: $88.35 - High Jan 23 and a key resistance
- RES 2: $87.87 - High Jan 27
- RES 1: $86.44 - Intraday high
- PRICE: $84.05 @ 05:41 BST Apr 4
- SUP 1: $82.57 - 23.6% retracement of the Mar 7 - Apr 3 uptrend
- SUP 2: $79.95 - High Mar 31 and gap low on the daily chart
- SUP 3: $78.25 - 50.0% retracement of the Mar 7 - Apr 3 uptrend
- SUP 4: $76.32 - 61.8% retracement of the Mar 7 - Apr 3 uptrend
Brent futures have gapped sharply higher at today’s open, touching a high of $86.44 - just above $86.17, the Mar 7 high. The move higher confirms an extension of the recent recovery that started from the Mar 20 low. A clear break of $86.17 would strengthen bullish conditions and signal scope for a climb towards $88.35, the Jan 23 high. A large gap has appeared on the daily chart - key support lies at $79.95, Friday’s high and the gap low.
WTI TECHS: (K3) Bull Cycle Extends
- RES 4: $81.04 - High Mar 7 and a key resistance
- RES 3: $78.17 - High Mar 9
- RES 2: $77.10 - 76.4% retracement of the Mar 7 - 20 downleg
- RES 1: $74.94 - 50-day EMA
- PRICE: $79.64 @ 06:02 BST Apr 3
- SUP 1: $77.60 - 23.6% retracement of the Mar 20 - Apr 3 rally
- SUP 2: $75.72 - High Mar 31 and a gap low on the daily chart
- SUP 3: $72.19 - Low Mar 28
- SUP 4: $70.98 - 61.8% retracement of the Mar 20 - Apr 3 rally
WTI futures remain in a bull cycle and today’s gap higher at the open, strengthens this current condition. The contract has touched a high of $81.69, just above resistance at $81.04, the Mar 7 high. A clear break of $81.04 would signal scope for a continuation higher and open $83.04, the Jan 23 high. Key support is seen at $75.72, the Mar 31 high and the gap low on the daily chart.
GOLD TECHS: Trend Condition Remains Bullish
- RES 4: $2070.4 - High Mar 8 and a key resistance
- RES 3: $2059.2 - High Mar 9 2022
- RES 2: $2034.0 - 2.00 proj of the Sep 28 - Oct 4 rally from Feb 28
- RES 1: $2009.7 - High Mar 20 and the bull trigger
- PRICE: $1952.2 @ 07:14 BST Apr 3
- SUP 1: $1936.7 - 20-day EMA
- SUP 2: $1918.3 - Low Mar 17
- SUP 3: $1896.4 - 50-day EMA
- SUP 4: $1871.6 - Low Mar 13
Trend conditions in Gold remain bullish and the recent short-term pullback is considered corrective. Note that price action since Mar 20 appears to be a pennant - a continuation pattern. This reinforces bullish conditions and signals scope for an extension higher near-term. The recent test above $2000.0 opens $2034.0 next, a Fibonacci projection. $1918.3 marks a firm support, the Mar 17 low - a break would signal scope for a deeper pullback.
SILVER TECHS: Uptrend Remains Intact
- RES 4: $25.293 - High Apr 20 2022
- RES 3: $24.729 - 76.4% retracement of the Mar - Sep 2022 bear leg
- RES 2: $24.637 - High Feb 2 and a key resistance
- RES 1: $24.166 - High Mar 31
- PRICE: $23.727 @ 08:14 BST Apr 3
- SUP 1: $22.828 - Low Mar 28
- SUP 2: $22.326 - 50-day EMA
- SUP 3: $21.474 - Low Mar 16
- SUP 4: $20.591 - Low Mar 13
Silver remains firm following last week’s gains. Short-term pullbacks are considered corrective and would allow an overbought condition to unwind. Recent gains signal scope for a climb towards $24.637, the Feb 2 high and the next key resistance. On the downside, initial firm support is seen at $22.828, the Mar 28 low, ahead of the 50-day EMA which intersects at $22.326.
Why MNI
MNI is the leading provider
of intelligence and analysis on the Global Fixed Income, Foreign Exchange and Energy markets. We use an innovative combination of real-time analysis, deep fundamental research and journalism to provide unique and actionable insights for traders and investors. Our "All signal, no noise" approach drives an intelligence service that is succinct and timely, which is highly regarded by our time constrained client base.Our Head Office is in London with offices in Chicago, Washington and Beijing, as well as an on the ground presence in other major financial centres across the world.