
Why MNI
MNI is the leading provider
of intelligence and analysis on the Global Fixed Income, Foreign Exchange and Energy markets. We use an innovative combination of real-time analysis, deep fundamental research and journalism to provide unique and actionable insights for traders and investors. Our "All signal, no noise" approach drives an intelligence service that is succinct and timely, which is highly regarded by our time constrained client base.Our Head Office is in London with offices in Chicago, Washington and Beijing, as well as an on the ground presence in other major financial centres across the world.
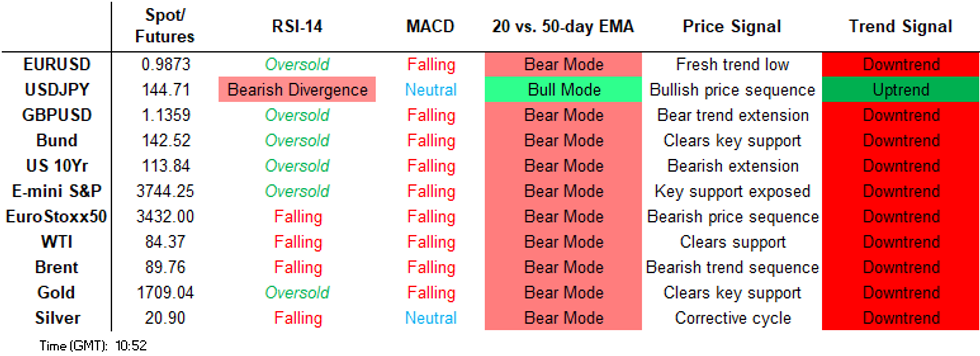
Price Signal Summary - Bullish Engulfing Candle In S&P E-Minis Highlights A Reversal
- In the equity space, S&P E-Minis are trading higher. Yesterday’s candle pattern is a bullish engulfing line and this highlights an important short-term reversal. It signals scope for a stronger corrective bounce and scope is seen for a climb towards the 20-day EMA at 3816.53. Key support has been defined at yesterday’s low of 3571.75. EUROSTOXX 50 futures have established a bullish short-term tone. The strong recovery this week suggests the contract has entered a corrective cycle. Attention is on resistance at the 20-day EMA, at 3476.10. It has been pierced, a clear break would open 3511.60, the 50-day EMA. Support is at 3236.00, the Oct 3 low.
- In FX, EURUSD maintains a firmer short-term tone as the correction extends. This suggests scope for a continuation higher near-term. Note too that the bounce from last Wednesday’s low means the channel base, at 0.9469, has provided support. The move higher opens the channel top at 1.0007. GBPUSD traded higher Monday, extending the latest recovery from 1.0350, Sep 26 low. The 20-day EMA has been cleared and this signals scope for an extension towards the 50-day EMA at 1.1576 - a key resistance. Initial support is seen at 1.1025, the Sep 30 low. USDJPY key support is 140.36, the Sep 22 low. Attention is on the bull trigger at 145.90, the Sep 22 high. A break would confirm a resumption of the uptrend and open 146.03, 2.764 projection of the Aug 2 - 8 - 11 price swing. Initial support is 143.10, the 20-day EMA.
- On the commodity front, Gold traded sharply higher yesterday and has established a short-term bull cycle. The yellow metal is trading above a trendline resistance, drawn from the Mar 8 high. The trendline intersects at $1697.7. Sights are on the 50-day EMA, at $1713.8, a break would open $1735.1, the Sep 12 high and a key short-term resistance. Initial support is at $1659.7, yesterday’s low. In the Oil space, WTI futures are trading closer to recent highs. The latest move higher has resulted in a print above the 20-day EMA. A continuation higher would expose a key resistance at the 50-day EMA. The average intersects at $87.12, where a break is required to signal scope for a stronger reversal. Initial support is at $79.14, the Sep 30 low. Key support lies at $76.25, the Sep 26 low.
- In the FI space, Bund futures remain in a downtrend, however, the contract has entered a short-term bullish corrective cycle. Yesterday’s strong rally reinforces this bullish theme and price has cleared the 20-day EMA. This opens 143.68, 38.2% retracement of the Aug 2 - Sep 28 bear leg. A strong rally last Wednesday in Gilt futures led to a short-term reversal and yesterday’s gains have reinforced the short-term bullish outlook. In pattern terms, the Sep 28 session was an engulfing candle and signals scope for a continuation higher near-term. Attention is on resistance at the 20-day EMA, at 101.49.
FOREIGN EXCHANGE
EURUSD TECHS: Corrective Cycle Still In Play
- RES 4: 1.0051 High Sep 20
- RES 3: 1.0007 Bear channel top drawn from the Feb 10 high
- RES 2: 0.9907 High Sep 22
- RES 1: 0.9896 Intraday high
- PRICE: 0.9875 @ 09:51 BST Oct 4
- SUP 1: 0.9735 Low Sep 30
- SUP 2: 0.9636/9536 Low Sep 29 / 28
- SUP 3: 0.9501 1.382 projection of the Aug 10 - Sep 6 - 12 price swing
- SUP 4: 0.9469 Bear channel base drawn from the Feb 10 high
EURUSD maintains a firmer short-term tone and is holding on to the bulk of its recent gains - a short-term correction. This suggests scope for a continuation higher near-term. Note too that the bounce from last Wednesday’s low means the channel base, at 0.9469, has provided support. The 20-day EMA, at 0.9861 has been breached. The move higher opens the channel top at 1.0007. A resumption of weakness would open 0.9536/9477.
GBPUSD TECHS: Rally Extends
- RES 4: 1.1738 High Sep 13 and a key resistance
- RES 3: 1.1576 50-day EMA
- RES 2: 1.1461 High Sep 20
- RES 1: 1.1429 Intraday high
- PRICE: 1.1380 @ 09:56 BST Oct 4
- SUP 1: 1.1025 Low Sep 30
- SUP 2: 1.0763 Low Sep 29
- SUP 3: 1.0541/0350 Low Sep 28 / All Time Low
- SUP 4: 1.0203 3.236 proj of the Jun 16 - Jul 14 - Aug 1 price swing
GBPUSD traded higher Monday and started the week on a bullish note, extending the latest recovery from 1.0350, Sep 26 low. The pair has cleared resistance at the 20-day EMA and this signals scope for a continuation higher near-term. The climb has opened 1.1364, the Sep 22 high while further out, potential is seen for an extension towards the 50-day EMA at 1.1576 - a key resistance. Initial support is seen at 1.1025, the Sep 30 low.
EURGBP TECHS: Approaching The 50-Day EMA
- RES 4: 0.9388 High Mar 23 2020
- RES 3: 0.9292 High Sep 11 2020
- RES 2: 0.9066/9266 High Sep 28 / High Sep 26 and key resistance
- RES 1: 0.8850 High Sep 30
- PRICE: 0.8675 @ 09:57 BST Oct 4
- SUP 1: 0.8650/49 50-day EMA / Intraday low
- SUP 2: 0.8626 Low Sep 1
- SUP 3: 0.8559 76.4% retracement of the Aug 2 - Sep 26 rally
- SUP 4: 0.8522 Low Aug 30
EURGBP continues to retrace recent gains and yesterday’s extension lower and break of the 20-day EMA, reinforces short-term bearish conditions. Attention is on the 50-day EMA that intersects at 0.8650 and represents a key near-term support. A clear break would signal scope for a deeper retracement. On the upside, initial firm resistance is seen at 0.8850, the Sep 30 high.
USDJPY TECHS: Consolidating Ahead Of The Bull Trigger
- RES 4: 146.52 1.236 proj of the May 24 - Jul 14 - Aug 2 price swing
- RES 3: 146.03 2.764 proj of the Aug 2 - 8 - 11 price swing
- RES 2: 145.90 High Sep 22 and the bull trigger
- RES 1: 145.30 High Oct 3
- PRICE: 144.84 @ 06:40 BST Oct 4
- SUP 1: 143.10/141.77 20-day EMA / Low Sep 23
- SUP 2: 140.36 Low Sep 22 and key short-term support
- SUP 3: 140.21 50-day EMA
- SUP 4: 139.39 High Jul 14 and a former key resistance
USDJPY is unchanged and remains in consolidation mode. The pair is holding on to the recovery from 140.36, the Sep 22 low and the key short-term support. The primary uptrend remains intact and sights are on the bull trigger at 145.90, Sep 22 high. A break would confirm a resumption of the trend and open 146.03, a Fibonacci projection. Clearance of 140.36 is required to highlight a top.
EURJPY TECHS: Bullish Outlook
- RES 4: 145.64 High Sep 12 and the bull trigger
- RES 3: 144.48 High High Sep 14
- RES 2: 143.70 76.4% retracement of the Sep 12 - 26 downleg
- RES 1: 143.12 Intraday high
- PRICE: 142.89 @ 10:01 BST Oct 4
- SUP 1: 141.10 20-day EMA
- SUP 2: 139.44/137.40 Low Sep 29 / 26 and key support
- SUP 3: 136.02 Low Aug 25
- SUP 4: 135.52 Low Aug 24
EURJPY is holding on to its latest gains and maintains a bullish short-term tone as the cross extends the recovery from 137.40, the Sep 26 low. Recent weakness between Sep 12 - 26 appears to have been a correction and if correct, the latest recovery signals the end of that cycle. The focus is on 143.70, a Fibonacci retracement and a break would open the key resistance at 145.64, Sep 12 high. Key support lies at 137.40.
AUDUSD TECHS: Bear Flag
- RES 4: 0.6770 50-day EMA
- RES 3: 0.6671 High Sep 22
- RES 2: 0.6621 20-day EMA
- RES 1: 0.6550 High Sep 26
- PRICE: 0.6496 @ 07:07 BST Oct 4
- SUP 1: 0.6363 Low Sep 28 and the bear trigger
- SUP 2: 0.6337 Low Apr 24 2020
- SUP 3: 0.6283 Low Apr 23 2020
- SUP 4: 0.6255 1.236 proj of the Apr 5 - May 12 - Jun 3 price swing
AUDUSD is consolidating and this pause in the downtrend appears to be a bear flag, reinforcing bearish trend conditions. The recent break of support at 0.6682, Jul 14 low and a bear trigger strengthened the bearish case and this maintains the broader downward price sequence of lower lows and lower highs. The focus is on 0.6337 next, the Apr 24 2020 low. Initial firm resistance has been defined at 0.6621, the 20-day EMA.
USDCAD TECHS: Pulls Back From Its Recent Highs
- RES 4: 1.4000 Psychological round number
- RES 3: 1.3970 3.236 proj of the Aug 25 - Sep 7 - 13 price swing
- RES 2: 1.3896 3.00 proj of the Aug 25 - Sep 7 - 13 price swing
- RES 1: 1.3838 High Sep 30 and the bull trigger
- PRICE: 1.3581 @ 08:39 BST Oct 4
- SUP 1: 1.3560 Low Sep 26
- SUP 2: 1.3443 20-day EMA
- SUP 3: 1.3358 Low Sep 21
- SUP 4: 1.3212 50-day EMA
USDCAD has pulled back from its recent highs. The move lower highlights a short-term reversal and potential for a deeper corrective pullback. This is seen as a long overdue retracement and is allowing an overbought reading in the trend to unwind. Attention is on the next firm support at 1.3443, the 20-day EMA. A break would strengthen bearish conditions. Key resistance and the bull trigger, has been defined at 1.3838, the Sep 30 high.
FIXED INCOME
BUND TECHS: (Z2) Corrective Cycle
- RES 4: 145.37 High Sep 8
- RES 3: 144.56 High Sep 12
- RES 2: 143.68 38.2% retracement of the Aug 2 - Sep 28 bear leg
- RES 1: 142.58 High Sep 20
- PRICE: 142.34 @ 09:52 BST Oct 4
- SUP 1: 138.05 Low Oct 3
- SUP 2: 135.52 Sep 28 low and key support
- SUP 3: 135.27 Low Mar 2012 (cont)
- SUP 4: 134.76 4.382 proj of the Aug 2 - 12 - 15 price swing
Bund futures remain in a downtrend, however, the contract has entered a short-term bullish corrective cycle. Yesterday’s strong rally reinforces this bullish theme and price has today cleared resistance around the 20-day EMA. The average intersects at 141.40 and the clear break signals scope for a stronger bounce. This opens 143.68, a Fibonacci retracement. Key support and the bear trigger has been defined at 135.52, the Sep 28 low.
BOBL TECHS: (Z2) Breaches The 20-Day EMA
- RES 4: 123.730 High Sep 6 and a key resistance
- RES 3: 123.270 High Sep 7
- RES 2: 122.510 High Sep 12
- RES 1: 122.010 High Sep 14
- PRICE: 121.670 @ 09:55 BST Oct 4
- SUP 1: 119.440 Low Oct 3
- SUP 2: 118.020 Low Sep 28 and the bear trigger
- SUP 3: 117.918 2.382 proj of the Aug 25 - Sep 1 - Sep 6 price swing
- SUP 4: 117.630 2.50 proj of the Aug 25 - Sep 1 - Sep 6 price swing
The trend direction in Bobl futures is unchanged and still points south. However, the short-term outlook is bullish following yesterday’s strong gains and the contract has entered a bullish corrective cycle. Price has breached the 20-day EMA and this signals scope for a continuation higher near-term. The focus is on 122.010, the Sep 14 high. Initial support is seen at yesterday’s low of 119.440.
SCHATZ TECHS: (Z2) Corrective Bounce Extends
- RES 4: 108.845 High Aug 25
- RES 3: 108.570 High Sep 6 and a key resistance
- RES 2: 108.010 High Sep 13
- RES 1: 107.760 High Sep 15
- PRICE: 107.685 @ 09:57 BST Oct 4
- SUP 1: 106.960 Low Sep 30
- SUP 2: 106.535 Low Sep 26 and key support
- SUP 3: 106.379 2.382 proj of the Aug 25 - Sep 1 - Sep 6 price swing
- SUP 4: 105.800 Low Nov 2008 (cont)
The Schatz futures trend direction remains down, however, the short-term outlook appears bullish and this was reinforced by yesterday’s strong rally. The move higher suggests the contract has entered a short-term corrective phase. Price has cleared resistance at the 20-day EMA and this opens 107.760, the Sep 15 high. Initial firm support is seen at 106.960, the Sep 30 low.
GILT TECHS: (Z2) Bullish Engulfing Candle Still In Play
- RES 4: 105.34 High Sep 22
- RES 3: 102.45 High Sep 23
- RES 2: 101.80 20-day EMA
- RES 1: 100.00 Round number resistance
- PRICE: 98.55 @ Close Oct 3
- SUP 1: 94.92 Low Sep 29
- SUP 2: 90.99 Low Sep 28 and the bear trigger
- SUP 3: 90.57 2.618 proj of the May 12 - Jun 16 - Aug 2 swing (cont)
- SUP 4: 90.00 Psychological round number
A strong rally last Wednesday in Gilt futures led to a short-term reversal and yesterday gains have reinforced the short-term bullish outlook. In pattern terms, the Sep 28 session was an engulfing candle. This pattern signals scope for a continuation higher near-term and attention is on resistance at the 20-day EMA, at 101.49. A break of this average would further strengthen a short-term bullish case. Initial support is seen at 94.92, the Sep 29 low.
BTP TECHS: (Z2) Correction Extends
- RES 4: 119.06 High Sep 8 and a key resistance
- RES 3: 118.51 High Sep 13
- RES 2: 117.05 High Sep 22
- RES 1: 116.57 Intraday high
- PRICE: 114.91 @ Close Oct 3
- SUP 1: 110.65 Low Sep 30
- SUP 2: 108.13 Low Sep 28 and key support
- SUP 3: 107.27 2.382 proj of the Aug 25 - Sep 1 - 8 price swing
- SUP 4: 106.68 2.618 proj of the Aug 25 - Sep 1 - 8 price swing
BTP futures trend conditions remain bearish, however, a short-term bull cycle has been established - this is likely a correction. Yesterday strong gains resulted in a print above the 20-day EMA. The move higher signals scope for an extension above the 115.00 handle. This would open 117.05, the Sep 22 high. On the downside, key support has been established at 108.13, the Sep 28 low. A break would resume the primary downtrend.
US 10YR FUTURE TECHS: (Z2) Correction Extends
- RES 4: 116-11 50.0% retracement of the Aug 2 - Sep 28 bear leg
- RES 3: 115-26 50-day EMA
- RES 2: 114-31+ 38.2% retracement of the Aug 2 - Sep 28 bear leg
- RES 1: 113-30 Intraday high
- PRICE: 113-23 @ 10:16 BST Oct 4
- SUP 1: 111-20+/110-19 Low Sep 29 / Low Sep 28
- SUP 2: 110-00 Psychological Support
- SUP 3: 109 08 3.0% 10-dma envelope
- SUP 4: 109-23+ Low Nov 30 20074 (cont)
Treasuries traded higher Monday and are holding on to recent gains. The contract has today pierced resistance at the 20-day EMA, which intersects at 113-27+. A clear break would signal scope for an extension of the current correction and open 114-31+, a Fibonacci retracement. The recovery from last week’s lows is considered corrective and is allowing an oversold trend condition to unwind. Initial support is at 111-20+, the Sep 29 low.
EQUITIES
EUROSTOXX50 TECHS: (Z2) Short-Term Reversal
- RES 4: 3692.00 High Aug 26
- RES 3: 3678.00 High Sep 13 and bull trigger
- RES 2: 3573.80 Trendline resistance drawn from the Aug 17 high
- RES 1: 3433.00/3511.60 Intraday high / 50-day EMA
- PRICE: 3429.00 @ 09:32 BST Oct 4
- SUP 1: 3236.00/3229.00 Low Oct 3 / Low Nov 9 2020 (cont)
- SUP 2: 3163.00 Low Nov 6 2020
- SUP 3: 3143.20 1.382 proj of the Aug 17 - Sep 5 - 13 price swing
- SUP 4: 3100.00 Round number support
EUROSTOXX 50 futures have established a bullish short-term tone following yesterday’ climb and today’s gains. The strong recovery suggests the contract has entered a corrective cycle and this is allowing an oversold trend condition to unwind. Attention is on resistance at the 20-day EMA, at 3476.10. It has been pierced, a clear break would signal scope for an extension and open 3511.60, the 50-day EMA. Support is at 3236.00.
E-MINI S&P (Z2): Bullish Engulfing Candle Highlights Reversal
- RES 4: 4234.25 High Aug 26
- RES 3: 3936.54/4175.00 50-day EMA / High Sep 13
- RES 2: 3816.53 20-day EMA
- RES 1: 3751.25 High Sep 28
- PRICE: 3741.00 @ 08:20 BST Oct 4
- SUP 1: 3571.75 Low Oct 3 and the bear trigger
- SUP 2: 3558.97 1.382 proj of the Aug 16 - Sep 7 - 13 price swing
- SUP 3: 3506.38 1.50 proj of the Aug 16 - Sep 7 - 13 price swing
- SUP 4: 3453.78 1.618 proj of the Aug 16 - Sep 7 - 13 price swing
S&P E-Minis are trading higher this morning and extending Monday’s reversal from the session low. Yesterday’s candle pattern is a bullish engulfing line and this highlights an important short-term reversal. If correct, it signals scope for a stronger corrective bounce and is allowing an oversold trend reading to unwind. Scope is seen for a climb towards the 20-day EMA at 3816.53. Key support has been defined at yesterday’s low of 3571.75.
COMMODITIES
BRENT TECHS: (Z2) Breaches The 20-Day EMA
- RES 4: $101.88 - High Jul 29 and key resistance
- RES 3: 95.54 - High Sep 5
- RES 2: $92.11 - 50-day EMA
- RES 1: $89.82 - High Oct 3
- PRICE: $89.41 @ 07:02 BST Oct 4
- SUP 1: $85.00/82.44 - Low Sep 30 / Low Sep 26 and the bear trigger
- SUP 2: $81.97 - 1.618 proj of the Jul 29 - Aug 5 - 30 price swing
- SUP 3: $80.22 - 1.764 proj of the Jul 29 - Aug 17 - 30 price swing
- SUP 4: $78.52 - Low Jan 24
Brent futures continue to trade closer to recent highs. Yesterday’s move higher resulted in a break of the 20-day EMA, strengthening a short-term bullish theme. The move through this resistance signals scope for a continuation higher and has opened the 50-day EMA, at $92.11. This average represents a key resistance and the latest recovery is considered corrective. Initial support is at $85.00, the Sep 30 low.
WTI TECHS: (X2) Short-Term Recovery Extends
- RES 4: $97.91 - High Jul 29 and a reversal trigger
- RES 3: $92.26/96.82 - High Aug 30 / 31 and key resistance
- RES 2: $87.26 - 50-day EMA
- RES 1: $83.31 - 20-day EMA
- PRICE: $84.02 @ 08:39 BST Oct 4
- SUP 1: $79.14/76.25 - Low Sep 30 / Low Sep 26 and the bear trigger
- SUP 2: $75.70 - Low Jan 24
- SUP 3: $71.22 - 2.00 proj of the Jul 29 - Aug 16 - 30 price swing
- SUP 4: $68.20 - 2.236 proj of the Jul 29 - Aug 16 - 30 price swing
WTI futures are trading closer to recent highs. The latest move higher has resulted in a print above the 20-day EMA. A continuation higher would expose a key resistance at the 50-day EMA. The average intersects at $87.12, where a break is required to signal scope for a stronger reversal. Gains are - for now - considered corrective. Initial support is at $79.14, the Sep 30 low. Key support lies at $76.25, the Sep 26 low.
GOLD TECHS: Trades Above Trendline Resistance
- RES 4: $1765.5 - High Aug 25
- RES 3: $1745.6 - High Sep 29
- RES 2: $1735.1 - High Sep 12 and a key resistance
- RES 1: $1713.8 - 50-day EMA
- PRICE: $1703.1 @ 07:21 BST Oct 4
- SUP 1: $1659.7 - Low Oct 3
- SUP 2: $1615.0 - Low Sep 28 and the bear trigger
- SUP 3: $1610.5 - 1.00 proj of the Jun 13 - Jul 21 - Aug 10 swing
- SUP 4: $1569.1 - Low Apr 1 2020
Gold traded sharply higher yesterday and has established a short-term bull cycle. The rally resulted in a break of the 20-day EMA and note that the yellow metal is trading above a trendline resistance, drawn from the Mar 8 high. The trendline intersects at $1697.7. Sights are on the 50-day EMA, at $1713.8, a break would open $1735.1, the Sep 12 high and a key short-term resistance. Initial support is at $1659.7, yesterday’s low.
SILVER TECHS: Bullish Price Sequence
- RES 4: $22.253 - 50.0% retracement of the Mar 8 - Sep 1 bear cycle
- RES 3: $21.967 - High Jun 17
- RES 2: $21.540 - High Jun 27
- RES 1: $21.146 - 38.2% retracement of the Mar 8 - Sep 1 bear cycle
- PRICE: $20.940 @ 09:02 BST Oct 4
- SUP 1: $19.377 - 50-day EMA
- SUP 2: $17.562 - Low Sep 1 and bear trigger
- SUP 3: $16.955 - Low Jun 15 2020
- SUP 4: $16.473 - 1.00 proj of the Jun 6 - Jul 14 - Aug 10 price swing
Silver bulls have returned and yesterday’s strong rally together with today’s follow through, reinforces a bullish theme. Price has cleared resistance at $20.014, the Sep 12 high. This confirms a short-term bullish price sequence of higher highs and higher lows - the definition of an uptrend. The focus is on $21.146, a Fibonacci retracement and $21.540 further out, the Jun 27 high. Initial firm support is at $19.377, the 50-day EMA.
Why MNI
MNI is the leading provider
of intelligence and analysis on the Global Fixed Income, Foreign Exchange and Energy markets. We use an innovative combination of real-time analysis, deep fundamental research and journalism to provide unique and actionable insights for traders and investors. Our "All signal, no noise" approach drives an intelligence service that is succinct and timely, which is highly regarded by our time constrained client base.Our Head Office is in London with offices in Chicago, Washington and Beijing, as well as an on the ground presence in other major financial centres across the world.