
Why MNI
MNI is the leading provider
of intelligence and analysis on the Global Fixed Income, Foreign Exchange and Energy markets. We use an innovative combination of real-time analysis, deep fundamental research and journalism to provide unique and actionable insights for traders and investors. Our "All signal, no noise" approach drives an intelligence service that is succinct and timely, which is highly regarded by our time constrained client base.Our Head Office is in London with offices in Chicago, Washington and Beijing, as well as an on the ground presence in other major financial centres across the world.
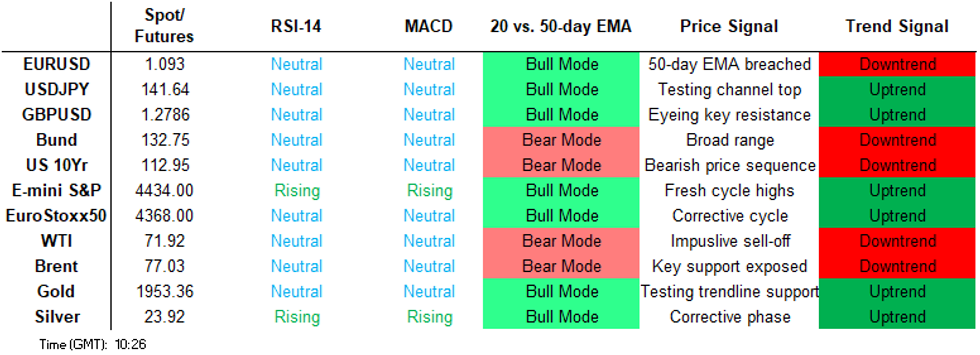
Price Signal Summary - S&P E-Minis Trend Needle Continues To Point North
- In the equity space, S&P E-Minis traded higher last week. This confirms a resumption of the uptrend and maintains the bullish price sequence of higher highs and higher lows, marking an extension of the bull cycle that started in October 2022. The focus is on 4494.20, the top of a bull channel drawn from the Oct 2022 low (cont). Initial support is at 4381.75, the Jun 13 low. A firmer support lies at 4332.90, the 20-day EMA. Pullbacks are considered corrective. EUROSTOXX 50 futures traded higher last week. Resistance at 4380.00, May 29 high, was cleared and key resistance at 4434.00, May 19 high, has been pierced. A clear break of this hurdle would represent an important bullish development and open 4448.00, Jan 2008 high (cont). MA studies remain in bull-mode condition highlighting an uptrend. Initial firm support to watch is 4303.00, Jun 7 low. The latest pullback is considered corrective.
- In FX, a bullish theme in EURUSD remains intact. The pair rallied sharply higher last week, extending the bull cycle that started at 1.0635 on May 31. This signals scope for an extension towards 1.0986, 76.4% of the Apr 26 - May 31 downleg. A break of this level would open 1.1054, the May 8 high. Initial firm support is last Thursday’s low of 1.0804. GBPUSD bulls remain in the driver’s seat and short-term pullbacks are considered corrective. The rally last week confirmed a clear break of 1.2680, the May 10 high and a bull trigger. This strengthens bullish conditions - 1.2680 was a key M/T hurdle for bulls and opens 1.2849,the 0.618 projection of the Mar 8 - May 10 - May 25 price swing. Moving average studies remain in a bull-mode condition reflecting current conditions. Initial firm support is at last Thursday’s 1.2630 low. USDJPY rallied Friday and has traded to a fresh trend high this week. Price has cleared 141.55, the top of a bull channel drawn from the Jan 16 high. The break reinforces bullish conditions and confirms a resumption of the uptrend. The focus is on 142.51 next,61.8% of the Oct 16 2022 - Jan 16 bear leg. Support to watch is at 139.66, the 20-day EMA.
- On the commodity front, the bear cycle in Gold remains intact. The yellow metal breached trendline support last week, drawn from the Nov 3 2022 low. The trendline intersects at $1971.2. The break of this line reinforces a bearish condition and marks a resumption of the downtrend. The focus is on $1903.5, 61.8% of the Feb 28 - May 4 bull cycle. Initial firm resistance is $1985.3, the May 24 high. Clearance of this resistance would signal a short-term reversal instead. In the oil space, WTI futures continue to trade below resistance at $75.06, the Jun 5 high and the outlook remains bearish, despite last week’s recovery. Support at $67.03, May 31 low, has recently been pierced, a clear break would open $63.90, May 4 low. Moving average studies are in a bear mode position highlighting a downtrend. A break of $75.06 would signal a reversal. S/T gains are considered corrective.
- In the FI space, Bund futures traded lower Monday. The contract maintains a softer tone and short-term gains are considered corrective. Resistance at 134.77, the Jun 12 high, remains intact. A break of this level is required to expose key short-term resistance at 135.85, the Jun 1 high. Support at 132.97, the Jun 8 low, was cleared last week and the break opens 132.12, the May 26 low and a bear trigger. Clearance of this level would strengthen bearish conditions. Gilt futures remain bearish and last week’s move lower reinforces current conditions. Yesterday’s bearish start to the week has confirmed a resumption of the downtrend. The contract has breached 94.21, the May 26 low and bear trigger. A continuation lower would open 93.45, the 1.618 projection of the Feb 2 - 28 - Mar 20 price swing (cont) . Initial firm resistance is at 95.36, the Jun 16 high.
FOREIGN EXCHANGE
EURUSD TECHS: Trend Needle Points North
- RES 4: 1.1185 High Mar 31 2022
- RES 3: 1.1095 High Apr 26 and key resistance
- RES 2: 1.1054 High May 8
- RES 1: 1.0986 61.8% retracement of the Apr 26 - May 31 downleg
- PRICE: 1.0915 @ 05:52 BST Jun 20
- SUP 1: 1.0864/1.0804 High Jun 14 / Low Jun 15
- SUP 2: 1.0818 20-day EMA
- SUP 3: 1.0733 Low Jun 12
- SUP 4: 1.0667/35 Low Jun 6 / Low May 31 and the bear trigger
A bullish theme in EURUSD remains intact. The pair rallied sharply higher last week, extending the bull cycle that started at 1.0635 on May 31. A number of important retracement points have been cleared, reinforcing bullish conditions and this signals scope for an extension towards 1.0986, 76.4% of the Apr 26 - May 31 downleg. A break of this level would open 1.1054, the May 8 high. Initial firm support is last Thursday’s low of 1.0804.
GBPUSD TECHS: Bull Cycle Still In Play
- RES 4: 1.3000 Round number resistance
- RES 3: 1.2977 0.764 proj of the Mar 8 - May 10 - May 25 price swing
- RES 2: 1.2877 High Apr 25 2022
- RES 1: 1.2849 0.618 proj of the Mar 8 - May 10 - May 25 price swing
- PRICE: 1.2776 @ 06:08 BST Jun 20
- SUP 1: 1.2680/30 High May 10 / Low Jun 15
- SUP 2: 1.2577/2483 20- and 50-day EMA values
- SUP 3: 1.2369 Low Jun 5 and a key support
- SUP 4: 1.2308 Low May 25 and the bear trigger
GBPUSD bulls remain in the driver’s seat and short-term pullbacks are considered corrective. The rally last week confirmed a clear break of 1.2680, the May 10 high and a bull trigger. This strengthens bullish conditions - 1.2680 was a key M/T hurdle for bulls and opens 1.2849, a Fibonacci projection. Moving average studies remain in a bull-mode condition reflecting current conditions. Initial firm support is at last Thursday’s 1.2630 low.
EURGBP TECHS: Trend Needle Points South
- RES 4: 0.8768 High May 5
- RES 3: 0.8719 High May 23
- RES 2: 0.8673 50-day EMA
- RES 1: 0.8602/8651 20-day EMA / High May 31
- PRICE: 0.8544 @ 06:45 BST Jun 20
- SUP 1: 0.8518 Low Jun 19
- SUP 2: 0.8482 1.0% 10-dma envelope
- SUP 3: 0.8454 76.4% retracement of the Mar - Sep 2022 bull cycle
- SUP 4: 0.8408 Low Aug 24 2023
The primary trend direction in EURGBP remains down and last Friday’s break lower confirms a resumption of the downtrend. Initial firm resistance is at 0.8602, the 20-day EMA. Moving average studies are in a bear-mode condition, highlighting a downtrend. The break of 0.8541, Jun 9 and 12 lows, opens 0.8482, a support based on a moving average envelope study and 0.8454, a Fibonacci retracement.
USDJPY TECHS: Heading North
- RES 4: 144.40 1.382 proj of the Jan 16 - Mar 8 - Mar 24 price swing
- RES 3: 142.84 1.236 proj of the Jan 16 - Mar 8 - Mar 24 price swing
- RES 2: 142.51 61.8% of the Oct 16 2022 - Jan 16 bear leg
- RES 1: 142.25 High Nov 21 2022 and intraday high
- PRICE: 142.11 @ 06:24 BST Jun 20
- SUP 1: 139.66/138.45 20-day EMA / Low Jun 1
- SUP 2: 137.43 Low May 19
- SUP 3: 137.71 50-day EMA
- SUP 4: 136.31 Low May 17
USDJPY rallied Friday and continues to climb. The pair has moved above 141.55, the top of a bull channel drawn from the Jan 16 high. The break reinforces bullish conditions and confirms a resumption of the uptrend, maintaining the bullish sequence of higher highs and higher lows. The focus is on 142.51 next, a Fibonacci retracement. Support to watch is at 139.66, the 20-day EMA. A break is required to signal a short-term top.
EURJPY TECHS: Northbound
- RES 4: 156.79 1.618 proj of the May 11 - 29 - 31 price swing
- RES 3: 156.23 2.00 proj of the Mar 20 - 21 - Apr 6 price swing
- RES 2: 155.59 1.382 proj of the May 11 - 29 - 31 price swing
- RES 1: 155.33 High Jun 19
- PRICE: 155.17 @ 07:11 BST Jun 20
- SUP 1: 153.09/151.61 Low Jun 16 / 15
- SUP 2: 151.09 20-day EMA
- SUP 3: 150.04 Low Jun 13
- SUP 4: 149.07 50-day EMA
EURJPY traded sharply higher last week and remains bullish. Price has cleared key resistance at 151.61, the May 2 high and an important bull trigger. This confirms a resumption of the longer-term uptrend and the focus is on a climb to 155.59 next, a Fibonacci projection. On the downside, initial firm support is seen at 151.09, the 20-day EMA. A break would signal a short-term top.
AUDUSD TECHS: Corrective Pullback
- RES 4: 0.7029 High Feb 14
- RES 3: 0.6993 76.4% retracement of the Feb - May downleg
- RES 2: 0.6921 High Feb 20
- RES 1: 0.6900 High Jun 16
- PRICE: 0.6800 @ 07:54 BST Jun 20
- SUP 1: 0.6768 High May 10 / Low Jun 15
- SUP 2: 0.6722 20-day EMA
- SUP 3: 0.6694 50-day EMA
- SUP 4: 0.6610 Low Jun 6
A strong rally last Thursday in AUDUSD reinforced bullish conditions and confirmed an extension of the bull cycle from May 31. The pair has cleared key resistance at 0.6818, May 10 high. This reinforces bullish conditions and opens 0.6921 next, the Feb 20 high. Further out, scope is seen for gains to 0.6993, a Fibonacci retracement. Initial firm support lies at 0.6768, the Jun 15 low. The latest outback is considered corrective.
USDCAD TECHS: Remains Vulnerable
- RES 4: 1.3585 High Jun 1
- RES 3: 1.3450 50-day EMA
- RES 2: 1.3375 20-day EMA
- RES 1: 1.3302/3355 Low Apr 14 / High Jun 15
- PRICE: 1.3236 @ 08:02 BST Jun 20
- SUP 1: 1.3175 Low Jun 19
- SUP 2: 1.3154 Low Sep 15 2022
- SUP 3: 1.3139 Low Sep 14 2022
- SUP 4: 1.2992 50.0% retracement of the Jun - Oct 2022 bull rally
USDCAD traded sharply lower last week, confirming a resumption of the downtrend. Support at 1.3262 has been cleared, the Feb 2 low. Price has also breached an important support at 1.3226, the Nov 15 2022 low. This strengthens the bearish condition and signals scope for a move towards 1.3154, the Sep 15 2022 low and 1.3139, the Sep 14 low of last year. On the upside, firm resistance is seen at 1.3375, the 20-day EMA.
FIXED INCOME
BUND TECHS: (U3) Bearish Theme Remains Intact
- RES 4: 136.50 High May 11
- RES 3: 135.85 High Jun 1 and key short-term resistance
- RES 2: 134.77/95 / High Jun 12 / 6
- RES 1: 133.69 20-day EMA
- PRICE: 132.64 @ 05:31 BST Jun 20
- SUP 1: 132.18 Low Jun 16
- SUP 2: 132.12 Low May 26 and key support
- SUP 3: 131.89 1.00 projection of the Jun 1 - 8 - 12 price swing
- SUP 4: 131.21 1.236 projection of the Jun 1 - 8 - 12 price swing
Bund futures traded lower Monday. The contract maintains a softer tone and short-term gains are considered corrective. Resistance at 134.77, the Jun 12 high, remains intact. A break of this level is required to expose key short-term resistance at 135.85, the Jun 1 high. Support at 132.97, the Jun 8 low, was cleared last week and the break opens 132.12, the May 26 low and a bear trigger. Clearance of this level would strengthen bearish conditions.
BOBL TECHS: (U3) Bear Threat Remains Present
- RES 4: 117.700 High Jun 1 and key short-term resistance
- RES 3: 117.200 High Jun 6
- RES 2: 116.990/117.010 High Jun 12 / 7
- RES 1: 116.040/433 High Jun 14 / 20-day EMA
- PRICE: 115.860 @ 05:14 BST Jun 19
- SUP 1: 115.380 Low Jun 15
- SUP 2: 115.198 1.236 projection of the Jun 1 - 8 - 12 price swing
- SUP 3: 115.986 1.382 projection of the Jun 1 - 8 - 12 price swing
- SUP 4: 114.815 1.50 projection of the Jun 1 - 8 - 12 price swing
Bobl futures maintain a softer tone and last week’s continuation lower reinforces bearish conditions. Price has moved through support at 116.250, the Jun 8 low and cleared key support at 115.870, the May 26 low. The break of this latter level strengthens bearish conditions and opens 115.198, a Fibonacci projection. On the upside, resistance to watch is 116.990, the Jun 12 high. A break would ease bearish pressure.
SCHATZ TECHS: (U3) Southbound
- RES 4: 105.875 High Jun 1 and key short-term resistance
- RES 3: 105.655/815 High Jun 6 / 4
- RES 2: 105.325/550 High Jun 14 / 12 and key near-term resistance
- RES 1: 105.185 High Jun 15
- PRICE: 104.965 @ 06:00 BST Jun 20
- SUP 1: 104.920 Low Jun 15
- SUP 2: 104.883 1.236 projection of the Jun 1 - 8 - 12 price swing
- SUP 3: 104.740 1.50 projection of the Jun 1 - 8 - 12 price swing
- SUP 4: 104.695 Low Mar 10 (cont)
Schatz futures traded lower last week and the move down resulted in a break of 105.330, the May 26 low and bear trigger. The move confirms a resumption of the downtrend and maintains a bearish price sequence of lower lows and lower highs. Sights are on 104.883, a Fibonacci projection. Note that moving average studies remain in a bear mode condition, highlighting a downtrend. Firm resistance is at 105.550, the Jun 12 high.
GILT TECHS: (U3) Clears Support
- RES 4: 97.64 High Jun 1 and the reversal trigger
- RES 3: 96.63/97.06 High Jun 9 / 6
- RES 2: 96.31 High Jun 12
- RES 1: 95.36 High Jun 16 and key near-term resistance
- PRICE: 93.95 @ Close Jun 19
- SUP 1: 93.91 Low Jun 20
- SUP 2: 93.45 1.618 proj of the Feb 2 - 28 - Mar 20 price swing (cont)
- SUP 3: 93.00 Round number support
- SUP 4: 92.66 Low Oct 14 2022 (cont)
Gilt futures remain bearish and last week’s move lower reinforces current conditions. Yesterday’s bearish start to the week has confirmed a resumption of the downtrend. The contract has breached support at 94.21, the May 26 low and bear trigger. A continuation lower would open 93.45, a Fibonacci projection. Moving average studies are in a bear mode position reflecting current sentiment. Initial firm resistance is at 95.36, the Jun 16 high.
BTP TECHS: (U3) Corrective Pullback
- RES 4: 118.41 1.00 projection of May 26 - Jun 2 - Jun 8 price swing
- RES 3: 118.18 High Feb 2 (cont)
- RES 2: 117.33 0.764 projection of May 26 - Jun 2 - Jun 8 price swing
- RES 1: 117.16 High Jun 16
- PRICE: 115.63 @ Close Jun 19
- SUP 1: 114.61 Low Jun 15
- SUP 2: 113.83 Low Jun 8 and key short-term support
- SUP 3: 112.48 Low May 29
- SUP 4: 111.78 Low May 26 and a key support
BTP futures traded to a fresh cycle high once again on Friday. The contract has recently cleared resistance at 116.36, the Jun 2 high and a short-term bull trigger. This confirms a resumption of the uptrend and signals scope for a climb towards 117.33, a Fibonacci projection. On the downside, key short-term support has been defined at 113.83, the Jun 8 low. A break would be bearish. Pullbacks for now, appear to be a correction.
US 10YR FUTURE TECHS: (U3) Bear Threat Remains Present
- RES 4: 115-19 High May 18
- RES 3: 115-00 High Jun 1 and a key resistance
- RES 2: 114-06+ / 114-23 High Jun 6 / 50-day EMA
- RES 1: 114-00 High Jun 13
- PRICE: 113-00 @ 18:11 BST Jun 16
- SUP 1: 112-12+ Low Jun 14
- SUP 2: 112-00 Low Mar 10
- SUP 3: 111-14+ Low Mar 9
- SUP 4: 110-27+ Low Mar 2 and key support
Treasury futures remain in a downtrend and last week’s move lower confirmed a resumption of the trend. Support at 112-29+, the May 26 / 30 low has been cleared. This signals scope for the 112-00 handle, the Mar 10 low. Further out, bearish price action suggests scope for a move towards 110-27+, the Mar 2 low and a key support. Short-term gains are considered corrective. Initial firm resistance is at 114-00, the Jun 13 high.
EQUITIES
EUROSTOXX50 TECHS: (U3) Trend Outlook Remains Bullish
- RES 4: 4489.00 1.50 proj of the May 31 - Jun 5 - 7 price swing
- RES 3: 4474.40 1.382 proj of the May 31 - Jun 5 - 7 price swing
- RES 2: 4448.00 High Jan 2008 (cont)
- RES 1: 4438.00 High Jun 16
- PRICE: 4378.00 @ 06:40 BST Jun 20
- SUP 1: 4356.90/4303.00 20-day EMA / Low Jun 7
- SUP 2: 4242.00 Low May 31 and the bear trigger
- SUP 3: 4200.00 Round number support
- SUP 4: 4150.00 Low Mar 29
Eurostoxx 50 futures traded higher last week. Resistance at 4380.00, May 29 high, was cleared and key resistance at 4434.00, May 19 high, has been pierced. A clear break of this hurdle would represent an important bullish development and open 4448.00, Jan 2008 high (cont). MA studies remain in bull-mode condition highlighting an uptrend. Initial firm support to watch is 4303.00, Jun 7 low. The latest pullback is considered corrective.
E-MINI S&P TECHS: (U3) Approaching The Top Of A Bull Channel
- RES 4: 4576.72 2.50 projection of the May 4 - 19 - 24 price swing
- RES 3: 4556.71 2.382 projection of the May 4 - 19 - 24 price swing
- RES 2: 4532.08 2.236 projection of the May 4 - 19 - 24 price swing
- RES 1: 4494.20 Bull channel top drawn from the Oct 2022 low (cont)
- PRICE: 4441.00 @ 07:13 BST Jun 20
- SUP 1: 4381.75/4332.90 Low Jun 13 / 20-day EMA
- SUP 2: 4250.15 50-day EMA
- SUP 3: 4154.75 Low May 24
- SUP 4: 4098.25 Low May 4 and a key support
S&P E-minis traded higher last week. This confirms a resumption of the uptrend and maintains the bullish price sequence of higher highs and higher lows, marking an extension of the bull cycle that started in October 2022. The focus is on 4494.20, the top of a bull channel drawn from the Oct 2022 low (cont). Initial support is at 4381.75, the Jun 13 low. A firmer support lies at 4332.90, the 20-day EMA. Pullbacks are considered corrective.
COMMODITIES
BRENT TECHS: (Q3) Bear Threat Remains Present
- RES 4: $84.56 - High Apr 18
- RES 3: $82.47 - High Apr 25
- RES 2: $80.08 - High Apr 28
- RES 1: $76.93/78.73 - High Jun 19 / High Jun 5 and a bull trigger
- PRICE: $75.87 @ 07:04 BST Jun 20
- SUP 1: $71.50 - Low May 31
- SUP 2: $71.20 - Low May 4
- SUP 3: $70.06 - Low Mar 20 and a key support
- SUP 4: $69.28 - Low Dec 20 2021 (cont)
A bear threat in Brent futures remains present despite last week’s gains and the contract continues to trade below $78.73, the Jun 5 high. Scope is seen for a move towards $71.20, the May 4 low, ahead of $70.06, the Mar 20 low. Moving average studies remain in a bear mode position and this highlights a downtrend. On the upside, clearance of $78.73 would alter the picture. For now, short-term gains are considered corrective.
WTI TECHS: (N3) Bearish Outlook
- RES 4: $80.93 - High Apr 19
- RES 3: $79.00 - High Apr 24
- RES 2: $76.74 - High Apr 28
- RES 1: $72.56/75.06 - 50-day EMA / High Jun 5 and a key resistance
- PRICE: $70.76 @ 06:30 BST Jun 20
- SUP 1: $66.80 - Low Jun 12
- SUP 2: $63.90 - Low May 4 and key support
- SUP 3: $62.43 - Low Dec 2 2021 (cont)
- SUP 4: $60.00 - Psychological round number
WTI futures continue to trade below resistance at $75.06, the Jun 5 high and the outlook remains bearish, despite last week’s recovery. The pullback from $75.06 reinforces a bearish theme. Support at $67.03, May 31 low, has recently been pierced, a clear break would open $63.90, May 4 low. Moving average studies are in a bear mode position highlighting a downtrend. A break of $75.06 would signal a reversal. S/T gains are considered corrective.
GOLD TECHS: Bearish Theme Still In Play
- RES 4: $2070.4 - High Mar 8 and a bull trigger
- RES 3: $2063.0 - High May 4
- RES 2: $2022.6 - High May 12
- RES 1: $1985.3 - High May 24 and key short-term resistance
- PRICE: $1950.9 @ 07:18 BST Jun 20
- SUP 1: $1925.1 - Low Jun 15
- SUP 2: $1903.5 - 61.8% retracement of the Feb 28 - May 4 bull cycle
- SUP 3: $1885.8 - Low Mar 15
- SUP 4: $1865.8 - 76.4% retracement of the Feb 28 - May 4 bull cycle
The bear cycle in Gold remains intact. The yellow metal breached trendline support last week, drawn from the Nov 3 2022 low. The trendline intersects at $1971.2. The break of this line reinforces a bearish condition and marks a resumption of the downtrend. The focus is on $1903.5, 61.8% of the Feb 28 - May 4 bull cycle. Initial firm resistance is $1985.3, the May 24 high. Clearance of this resistance would signal a short-term reversal instead.
SILVER TECHS: Resistance Still Intact
- RES 4: $26.771 - High Mar 9 2022
- RES 3: $26.222 - High Apr 18 2022 and a key resistance
- RES 2: $25.477/26.135 - High May 11 / 5 and bull trigger
- RES 1: $24.492/530 - Low Apr 25 and double midpoint / High Jun 12
- PRICE: $23.901 @ 08:09 BST Jun 20
- SUP 1: $22.221/682 - Low Jun 15 / Low May 26 and bear trigger
- SUP 2: $22.284 - 61.8% retracement of the Mar 10 - May 5 rally
- SUP 3: $22.157 - Low Mar 21
- SUP 4: $21.375 - 76.4% retracement of the Mar 10 - May 5 rally
Silver remains below its recent high of $24.5300 on Jun 12. The latest pullback means that resistance at $24.492 stays intact for now, the midpoint of a double top reversal pattern confirmed on May 11, and signals the end of the recent May 26 - Jun 9 corrective rally. The trend outlook is bearish and the focus is on a move towards key support and the bear trigger at $22.682, the May 26 low. A break of 24.530, Jun 12 high, would alter the picture.
Why MNI
MNI is the leading provider
of intelligence and analysis on the Global Fixed Income, Foreign Exchange and Energy markets. We use an innovative combination of real-time analysis, deep fundamental research and journalism to provide unique and actionable insights for traders and investors. Our "All signal, no noise" approach drives an intelligence service that is succinct and timely, which is highly regarded by our time constrained client base.Our Head Office is in London with offices in Chicago, Washington and Beijing, as well as an on the ground presence in other major financial centres across the world.