
Why MNI
MNI is the leading provider
of intelligence and analysis on the Global Fixed Income, Foreign Exchange and Energy markets. We use an innovative combination of real-time analysis, deep fundamental research and journalism to provide unique and actionable insights for traders and investors. Our "All signal, no noise" approach drives an intelligence service that is succinct and timely, which is highly regarded by our time constrained client base.Our Head Office is in London with offices in Chicago, Washington and Beijing, as well as an on the ground presence in other major financial centres across the world.
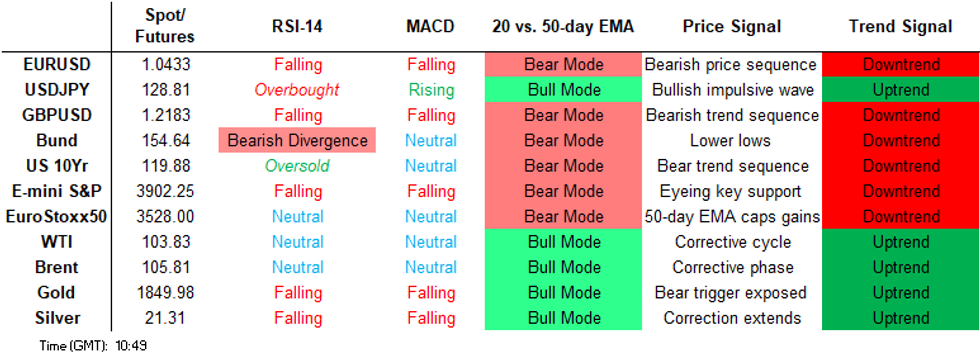
Price Signal Summary - USD Resumes Its Uptrend
- In the equity space, S&P E-Minis remain vulnerable and are trading lower again today. Last week’s sharp reversal from 4303.00, the May 4 high, reinforced bearish conditions, and this week’s move lower resulted in a break of support at 4056.00, the May 2 low. The focus is on 3892.98 2.23 projection of the Mar 29 - Apr 18 - 21 price swing. EUROSTOXX 50 futures outlook remains bearish. Recent weakness has resulted in a breach of support at 3608.00, Apr 27 low and of 3551.60, 61.8% retracement of the Mar 7 - 29 rally. This has exposed 3458.90 next, the 76.4% retracement. Initial resistance is at 3672.10, the 20-day EMA.
- In FX, EURUSD has traded lower this morning and cleared support at 1.0472, Apr 28 low. The break lower confirms a bear flag breakout and a resumption of the primary downtrend. The focus is on 1.0390 next, the Jan 4 2017 low. Key resistance has been defined at 1.0642, the May 5 high. GBPUSD is softer as the pair trades to fresh cycle lows. This marks an extension of the sharp sell-off on May 5, that confirmed a resumption of the downtrend. The move lower opens 1.2162 next, the May 22 2020 low. Initial resistance is seen at 1.2406, high May 9. The USDJPY primary uptrend remains intact and resistance at 131.25, the Apr 28 high, was probed Monday. Attention is on 131.96, the 1.00 projection of the Feb 24 - Mar 28 - 31 price swing. Key support has been defined at 126.95, Apr 27 low. Initial support at 128.58 has been probed - S/T dips are considered corrective.
- On the commodity front, Gold remains vulnerable and this week’s move lower confirms a resumption of the current downtrend. The break of $1848.8, 76.4% of the Jan 28 - Mar 8 rally, paves the way for a move towards $1821.1 next, the Feb 11 low. Sights are also set on $1780.4, the Jan 28 low. In the Oil space, WTI futures reversed course Monday and traded lower on Tuesday. Last week’s break of triangle resistance, drawn from the Mar 15 low, highlighted a bullish development. However the recent sell-off suggests the bullish break was a false one. This threatens the recent recovery and exposes support at $95.28, Apr 25 low.
- In the FI, Bund futures remain in a downtrend. This week’s gains are considered corrective. A fresh cycle low on Monday reinforced the bearish condition and confirmed, once again, an extension of the bearish price sequence of lower lows and lower highs. A resumption of weakness would refocus attention on 150.15, the 0.764 projection of the Mar 7 - 29 - Apr 4 price swing. Firm trend resistance is at 156.00, Apr 28 high. The broader trend condition in Gilts remains down. However, today’s move higher has resulted in a break of resistance at 119.79, the Apr 25 high. This signals potential for a stronger short-term corrective phase and opens 120.67 next, a Fibonacci retracement. On the downside, key support has been defined at 116.87, the May 9 low. This is also the bear trigger.
FOREIGN EXCHANGE
EURUSD TECHS: Bear Flag Breakout
- RES 4: 1.0852 High Apr 22
- RES 3: 1.0758 Low Apr 14 and a recent breakout level
- RES 2: 1.0642/43 High May 5 / 20-day EMA
- RES 1: 1.0529 Intraday high
- PRICE: 1.0434 @ 10:06 BST May 12
- SUP 1: 1.0423 Intraday low
- SUP 2: 1.0390 Low Jan 4 2017
- SUP 3: 1.0341 Low Jan 3 2017 and a key support
- SUP 4: 1.0333 1.236 proj of the Feb 10 - Mar 7 - 31 price swing
EURUSD has traded lower this morning and cleared support at 1.0472. The break lower confirms a bear flag breakout and a resumption of the primary downtrend. This also maintains the bearish price sequence of lower lows and lower highs. Moving average studies remain in a bear mode set-up, highlighting current market sentiment. The focus is on 1.0390 next, the Jan 4 2017 low. Key resistance has been defined at 1.0642, the May 5 high.
GBPUSD TECHS: Bear Trend Extension
- RES 4: 1.2877 High Apr 25
- RES 3: 1.2772 High Apr 26
- RES 2: 1.2638 High May 4 and a key resistance
- RES 1: 1.2406/2599 High May 9 / 20-day EMA
- PRICE: 1.21.89 @ 10:10 BST May 12
- SUP 1: 1.2162 Low May 22 2020
- SUP 2: 1.2081 76.4% retracement of the Mar ‘20 - Jun ‘21 uptrend
- SUP 3: 1.2000 psychological round number
- SUP 4: 1.1903 1.00 proj of the Apr 14 - 28 - May 4 price swing
GBPUSD is softer as the pair trades to fresh cycle lows. This marks an extension of the sharp sell-off on May 5, that confirmed a resumption of the downtrend. The move lower maintains the bearish price sequence of lower lows and lower highs and note that moving average studies are in a bear mode condition. The focus is on 1.2162 next, the May 22 2020 low. Initial resistance is seen at 1.2406, high May 9.
EURGBP TECHS: Resumes Its Uptrend
- RES 4: 0.8670 High Jul 20 2021
- RES 3: 0.8652/58 2.0% 10-dma envelope / High Sep 29 2021
- RES 3: 0.8643 High Sep 30 2021
- RES 1: 0.8617 Intraday high
- PRICE: 0.8610 @ 06:37 BST May 12
- SUP 1: 0.8509 Low May 6
- SUP 2: 0.8468 High Apr 27 and a recent breakout level
- SUP 3: 0.8406/8367 50-day EMA / Low May 2
- SUP 4: 0.8313 Low Apr 22
EURGBP has traded higher today and these gains have confirmed a resumption of its uptrend. The break above 0.8600, paves the way for a climb towards 0.8624, the Oct 1 2021 high and 0.8652, the top of a moving average envelope. Moving average studies highlight a bull set-up and this clearly reflects the current trend direction. Initial firm support is seen at 0.8509, the May 6 low.
USDJPY TECHS: Corrective Pullback
- RES 4: 133.11 High Apr 4 2002
- RES 3: 132.39 High Apr 15 2002
- RES 2: 131.96 1.00 proj of the Feb 24 - Mar 28 - 31 price swing
- RES 1: 131.35 High May 9 and the bull trigger
- PRICE: 128.58 @ 10:13 BST May 12
- SUP 1: 128.41 Intraday low
- SUP 2: 126.95 Low Apr 27 and a key support
- SUP 3: 125.09 Low Apr 14
- SUP 4: 124.01 Low Apr 11
The USDJPY outlook is bullish. The pair probed resistance at 131.25 on Monday, the Apr 28 high. A clear break of this level would confirm a resumption of the uptrend and open 131.96, a Fibonacci projection. A move higher would also maintain a bullish price sequence of higher highs and higher lows. Key support has been defined at 126.95, Apr 27 low. Initial support at 128.58 has been probed - S/T dips are considered corrective.
EURJPY TECHS: Clears Key Supports
- RES 4: 141.06 High Jun 4 2015 and a key resistance
- RES 3: 140.87 0.50 proj of the Mar 7 - 28 - Apr 5 price swing
- RES 2: 138.32/140.00 High May 9 / High Apr 21 and the bull trigger
- RES 1: 136.75 Intraday high
- PRICE: 134.28 @ 10:20 BST May 12
- SUP 1: 134.02 Intraday low
- SUP 2: 133.15 High Feb 10
- SUP 3: 132.95 Low Mar 24
- SUP 4: 132.20 50% retracement of the Mar 7 - Apr 21 bull phase
EURJPY is weaker today. The move lower marks an extension of the reversal that started Apr 21. The cross has breached a number of important short-term support levels - price is through the 50-day EMA, at 135-06, and through 134.30, the Apr 5 low and a bear trigger. An extension lower would signal scope for a deeper retracement towards 133.15 initially, the Feb 10 high. Initial resistance is at today’s 136.75 intraday high.
AUDUSD TECHS: Fresh Cycle Low
- RES 4: 0.7266 High May 4/5 and key resistance
- RES 3: 0.7245 50-day EMA
- RES 2: 0.7135 Low May 6
- RES 1: 0.7054 High May 11
- PRICE: 0.6876 @ 07:02 BST May 12
- SUP 1: 0.6833 Low Jun 30 2020
- SUP 2: 0.6805 Low Jun 22 2020
- SUP 3: 0.6784 0.764 proj of the Apr 5 - May 2 - 4 price swing
- SUP 4: 0.6759 50.0% retracement of the Mar ‘20 - Feb ‘21 upleg
AUDUSD maintains a bearish tone and has once again resumed its downtrend. The move lower marks an extension of the reversal last week from 0.7266, the May 4/5 high. Moving average studies are in a bear mode too, highlighting current sentiment. Support at 0.6968, the Jan 28 low and a bear trigger, has been breached. This opens 0.6833 next, the Jun 30 2020 low. Initial resistance is at yesterday’s high of 0.7054.
USDCAD TECHS: Trading At This Week’s Highs
- RES 4: 1.3173 High Nov 13 2020
- RES 3: 1.3144 2.0% 10-dma envelope
- RES 2: 1.3091 High Nov 24 2020
- RES 1: 1.3052 High May 10
- PRICE: 1.3024 @ 07:06 BST May 12
- SUP 1: 1.2914/2814 High May 2 / Low May 6
- SUP 2: 1.2725/14 50-day EMA / Low May 5 and a key support
- SUP 3: 1.2568 Low Apr 22
- SUP 4: 1.2459 Low Apr 21
USDCAD is trading at this week’s highs. Recent gains have resulted in a breach of 1.2914, May 2 high, and key resistance at 1.2964, the Dec 20 2021 high. The break of the latter level marks an important medium-term bullish technical development and reinforces the broader bullish outlook. This has opened 1.3144 next, the upper band of a moving average envelope. Initial support is seen at 1.2914. Key support lies at 1.2714, the Apr 29 low.
FIXED INCOME
BUND TECHS: (M2) Corrective Bounce Extends
- RES 4: 157.87 High Apr 7
- RES 3: 157.15 50-day EMA
- RES 2: 156.00 High Apr 28 and a key short-term resistance
- RES 1: 154.79 Intraday high
- PRICE: 154.67 @ 09:16 BST May 12
- SUP 1: 151.87/150.49 Low May 11 / Low May 9
- SUP 2: 150.15 0.764 proj of the Mar 7 - 29 - Apr 4 price swing
- SUP 3: 150.00 Psychological round number
- SUP 4: 149.49 Low Jul 13 2015 (cont)
Trend signals in Bund futures are unchanged and the outlook is bearish. This week’s gains are considered corrective. A fresh cycle low on Monday reinforced the bearish condition and confirmed, once again, an extension of the bearish price sequence of lower lows and lower highs. Moving average studies remain in a bear mode. Attention is on 150.15 next, a Fibonacci projection. Firm trend resistance is at 156.00, the Apr 28 high.
BOBL TECHS: (M2) Trades Above Its 20-Day EMA As A Correction Extends
- RES 4: 129.350 High Apr 4 and a reversal point
- RES 3: 128.830 High Apr 7
- RES 2: 128.310 High Apr 14/28 and a key near-term resistance
- RES 1: 128.10 Intraday high
- PRICE: 127.560 @ 05:07 BST May 12
- SUP 1: 126.770/126.010 Low May 11 / Low May 6 and a bear trigger
- SUP 2: 126.00 Round number support
- SUP 3: 125.450 0.618 proj of the Mar 7 - 29 - Apr 4 price swing
- SUP 4: 125.260 Low Apr 24 20014 (cont)
Bobl futures are trading above recent lows. The contract is holding onto this week’s gains and price has traded above the 20-day EMA. Gains however are considered corrective. Fresh cycle lows last week reinforced the primary downtrend and maintained the bearish price sequence of lower lows and lower highs. Moving average studies continue to point south, highlighting current sentiment. Key S/T trend resistance is at 128.310, the Apr 14/28 high.
SCHATZ TECHS: (M2) Corrective Cycle Still In Play
- RES 4: 111.000 Round number resistance
- RES 3: 110.855 High Apr 4
- RES 2: 110.718 50-day EMA
- RES 1: 110.595 Intraday high
- PRICE: 110.585 @ 09:20 BST May 12
- SUP 1: 110.210/109.980 Low May 10 / Low May 6 and bear trigger
- SUP 2: 109.777 0.618 proj of the Mar 7 - 30 - Apr 4 price swing
- SUP 3: 109.555 Low Oct 31 2011 (cont)
- SUP 4: 109.340 Low Oct 28 011 (cont)
The trend direction in Schatz futures remains down and recent short-term gains are considered corrective. The contract has traded above its 20-day EMA and the extension higher today has resulted in a break of 110.540, the Apr 28 high and a key resistance. This opens 110.718 next, the 50-day EMA. A resumption of weakness would refocus attention on the bear trigger at 109.980, May 6 low. A break would confirm a resumption of the downtrend.
GILT TECHS: (M2) Trades Above Key S/T Resistance
- RES 4: 122.35 High Apr 4
- RES 3: 121.84 50.0% retracement of the Mar 1 - May 9 bear leg
- RES 2: 120.96 High Apr 6
- RES 1: 120.67 38.2% retracement of the Mar 1 - May 9 bear leg
- PRICE: 120.21 @ 09:30 BST May 12
- SUP 1: 118.25/116.87 Low May 11 / Low May 9 and the bear trigger
- SUP 2: 116.35 Low Dec 30 2015 (cont)
- SUP 3: 115.40 1.00 proj of the Mar 1 - 28 - Apr 4 price swing
- SUP 4: 115.00 Round number support
The trend direction in Gilt futures remains down and gains are considered corrective. Today’s move higher has resulted in a break of resistance at 119.79, the Apr 25 high. This signals potential for a stronger short-term corrective phase and opens 120.67 next, a Fibonacci retracement. On the downside, key support has been defined at 116.87, the May 9 low. This is also the bear trigger.
BTP TECHS: (M2) Trades Through Trendline Resistance
- RES 4: 135.23 High Apr 14
- RES 3: 134.70 50-day EMA
- RES 2: 133.53 High Apr 28
- RES 1: 131.61 High Apr 29
- PRICE: 130.85 @ 09:42 BST May 12
- SUP 1: 127.24/125.54 Low May 11 / Low May 9 and the bear trigger
- SUP 2: 125.02 1.236 proj of the Mar 1 - 29 - 31 price swing
- SUP 3: 124.02 Low Mar 18 2020 (cont) and a major support
- SUP 4: 123.41 1.382 proj of the of the Mar 1 - 29 - 31 price swing
The trend condition in BTP futures is unchanged and the outlook remains bearish - a fresh cycle low print on Monday reinforced this theme. Over the short-term however, a corrective (bullish) cycle has been established and the contract has traded above a trendline resistance drawn from the Mar 1 high. Price is also above the 20-day EMA. This signals scope for a move towards 133.53, Apr 28 high. Key support has been defined at 125.54, the May 9 low.
EQUITIES
EUROSTOXX50 TECHS: (M2) Outlook Remains Bearish
- RES 4: 3944.00 High Mar 29 and a key resistance
- RES 3: 3883.00 High Apr 21
- RES 2: 3775.00 High May 5
- RES 1: 3672.10 20-day EMA
- PRICE: 3540.00 @ 05:41 BST May 12
- SUP 1: 3466.00 Low May 10
- SUP 2: 3458.90 76.4% retracement of the Mar 7 - 29 rally
- SUP 3: 3400.00 Round number support
- SUP 4: 3309.00 Low Mar 7 and a major support
EUROSTOXX 50 futures remain in a bear mode and short-term gains are considered corrective. The contract has cleared former support at 3608.00, Apr 27 low, highlighting a resumption of the current bear cycle. This opens 3458.90, a Fibonacci retracement. A break of this level would clear the path for 3309.00, Mar 7 low and a major support. Firm resistance has been defined at 3775.00, May 5 high. A break would alter the picture.
E-MINI S&P (M2): Heading South
- RES 4: 4509.00 High Apr 21 and a key short-term resistance
- RES 3: 4393.25 High Apr 22
- RES 2: 4328.66 50-day EMA
- RES 1: 4099.00/4303.50 High May 9 / High Apr 26/28
- PRICE: 3912.75 @ 07:00 BST May 12
- SUP 1: 3892.98 2.23 proj of the Mar 29 - Apr 18 - 21 price swing
- SUP 2: 3843.25 Low Mar 25 2021 (cont)
- SUP 3: 3820.25 2.50 proj of the Mar 29 - Apr 18 - 21 price swing
- SUP 4: 3787.74 2.618 proj of the Mar 29 - Apr 18 - 21 price swing
S&P E-Minis remain vulnerable following last week’s sharp reversal from 4303.00, May 4 high, and this week’s extension of the downtrend. Monday’s move lower resulted in a breach of support at 4056.00, May 2 low. A clear break of this support confirms a resumption of the underlying downtrend and opens 3892.98 next, a Fibonacci projection. On the upside, key resistance has been defined at 4303.50, the Apr 26/28 high.
COMMODITIES
BRENT TECHS: (N2) Remains Vulnerable
- RES 4: $123.44 - High Mar 8
- RES 3: $121.13 - 76.4% retracement of the Mar 7 - 15 downleg
- RES 2: $115.76 - High Mar 24 and a bull trigger
- RES 1: $108.29/114.00 - High May 11 / High May 5
- PRICE: $105.57 @ 08:04 BST May 12
- SUP 1: $101.30 - Low May 11
- SUP 2: $99.25 - Low Apr 25 and a key near-term support
- SUP 3: $97.18 - Low Apr 11
- SUP 4: $92.59 - Low Mar 15 and a bear trigger
The Brent futures outlook remains bearish. The contract has failed to hold on to its recent highs. Last week’s bullish break of triangle resistance, drawn from the Mar 15 low, appears to have been a false break. This threatens the recent recovery and exposes support at $99.25, Apr 25 low. A break would strengthen a bearish case and confirm a bearish triangle breakout instead. Key resistance is at $114.00, May 5 high.
WTI TECHS: (M2) Bearish Risk Remains Present
- RES 4: $119.95 - High Mar 8
- RES 3: $118.13 - High Mar 9
- RES 2: $113.51/113.90 - High Mar 24 / 76.4% of Mar 7 - 15 downleg
- RES 1: $106.44/111.37 - High May 11 / High May 5
- PRICE: $104.27 @ 07:12 BST May 12
- SUP 1: $98.20 - Low May 11
- SUP 2: $95.28 - Low Apr 25 and a key near-term support
- SUP 3: $92.60 - Low Apr 11 and a key support
- SUP 4: $90.37 - Low Mar 15 and a bear trigger
A bearish threat in WTI futures remains present. Last week’s break of triangle resistance, drawn from the Mar 15 low, highlighted a bullish development. However the sell-off this week suggests the break was likely a false one. This threatens the recent recovery and instead exposes support at $95.28, Apr 25 low. A break would strengthen a bearish case and confirm a bearish triangle breakout instead. Key resistance is at $111.37, the May 5 high.
GOLD TECHS: Downtrend Remains Intact
- RES 4: $1998.4 - High Apr 18 and a bull trigger
- RES 3: $1958.4 - High Apr 20
- RES 2: $1909.8/1919.9 - High May 5 / High Apr 29
- RES 1: $1865.4 - High May 10
- PRICE: $1849.5 @ 07:18 BST May 12
- SUP 1: $1832.1 - Low May 11
- SUP 2: $1821.1 - Low Feb 11
- SUP 3: $1780.4 - Low Jan 28 and a key support
- SUP 4: $1753.7 - Low Dec 15 2021
Gold remains vulnerable and Wednesday's move lower confirmed a resumption of the current downtrend. The sell-off resulted in a break of $1848.8, 76.4% of the Jan 28 - Mar 8 rally. This paves the way for a move towards $1821.1 next, the Feb 11 low. Sights are also set on $1780.4, the Jan 28 low. On the upside, $1909.8, the May 5 high, is seen as the initial firm resistance. A break would signal a possible short-term reversal.
SILVER TECHS: Trend Needle Points South
- RES 4: $26.943 - High Mar 8 and the bull trigger
- RES 3: $26.222 - High Apr 18 and a key short-term resistance
- RES 2: $25.293 - High Apr 20
- RES 1: $23.095/848.051.142 - 20-day EMA / 50-day EMA
- PRICE: $21.345 @ 08:06 BST May 12
- SUP 1: $21.186 - Low May 10
- SUP 2: $20.983 - 1.764 proj of the Mar 8 - 29 - Apr 18 price swing
- SUP 3: $20.871 - 50.0% retracement of the Mar - Aug 2020 bull cycle
- SUP 4: $20.000 - Psychological round number
Silver remains bearish and is trading near its recent lows. Support at $22.008, the Feb 3 low and a bear trigger, has been breached this week. The move lower reinforces the bearish theme and has also resulted in a break of $21.427/423, the Dec 15 2021 low and Sep 29 2021 low. Sights are on $20.983, a Fibonacci projection. Firm short-term resistance is at $23.255, the 20-day EMA.
Why MNI
MNI is the leading provider
of intelligence and analysis on the Global Fixed Income, Foreign Exchange and Energy markets. We use an innovative combination of real-time analysis, deep fundamental research and journalism to provide unique and actionable insights for traders and investors. Our "All signal, no noise" approach drives an intelligence service that is succinct and timely, which is highly regarded by our time constrained client base.Our Head Office is in London with offices in Chicago, Washington and Beijing, as well as an on the ground presence in other major financial centres across the world.