
Why MNI
MNI is the leading provider
of intelligence and analysis on the Global Fixed Income, Foreign Exchange and Energy markets. We use an innovative combination of real-time analysis, deep fundamental research and journalism to provide unique and actionable insights for traders and investors. Our "All signal, no noise" approach drives an intelligence service that is succinct and timely, which is highly regarded by our time constrained client base.Our Head Office is in London with offices in Chicago, Washington and Beijing, as well as an on the ground presence in other major financial centres across the world.
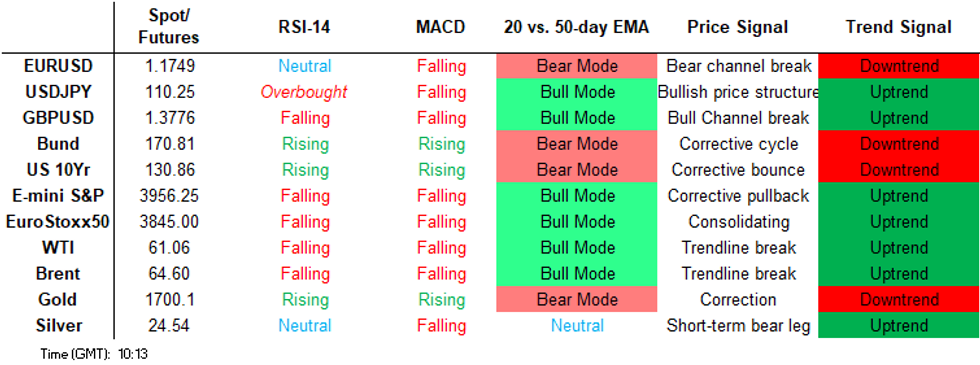
Price Signal Summary - USD Remains Firm and Yields Rise
- In the equity space, S&P E-minis are holding onto recent gains and remain bullish. Initial resistance to watch is 3978.50, Mar 18 high. A break would resume the uptrend and expose 4000. Key short-term support is at 3843.25. EUROSTOXX 50 has traded to a fresh trend high today. This reinforces the underlying bullish theme and opens 3926.56, 1.764 projection of Dec 21 - Jan 8 rally from Jan 28 low.
- In the FX space, EURUSD maintains a weaker tone. The focus on 1.1711next, Nov 5 low. The GBPUSD outlook remains bearish and recent gains are likely a correction. The pair last week cleared a bull channel base drawn off the Nov 2 low. The focus is on 1.3641, 38.2% of the Sep 23 - Feb 24 bull cycle. Resistance, at the former channel base, is 1.3854. USDJPY remains bullish and has cleared 110.00. Scope is for a climb to 110.63 Fibonacci projection, 0.764 of the Mar - Apr 2020 rally from the Jan 6 low.
- On the commodity front, Gold is heavy and has cleared near-term supports. This has exposed $1676.9, Mar 8 low and the bear trigger. Brent (K1) has probed resistance at $65.12, Mar 22 high. An extension higher would signal scope for a move towards $68.15, Mar 18 high. WTI (K1) has also probed resistance at $62.04, Mar 22 high. This signals scope for a climb towards $64.88, Mar 18 high
- In the FI space, futures are soft and yields are climbing. Bunds (M1) are sharply lower this morning. Key support to watch is at 170.52, Mar 18 low. Gilts (M1) are trading lower too. The kay support and bear trigger is at 126.79, Mar 18 low.
FOREIGN EXCHANGE
EURUSD TECHS: Still Heavy!
- RES 4: 1.1989/90 High Mar 18 / 11 and the short-term bull trigger
- RES 3: 1.1988 50-day EMA
- RES 2: 1.1947 High Mar 22
- RES 1: 1.1805/53 High MAr 26 / High Mar 24
- PRICE: 1.1737 @ 09:16 GMT Mar 30
- SUP 1: 1.1711 Low Nov 5
- SUP 2: 1.1694 1.382 proj of the Jan 6 - Feb 5 - Feb 25 price swing
- SUP 3: 1.1647 1.50 proj of the Jan 6 - Feb 5 - Feb 25 price swing
- SUP 4: 1.1603 Low Nov 4
EURUSD weakness has extended this morning and the pair has cleared support at 1.1752, a Fibonacci projection. This reinforces current bearish conditions and paves the way for losses towards 1.1711 next, Nov 5 low. Last week's move lower resulted in a break of the 200-day MA. This confirmed a resumption of this year's downtrend and is weighing on the pair. On the upside, firm resistance is at 1.1947, the Mar 22 high.
GBPUSD TECHS: Bearish And Below Former Bull Channel
- RES 4: 1.4005 High Mar 12 and a key resistance
- RES 3: 1.3959 High Mar 19
- RES 2: 1.3877 High Mar 22
- RES 1: 1.3864 Former bull channel base drawn off the Nov 2 low
- PRICE: 1.3782 @ 06:06 GMT Mar 30
- SUP 1: 1.3670/63 Low Mar 25 / Low Feb 5
- SUP 2: 1.3641 38.2% retracement of the Sep 23 - Feb 24 bull cycle
- SUP 3: 1.3567 Low Feb 4
- SUP 4: 1.3520 Low Jan 18
GBPUSD maintains a bearish tone despite recent gains. Last week, the pair cleared its bull channel base from the Nov 2, 2020 low. Furthermore, price also traded through the 50-day EMA and a former key support at 1.3779, Mar 5 low, triggering an important short-term reversal. The focus is on 1.3663 next, Feb 5 low. On the upside, the former channel base at 1.3844 provides an initial firm resistance.
EURGBP TECHS: Resumes Its Downtrend
- RES 4: 0.8731 High Feb 26 and key resistance
- RES 3: 0.8668 High Mar 3
- RES 2: 0.8646 High Mar 24 and the S/T reversal trigger
- RES 1: 0.7600 20-day EMA
- PRICE: 0.8538 @ 06:18 GMT Mar 30
- SUP 1: 0.8506 Low Mar 29
- SUP 2: 0.8494 3.0% Lower Bollinger Band
- SUP 3: 0.8430 Low Feb 27, 2020
- SUP 4: 0.8356 Low Feb 26
EURGBP resumed its downtrend Monday, trading through 0.8533, Mar 18 low and bear bear trigger to print new multi-year lows. The move reinforces a bearish theme and exposes the 38.2% retracement of the 2015 - 2020 rally at 0.8521 which price dipped below Monday. An extension lower would open 0.8494, a volatility based support. Firm resistance is seen at 0.8646, Mar 24 high where a break is needed to signal a short-term reversal.
USDJPY TECHS: Still Defying Gravity
- RES 4: 112.23 High Feb 20, 2020
- RES 3: 111.71 High Mar 24
- RES 2: 111.30 High Mar 26, 2020
- RES 1: 110.63 0.764 proj of Mar - Apr 2020 rally from Jan 6 low
- PRICE: 110.27 @ 09:21 GMT Mar 30
- SUP 1: 109.13 Low Mar 26
- SUP 2: 108.46/41 20-day EMA / Low Mar 23 and key support
- SUP 3: 107.82 Low Mar 5
- SUP 4: 107.01 50-day EMA
USDJPY continues to push higher with the bull trend firmly intact. The move last week above 109.36, Mar 15 high confirmed a resumption of the uptrend and note that 109.56 has been breached, a key retracement - 76.4% of Mar 2020 - Jan downleg. Today, 110.00 has been breached opening 110.63, a Fibonacci projection. Overbought conditions are still not impacting this trend and instead continues to reinforce current sentiment. 108.41 is key support.
EURJPY TECHS: Key Supports Remain Intact
- RES 4: 131.22 1.236 proj of the Jun - Sep - Oct 2020 price swing
- RES 3: 130.67 High Mar 18 and the bull trigger
- RES 2: 129.94 High Mar 22
- RES 1: 129.48 Intraday high
- PRICE: 129.45 @ 09:23 GMT Mar 30
- SUP 1: 128.26/25 50-day EMA / Trendline drawn off Oct 30, 2020 low
- SUP 2: 127.50 Low Feb 22
- SUP 3: 127.31 Low Feb 17
- SUP 4: 126.98 Low Feb 12
EURJPY managed late last week to recover from 128.29, Mar 24 low. This leaves the 50-day EMA at 128.26, and trendline support at 128.25 intact. The trendline is drawn off the Oct 30, 2020 low. A break of this support zone is required to suggest scope for a deeper S/T sell-off and this would signal a reversal of the current uptrend. For bulls, initial firm resistance is at 129.94, Mar 22 high. A break would open the key resistance at 130.67, Mar 18 high.
AUDUSD TECHS: Bearish Threat Still Present
- RES 4: 0.7775 Trendline resistance drawn off the Feb 25 high
- RES 3: 0.7757 High Mar 22
- RES 2: 0.7699 Low Mar 17
- RES 1: 0.7664 Intraday high
- PRICE: 0.7649 @ 06:41 GMT Mar 30
- SUP 1: 0.7564/63 Low Feb 2 / Mar 25 and a key support
- SUP 2: 0.7517 Low Dec 22
- SUP 3: 0.7462 Low Dec 21
- SUP 4: 0.7418 23.6% retracement of the Mar 2020 - Feb rally
AUDUSD maintains a bearish tone following last week's sell-off. The move lower last week resulted in a break of support 0.7621, Mar 9 low and a bear trigger. This confirms a resumption of the bearish cycle that started at 0.8007, Feb 25 high and paves the way for weakness below 0.7564, Feb 2 low. On the upside, key resistance has been established at 0.7849, Mar 18 high. Bearish!
USDCAD TECHS: Holding Onto Recent Gains
- RES 4: 1.2749 High Feb 26 and the bull trigger
- RES 3: 1.2700 High Mar 8
- RES 2: 1.2641 50-day EMA
- RES 1: 1.2629 High Mar 25
- PRICE: 1.2595 @ 06:45 GMT Mar 30
- SUP 1: 1.2516 Low Mar 23
- SUP 2: 1.2462 Low Mar 19
- SUP 3: 1.2365 Low Mar 18 and the bear trigger
- SUP 4: 1.2336 1.00 proj of the Jan 28 - Feb 25 - Feb 26 price swing
The recent USDCAD recovery remains intact and the pair is holding onto gains. Although the move higher is considered corrective, the current bullish tone signals scope for an extension of the upleg. The pair has cleared the 20-day EMA and the focus is on the 50-day EMA at 1.2641. On the downside, initial firm support is seen at 1.2516, Mar 23 low. A break would refocus attention on major support at 1.2365.BUND TECHS: (M1) Retracing Recent Gains
FIXED INCOME
BUND TECHS: (M1) Retracing Recent Gains
- RES 4: 172.83 Low May 5
- RES 3: 172.78 0.764 proj of the Feb 25 - Mar 11 - Mar 18 price swing
- RES 2: 172.66 High Mar 25
- RES 1: 172.34 High Mar 29
- PRICE: 171.02 @ 09:10 GMT Mar 30
- SUP 1: 170.93 Low Mar 19
- SUP 2: 170.52 Low Mar 18 and key support
- SUP 3: 170.00 Round number support
- SUP 4: 169.24 Low Feb 24 and major support
Bund futures continue to retrace recent gains. The pullback highlights the importance of support at 170.52, Mar 18 low. A break of this level would strengthen a bearish argument and signal scope for a deeper sell-off. The recent pullback suggests that the entire recovery between Feb 25 - Mar 25 has been a correction and that this corrective is likely over. Key resistance has been defined at 172.66, Mar 25 high.
BOBL TECHS: (M1) Off Recent Highs
- RES 4: 135.700 High Dec 11, 2020 (cont)
- RES 3: 135.544 0.764 proj of the Feb 26 - Mar 3 - Mar 9 price swing
- RES 2: 135.520 High Mar 25
- RES 1: 135.440 High Mar 29
- PRICE: 135.040 @ 09:13 GMT Mar 30
- SUP 1: 135.010 Low Mar 22
- SUP 2: 134.870 Low Mar 19 and key short-term support
- SUP 3: 134.780 Low Mar 8 and 9
- SUP 4: 134.670 61.8% retracement of the Feb 26 - Mar 25 rally
Bobl futures are lower and appear likely to extend the current retracement. An extension lower would expose support at 134.870, Mar 18 low where a break would strengthen a bearish argument and suggest scope for a deeper pullback. This would open 134.780 and potentially below. On the upside, key resistance has been defined at 135.520, Mar 25 high. A break of this level is required to reinstate the recent bull cycle.
SCHATZ TECHS: (M1) Finds Resistance
- RES 4: 112.201 0.764 proj of the Feb 26 - Mar 2 - Mar 10 price swing
- RES 3: 112.193 50-day EMA (cont)
- RES 2: 112.174 0.618 proj of the Feb 26 - Mar 2 - Mar 10 price swing
- RES 1: 112.165 High Mar 25 and the bull trigger
- PRICE: 112.110 @ 09:15 GMT Mar 30
- SUP 1: 112.095 Low Mar 19
- SUP 2: 112.070 Low Mar 18 and a key near-term support
- SUP 3: 112.060 Low Mar 10
- SUP 4: 112.026 61.8% retracement of the Feb 26 - Mar 25 rally
Schatz futures have pulled back from recent highs and the contract appears likely to extend the current retracement. This would expose support at 112.070, Mar 18 low where a break would strengthen a bearish argument and suggest scope for a deeper pullback to 112.060 and potentially below. On the upside, key resistance has been defined at 112.165, Mar 25 high. A break above this level is required to reinstate the recent bullish theme.
GILT TECHS: (M1) Remains Below Key Resistance
- RES 4: 130.38 High Feb 17
- RES 3: 129.75 High Feb 19
- RES 2: 129.27 High Mar 2 and the reversal trigger
- RES 1: 128.93 High Mar 25
- PRICE: 128.10 @ Close Mar 29
- SUP 1: 127.34 Low Mar 19
- SUP 2: 126.79 Low Mar 18 and the bear trigger
- SUP 3: 126.55 Low Apr 17, 2019 (cont)
- SUP 4: 126.00 Round number support
Gilt futures traded higher last week and a key support has been defined at 126.79, Mar 18 low. The move higher resulted in a climb above former resistance at 128.33, Mar 16 high and further gains would expose the firm resistance and bull trigger at 129.27, Mar 2 high. From a trend perspective, the primary direction remains down. The trigger for a resumption of bearish pressure is 126.79. On the upside, a break of 129.27 would alter the picture.
BTP TECHS: (M1) Stalling Ahead Of Resistance
- RES 4: 151.33 1.618 proj of the Feb 26 - Mar 3 - Mar 5 price swing
- RES 3: 151.05 1.50 proj of the Feb 26 - Mar 3 - Mar 5 price swing
- RES 2: 150.69 76.4% retracement of the Feb 12 - 26 sell-off
- RES 1: 150.39 High Mar 11
- PRICE: 149.50 @ Close Mar 29
- SUP 1: 148.97 Low Mar 22
- SUP 2: 148.36 Low Mar 18
- SUP 3: 148.20 61.8% retracement of the Feb 26 - Mar 11 rally
- SUP 4: 147.68 76.4% retracement of the Feb 26 - Mar 11 rally
BTP futures traded higher last week but have started this week on a softer note. Resistance is at 150.39, Mar 11 high with a pivotal level at 150.69, 76.4% of the Feb 12 - 26 sell-off. The recent focus has been on a resumption of bearish pressure and while resistance holds, the S/T risk still appears skewed to the downside. A breach of 148.36, MAr 18 low would reinforce this theme. On the upside, clearance of 150.39 would instead be bullish.
EQUITIES
EUROSTOXX 50 Techs: Fresh Trend High Print
- RES 4: 4000.00 Psychological round number
- RES 3: 3987.14 2.00 proj of Dec 21 - Jan 8 rally from Jan 28 low
- RES 2: 3926.56 1.764 proj of Dec 21 - Jan 8 rally from Jan 28 low
- RES 1: 3910.16 Intraday high
- PRICE: 3902.59 @ 09:21 Mar 30
- SUP 1: 3841.46 Low Mar 26
- SUP 2: 3784.09 Low Mar 25 and key support
- SUP 3: 3742.53 High Feb 15 and recent breakout level
- SUP 4: 3725.17 50-day EMA
EUROSTOXX 50 traded higher yesterday and again today, registering a fresh trend high print of 3910.16. The outlook is bullish and yesterday's gains confirm a resumption of the trend and maintains the bullish price sequence of higher highs and higher lows. This signals scope for a climb to 3926.56 next, a Fibonacci projection. On the downside, key support has been defined at 3784.09, Mar 25 low. A break is required to signal a potential short-term top.
COMMODITIES
BRENT TECHS: (K1) Probes Resistance
- RES 4: $71.38 - High Mar 5 and the key bull trigger
- RES 3: $70.03 - High Mar 15
- RES 2: $68.15 - High Mar 18
- RES 1: $65.46 - High Mar 29
- PRICE: $64.76 @ 06:46 Mar 30
- SUP 1: $61.85 - Low Mar 26
- SUP 2: $60.27 - Low Mar 23 and the bear trigger
- SUP 3: $58.56 - 38.2% retracement of the Nov 2 - Mar 8 rally
- SUP 4: $57.09 - High Jan 13
Brent crude futures traded higher yesterday and price has probed resistance at $65.12, Mar 22 high. An extension higher would signal scope for a move towards $68.15, Mar 18 high and also highlight the potential end of the correction lower between Mar 8 - 23. On the downside, key short-term support lies at $60.27, Mar 23 low. A break of this level would resume the recent bearish pressure.
WTI TECHS: (K1) Trades Above Resistance
- RES 4: $67.79 - High Mar 8 and the bull trigger
- RES 3: $66.44 - High Mar 15
- RES 2: $64.88 - High Mar 18 and a key near-term resistance
- RES 1: $62.27 - Intraday high
- PRICE: $61.25 @ 06:55 Mar 30
- SUP 1: $58.32 - Low Mar 26
- SUP 2: $57.25 - Low Mar 23
- SUP 3: $55.65 - 38.2% retracement of the Nov 2 - Mar 8 rally
- SUP 4: $53.68 - High Jan 13
WTI futures traded higher yesterday and overnight. The pair has probed resistance at $62.04, Mar 22 high. An extension higher would signal scope for a stronger short-term rally towards $64.88, Mar 18 high and also highlight the potential end of the correction lower between Mar 8 - 23. On the downside, key short-term support lies at $57.25, Mar 23 low. A break of this level would resume the recent bearish pressure.
GOLD TECHS: Downside Extension
- RES 4: $1805.7 - High Feb 25
- RES 3: $1771.5 - 50-day EMA
- RES 2: $1755.5 - High Mar 18 and key resistance
- RES 1: $1736.9 - 20-day EMA
- PRICE: $11699.6.0 @ 09:40 GMT Mar 30
- SUP 1: $1695.4 - Intraday low
- SUP 2: $1676.9 - Low Mar 8 and the bear trigger
- SUP 3: $1671.0 - Low Jun 5, 2020
- SUP 4: $1659.6 - Low Apr 21, 2020
Gold traded lower yesterday breaching support at $1719.3, Mar 18 low. The yellow metal has also cleared support at $1699.3 today, Mar 12 low, extending the current bearish pressure.The breach of $1699.3 marks a key intraday development and reinforces a bearish threat plus signals scope for a move towards $1676.9, the Mar 8 low and a bear trigger. Key short-term resistance has been defined at $1755.5, Mar 18 high.
SILVER TECHS: Fresh Trend Low
- RES 4: $27.595 - High Feb 26
- RES 3: $27.081 - High Mar 1
- RES 2: $26.636 - High Mar 18 and firm near-term resistance
- RES 1: $25.826 - High Mar 23
- PRICE: $24.510 @ 09:45 GMT Mar 30
- SUP 1: $24.402 - Intraday low
- SUP 2: $24.057 - Jan 18 low and a key support
- SUP 3: $23.524 - Low Dec 7
- SUP 4: $22.591- Low Dec 12
Silver remains soft. The metal traded lower Mar 25 clearing support at $24.836, Mar 5 low. The metal has traded to a fresh trend low today of $20.402 reinforcing underlying bearish conditions. Further weakness is likely and the break lower has opened $24.057, the Jan 18 low and a key support. Initial firm resistance is seen at $25.826, Mar 23 high. Key short-term resistance has been defined at $26.636, Mar 18 high.
Why MNI
MNI is the leading provider
of intelligence and analysis on the Global Fixed Income, Foreign Exchange and Energy markets. We use an innovative combination of real-time analysis, deep fundamental research and journalism to provide unique and actionable insights for traders and investors. Our "All signal, no noise" approach drives an intelligence service that is succinct and timely, which is highly regarded by our time constrained client base.Our Head Office is in London with offices in Chicago, Washington and Beijing, as well as an on the ground presence in other major financial centres across the world.