
Why MNI
MNI is the leading provider
of intelligence and analysis on the Global Fixed Income, Foreign Exchange and Energy markets. We use an innovative combination of real-time analysis, deep fundamental research and journalism to provide unique and actionable insights for traders and investors. Our "All signal, no noise" approach drives an intelligence service that is succinct and timely, which is highly regarded by our time constrained client base.Our Head Office is in London with offices in Chicago, Washington and Beijing, as well as an on the ground presence in other major financial centres across the world.
FOREX: Equities Provide Some Relief But Risks Remain
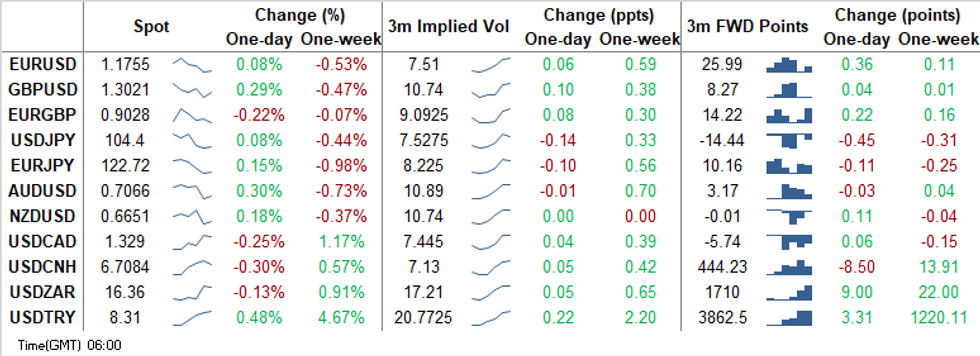
Commodity FX outperformed in the G10 basket as equities provided some relief following Wednesday's rout. The FX space watched e-minis move higher amid light news flow, with some noting an FT source story suggesting that "the U.S. is allowing a growing number of chip companies to supply Huawei with components". Major crosses generally swam with the mild, broader risk-on tide, with little in the way of violent price swings.
European COVID spread, prompting lock-down action in France and Germany, will heighten interest for today's ECB MonPol meeting. No change widely expected with most looking for signals for the December meeting. US election looming, prompts position adjustments as traders take stock of the possible outcomes. Month-end Friday which should add to volatility into the end of the week.
- JPY was the worst performer among G10 currencies, but EUR/JPY failed to re-test neckline of the double top pattern confirmed yesterday. The currency shrugged off the BoJ's decision not to touch policy levers this time, in line with expectations.
- USD/CNH went offered despite a softer than expected PBoC fix (CNY6.7260 vs. BBG est. of CNY6.7234). As a reminder, CPC Central Committee wraps up its four-day meeting today and should unveil the next five-year economic plan as well as a longer-term strategy through 2035.
- USD/KRW re-opened higher, as positive local news came with caveats, before trimming gains on the back of wider sentiment. The BoK's business confidence gauges improved, but remain considerably below the neutral 100 level, while Samsung's Q3 profit beat was accompanied by negative outlook for Q4.
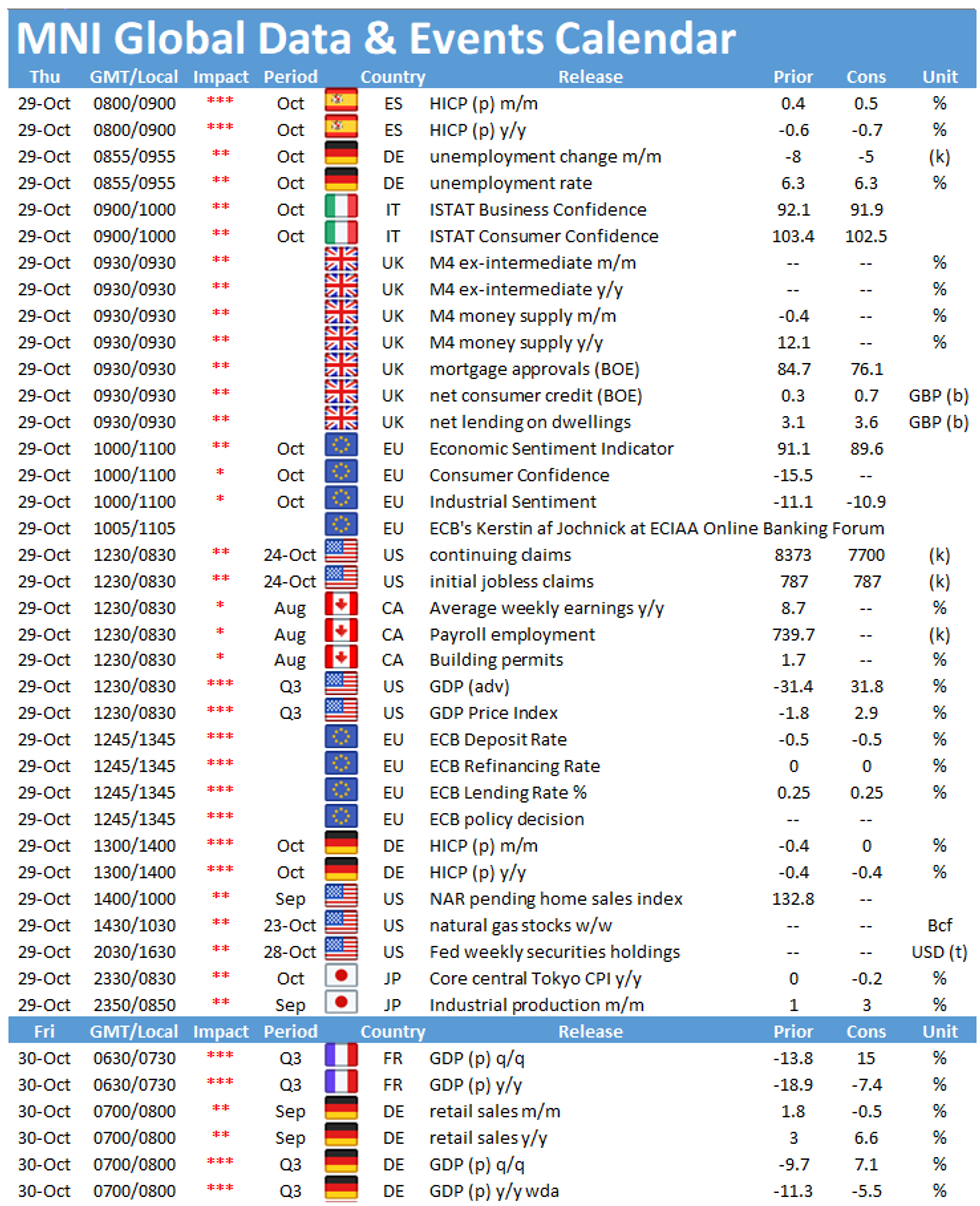
- Focus turns to ECB MonPol decision, U.S. initial jobless claims & advance GDP, German unemployment & flash CPI, EZ sentiment gauges & Canadian building permits. Central bank speaker slate includes ECB's Visco & Villeroy.
MNI TECHNICALS:
EUR/USD: Key Trendline Remains Under Pressure
- RES 4: 1.1909 1.0% 10-dma envelope
- RES 3: 1.1881 High Oct 21 and the bull trigger
- RES 2: 1.1839 High Oct 27
- RES 1: 1.1798 Intraday high
- PRICE: 1.1752 @ 06:46 GMT Oct 29
- SUP 1: 1.1718 Low Oct 28
- SUP 2: 1.1689 Low Oct 15 and a key support
- SUP 3: 1.1612 Low Sep 25 and the bear trigger
- SUP 4: 1.1541 Low Jul 23
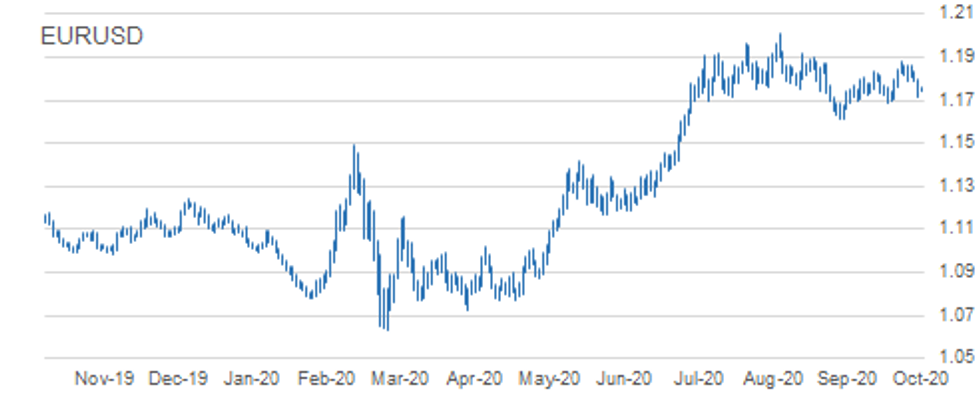
EURUSD traded under pressure for much of the European session yesterday but managed to stage a modest rally into the US close. The outlook remains bearish though and the pair continues to test key near-term trendline support drawn off the Sep 28 low that was also probed yesterday. A clear breach of the trendline would strengthen a bearish case and open 1.1689, Oct 15 low and a key support. Initial resistance is at 1.1798, Wednesday's intraday high.
GBP/USD: Bearish Pressure
- RES 4: 1.3280 Former trendline support drawn off the Mar 20 low
- RES 3: 1.3264 2.0% 10-dma envelope
- RES 2: 1.3177 High Oct 21 and the bull trigger
- RES 1: 1.3080 High Oct 27
- PRICE: 1.3016 @ 05:53 GMT Oct 29
- SUP 1: 1.2917 Low Oct 28
- SUP 2: 1.2863 Low Oct 14 and key near-term support
- SUP 3: 1.2806 Low Sep 30
- SUP 4: 1.2794 76.4% retracement of the Sep 23 - Oct 21 rally
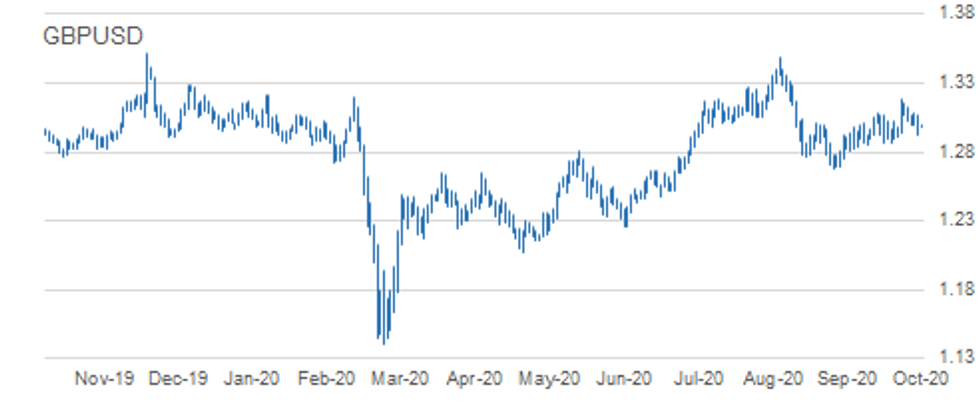
GBPUSD traded lower Wednesday, breaking through Monday's 1.2993 low as well as 1.2940 Oct 21 low. The pair did find support off the day low though. Nevertheless, the break suggests scope for a deeper corrective pullback and exposes 1.2863, Oct 14 low and a key support. Price action has defined initial resistance at 1.3080, Oct 27 high. A move back above this hurdle would ease bearish pressure and open 1.3177, Oct 21 high.
EUR/GBP: Attention Still On Key Support
- RES 4: 0.9220 High Sep 22
- RES 3: 0.9158/62 1.0% 10-dma envelope / High Oct 7
- RES 2: 0.9149 Oct 20 high
- RES 1: 0.9107 High Oct 23
- PRICE: 0.9029 @ 05:56 GMT Oct 29
- SUP 1: 0.9012 Low Oct 21
- SUP 2: 0.9007 Low Oct 14 and the bear trigger
- SUP 3: 0.8967 76.4% retracement of the Sep 3 - 11 rally
- SUP 4: 0.8925 Low Sep 7
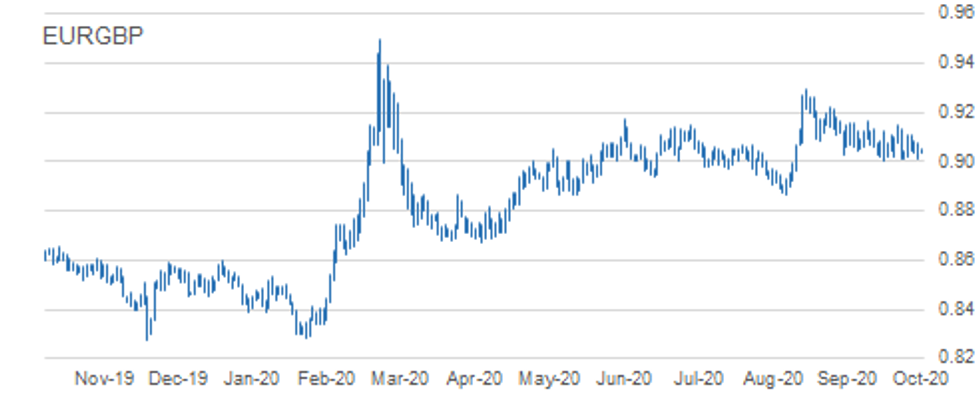
EURGBP is trading close to recent lows. The outlook remains bearish following the sharp sell-off on Oct 21. Attention is on support at 0.9007, Oct 14 low and the near-term bear trigger. A break of 0.9007 would confirm a resumption of the downtrend that started Sep 11 and expose 0.8967, a retracement point. Key short-term resistance has been defined at 0.9149, Oct 20 high. Clearance of this level would undermine bearish conditions.
USD/JPY: Key Support Still Exposed
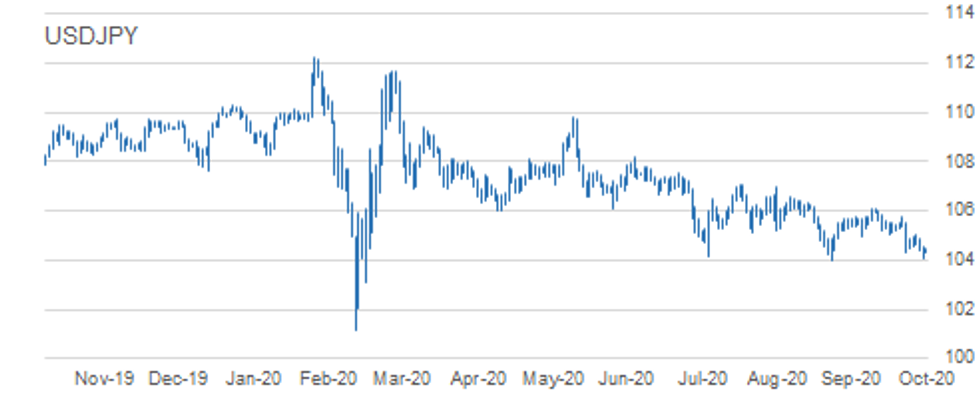
- RES 4: 105.75 High Oct 20
- RES 3: 105.53 High Oct 21 / 50-dma
- RES 2: 105.06 High Oct 26 and key near-term resistance
- RES 1: 104.56 Intraday high
- PRICE: 104.40 @ 05:59 GMT Oct 29
- SUP 1: 104.00 Low Sep 21 and the bear trigger
- SUP 2: 103.67 76.4% retracement of the Mar 9 - 24 rally
- SUP 3: 103.09 Low Mar 12
- SUP 4: 102.02 Low Mar 10
USDJPY maintains a softer tone and edged lower again yesterday. The outlook is bearish following the Oct 21 sell-off that marked a resumption of the downleg from 106.11, Oct 7 high. A number of important supports have been cleared and attention is on the key 104.00 handle, Sep 21 low. Clearance of 104.00 would suggest scope for a deeper USD sell-off within the bear channel drawn off the Mar 24 high. Firm resistance is at 105.06.
EUR/JPY: Erodes Key Support Levels
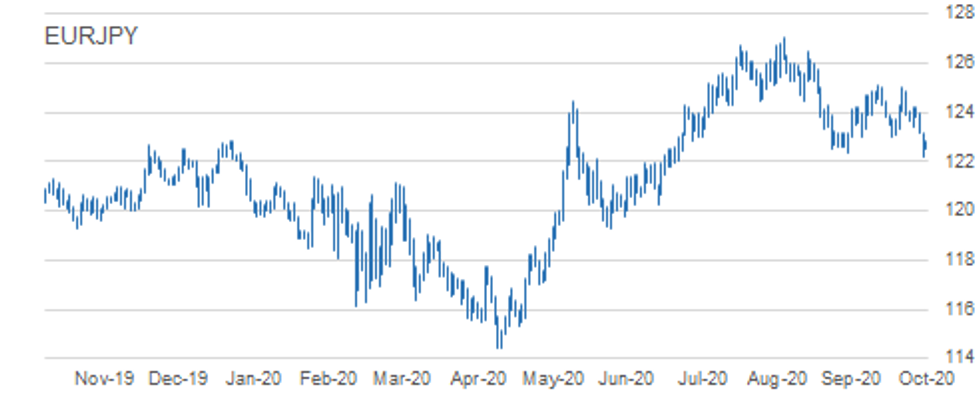
- RES 4: 125.00/09 High Oct 20 and Oct 9
- RES 3: 124.23 High Oct 23 and 26
- RES 2: 123.84 20-day EMA
- RES 1: 123.19 High Oct 28
- PRICE: 122.69 @ 06:09 GMT Oct 29
- SUP 1: 122.19 Low Sep 28 / 0.618 proj of Sep 1 - 28 - Oct 9 swing
- SUP 2: 121.82 Low Jul 15 / 16
- SUP 3: 121.50 0.764 proj of Sep 1 - 28 decline from Oct 9 high
- SUP 4: 120.70 Low Jul 13
EURJPY yesterday cleared support at 123.03/02 as well as 122.38, Sep 28 low. This undermines the recent bullish outlook and instead signals a likely resumption of the downleg that started on Sep 1. Scope is seen for weakness towards 121.82 - levels not seen since July. 121.50, a Fibonacci projection has also appeared on the radar. Initial resistance is at 123.19, the Wednesday high.
AUD/USD: Trendline Resistance Caps Gains
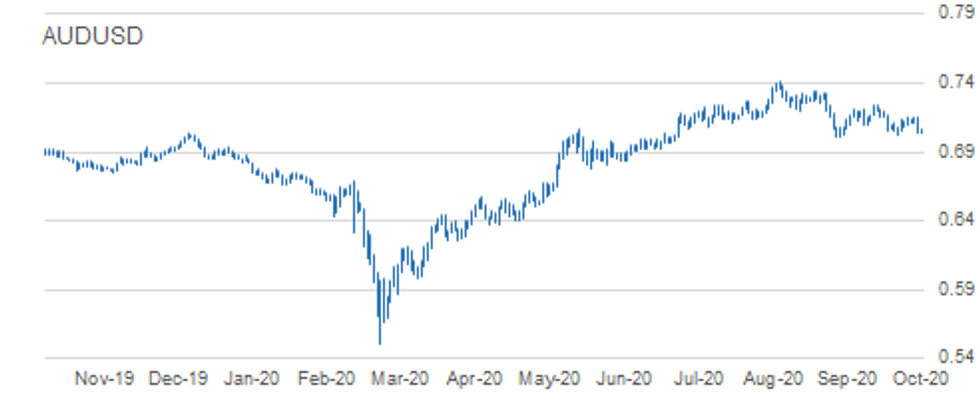
- RES 4: 0.7324 High Sep 21
- RES 3: 0.7258 61.8% retracement of the Sep 1 - 25 decline
- RES 2: 0.7243 High Oct 10 and a key resistance
- RES 1: 0.7151/58 Trendline drawn off the Sep 1 high / High Oct 23
- PRICE: 0.7066 @ 06:13 GMT Oct 29
- SUP 1: 0.7038 Low Oct 28
- SUP 2: 0.7021 Low Oct 20
- SUP 3: 0.7006 Low Sep 25 and the bear trigger
- SUP 4: 0.6965 23.6% retracement of the Mar - Sep rally
AUDUSD outlook is bearish. The Aussie continues to trade below trendline resistance drawn off the Sep 1 high. The line intersects at 0.7151 and represents a key resistance. This resistance line was tested Wednesday and capped gains. While the trendline holds, a bearish theme remains intact with attention is on key support and bear trigger at 0.7006, Sep 25 low. A trendline breach would signal a reversal and open 0.7243, Oct 10 high.
USD/CAD: Strong Gains
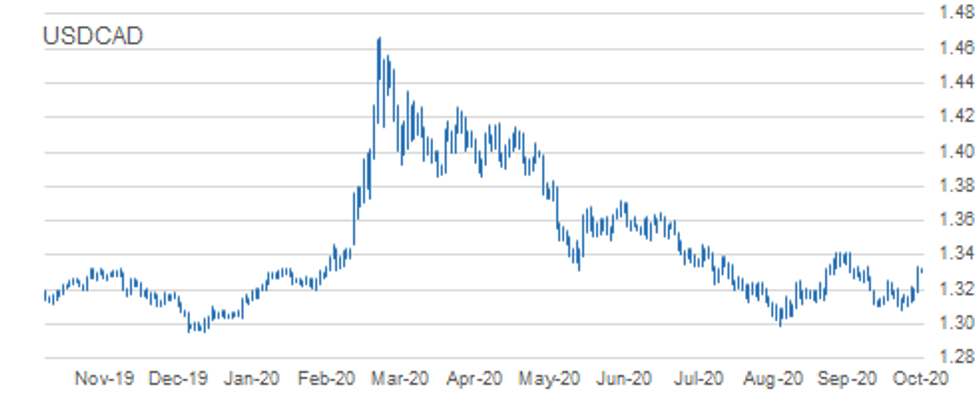
- RES 4: 1.3450 2.0% 10-dma envelope
- RES 3: 1.3421 High Sep 30 and primary resistance
- RES 2: 1.3341 High Oct 7
- RES 1: 1.3334 High Oct 28
- PRICE: 1.3286 @ 06:22 GMT Oct 29
- SUP 1: 1.329 High Oct 15 and recent breakout level
- SUP 2: 1.3180 Low Oct 28
- SUP 3: 1.3109/3081 Low Oct 23 / Low Oct 21 and the bear trigger
- SUP 4: 1.3047 Low Sep 7
USDCAD started the week on a firm note and confirmed a bullish statement Wednesday, rallying sharply higher. This led to a break of key resistance at 1.3259, Oct 15 high exposing resistance at 1.3341, Oct 7 high. Clearance of 1.3341 would signal scope for a climb towards 1.3421, Sep 30 and primary resistance. Initial firm support is seen at yesterday's low of 1.3180. A break of this level is required to undermine the developing bullish tone.
MNI KEY LEVELS:
EUR/USD: MNI Key Levels
- $1.1870/81/82 Upper Boll Band (2%)/Oct21 high/Sep16 high
- $1.1856/61/67 100-mma/Oct26 high/Oct22 high
- $1.1839 Oct27 high
- $1.1805/08 100-hma/200-hma
- $1.1797/98/04 55-dma/Oct28 high/Cloud top
- $1.1776/90 21-dma/50-dma
- $1.1759/60 Intraday high/Oct20 low, NY recovery high Oct28
- $1.1753 ***CURRENT MARKET PRICE 05:14GMT THURSDAY***
- $1.1744 Intraday low, Broken T.line support Sep25
- $1.1718/15 Oct28 low/61.8% 1.1612-1.1881
- $1.1689/85 Oct15 low/Sep30 low, Sep25 high, Lower Boll Band (2%)
- $1.1677/75/68 Lower 1.0% 10-dma env/76.4% 1.1612-1.1881/Cloud base
- $1.1661/51 Sep29 low/100-dma
- $1.1638 Lower Bollinger Band (3%)
- $1.1612 Sep25 low
GBP/USD: MNI Key Levels
- $1.3177 Oct21 high
- $1.3144/53 Upper 1.0% 10-dma env/Oct22 high
- $1.3116/22/25 76.4% 1.3177-1.2917/Oct23 high/Upper Boll Band (2%)
- $1.3078/80 61.8% 1.3177-1.2917/Oct27 high
- $1.3047/64 50% 1.3177-1.2917/Oct28 high
- $1.3027 100-hma, 200-hma
- $1.3010/15/16 Intraday high/55-dma/38.2% 1.3177-1.2917
- $1.3010 ***CURRENT MARKET PRICE 05:25GMT THURSDAY***
- $1.3002 50-dma
- $1.2983/81/71 21-dma/Cloud top, Intraday low/Broken sppt Sep25
- $1.2960/52/47 Cloud base/50-mma/200-wma
- $1.2917/11 Oct28 low/Oct20 low
- $1.2891/84 Oct19 low/Lower 1.0% 10-dma env
- $1.2872/65/63 100-dma/Oct16 low/Oct14 low
- $1.2850/46/38 Lower Boll Band (2%)/Oct07 low/Oct02 low
EUR/GBP: MNI Key Levels
- Gbp0.9149/54/57 Oct20 high/Upper 1.0% 10-dma env/Sep30 high
- Gbp0.9130/33/37 Upper Boll Band (2%)/Cloud top/Oct21 high
- Gbp0.9106/07 Oct26 high/Oct23 high
- Gbp0.9085 Oct27 high
- Gbp0.9070/76/79 21-dma/Oct28 high/Cloud base
- Gbp0.9064/65/69 200-hma/55-dma/50-dma
- Gbp0.9048/52/61 Intraday high/100-dma/100-hma, 10-dma
- Gbp0.9029 ***CURRENT MARKET PRICE 05:30BST THURSDAY***
- Gbp0.9029/15 Intraday low/Oct28 low
- Gbp0.9012/07 Oct21 low/Oct14 low, Lower Boll Band (2%)
- Gbp0.8976/73 Lower Boll Band (3%)/Lower 1.0% 10-dma env
- Gbp0.8967 Sep08 low
- Gbp0.8925 Sep07 low
- Gbp0.8902/00 200-dma/Sep04 low
- Gbp0.8882 Lower 2.0% 10-dma envelope
USD/JPY: MNI Key Levels
- Y105.50 50-dma
- Y105.23/30 21-dma/Cloud base
- Y105.06/11 Oct26 high/Cloud Kijun Sen
- Y104.93 Cloud Tenkan Sen
- Y104.86/89 200-hma/Oct27 high
- Y104.61 100-hma
- Y104.50/56 Intraday high/Oct28 high
- Y104.41 ***CURRENT MARKET PRICE 05:35BST THURSDAY***
- Y104.28 Intraday low
- Y104.17/11 Lower Boll Band (2%)/Oct28 low
- Y104.00 YTD low
- Y103.94/90 200-mma/1.618% swing 104.34-105.06
- Y103.80 Lower 1.0% 10-dma envelope
- Y103.67/65 76.4% 101.19-111.71/Lower Boll Band (3%)
- Y103.09 Mar12 low
EUR/JPY: MNI Key Levels
- Y123.64 Cloud Kijun Sen
- Y123.60 Cloud Tenkan Sen
- Y123.58 100-dma
- Y123.49 100-hma
- Y123.41 Oct23 low
- Y123.19 Oct28 high
- Y122.88 Intraday high
- Y122.69 ***CURRENT MARKET PRICE 05:46BST THURSDAY***
- Y122.57/51 Lower Boll Band (2%)/Intraday low
- Y122.43 Lower 1.0% 10-dma envelope
- Y122.19 Oct28 low
- Y122.06 Jul20 low
- Y121.91 Lower Bollinger Band (3%)
- Y121.85 100-wma
- Y121.82 Jul15 low, Jul16 low
AUD/USD: MNI Key Levels
- $0.7218/24/32 Oct13 high/Cloud top/Upper Boll Band (2%)
- $0.7190/91 50-dma/55-dma, Oct14 high
- $0.7168/70 Cloud base/Oct15 high
- $0.7157/58/65 Oct28 high/Oct23 high/Upper 1.0% 10-dma env
- $0.7130 21-dma
- $0.7100/12/14 200-hma/100-dma/100-hma
- $0.7069 Intraday high
- $0.7064 ***CURRENT MARKET PRICE 05:51GMT THURSDAY***
- $0.7044/38 Intraday low/Oct28 low
- $0.7024/23 Lower Boll Band (2%)/Lower 1.0% 10-dma env
- $0.7021/06 Oct20 low/Sep25 low
- $0.6973/71/63 Jul20 low/Lower Boll Band (3%)/Jul16 low
- $0.6952 Lower 2.0% 10-dma envelope
- $0.6921 Jul14 low
- $0.6895/81 100-wma/Lower 3.0% 10-dma env
USD/CAD: MNI Key Levels
- C$1.3483 Jul22 high
- C$1.3451/57/60 Aug03 high/Upper 2.0% 10-dma env/Jul30 high
- C$1.3411/19/21 Upper Boll Band (3%)/Sep29 high/Aug04 high, Sep30 high
- C$1.3377 100-wma
- C$1.3340/41/52 Upper Boll Band (2%)/Oct07 high/Sep29 low
- C$1.3326/33/34 Intraday high/100-dma/Oct28 high
- C$1.3320/25 Cloud top/Upper 1.0% 10-dma env
- C$1.3290 ***CURRENT MARKET PRICE 05:57BST THURSDAY***
- C$1.3287 Intraday low
- C$1.3224 Cloud base
- C$1.3204/03/99 55-dma, 21-dma/50-dma/100-hma
- C$1.3180/78/75 Oct28 low/50-mma/200-hma
- C$1.3160 200-wma
- C$1.3142 Oct27 low
- C$1.3126/24 Oct26 low/Oct22 low
OPTIONS: Expiries for Oct29 NY cut 1000ET (Source DTCC)
- EUR/USD: $1.1700(E785mln), $1.1720-25(E1.2bln), $1.1745-55(E1.6bln), $1.1765-70(E766mln),
$1.1850-55(E634mln) - USD/JPY: Y103.20-25($1.6bln-USD puts), Y103.60($1.0bln-USD puts), Y104.00($1.8bln-USD puts), Y104.75($523mln), Y105.15-16($654mln), Y105.25($1.3bln), Y105.55-65($2.4bln), Y106.00($1.2bln)
- GBP/USD: $1.2800(Gbp425mln)
- EUR/GBP: Gbp0.9050(E920mln), Gbp0.9110(E697mln)
- AUD/JPY: Y71.60(A$727mln-AUD calls), Y73.20(A$1.0bln-AUD puts), Y76.35-40(A$2.4bln-AUD calls)
- USD/CAD: C$1.3160-75($1.0bln), C$1.3325($530mln)
Larger Option Pipeline
- EUR/USD: Oct30 $1.1750-54(E1.4bln), $1.1800(E2.2bln), $1.1850(E1.65bln), $1.1950(E1.7bln-EUR calls), $1.2000(E1.3bln); Nov03 $1.1900-05(E1.4bln)
- USD/JPY: Oct30 Y104.00($1.4bln), Y104.50($2.4bln), Y104.80-85($1.6bln), Y104.95-105.00($1.1bln), Y106.00-05($2.2bln); Nov03 Y105.45-49($1.3bln); Nov04 Y105.00($1.1bln); Nov05 Y106.06-09($1.6bln)
- EUR/JPY: Nov05 Y124.50(E1.1bln)
GBP/USD: Nov02 $1.3100(Gbp1.2bln), $1.3150(Gbp911mln) - EUR/GBP: Nov02 Gbp0.8900(E2.1bln-EUR puts), Gbp0.9000(E1.4bln)
- AUD/USD: Oct30 $0.7180-00(A$1.4bln); Nov02 $0.7140-45(A$1.9bln)
- AUD/JPY: Oct30 Y77.45(A$1.2bln)
- AUD/NZD: Oct30 N$1.0750(A$1.2bln)
- USD/CAD: Oct30 C$1.3025($1.1bln), C$1.3150($1.3bln)
- USD/CNY: Nov03 Cny6.5334($1.2bln); Nov05 Cny6.75($1.0bln), Cny6.80($1.9bln), Cny6.85($1.3bln)
Why MNI
MNI is the leading provider
of intelligence and analysis on the Global Fixed Income, Foreign Exchange and Energy markets. We use an innovative combination of real-time analysis, deep fundamental research and journalism to provide unique and actionable insights for traders and investors. Our "All signal, no noise" approach drives an intelligence service that is succinct and timely, which is highly regarded by our time constrained client base.Our Head Office is in London with offices in Chicago, Washington and Beijing, as well as an on the ground presence in other major financial centres across the world.