
Why MNI
MNI is the leading provider
of intelligence and analysis on the Global Fixed Income, Foreign Exchange and Energy markets. We use an innovative combination of real-time analysis, deep fundamental research and journalism to provide unique and actionable insights for traders and investors. Our "All signal, no noise" approach drives an intelligence service that is succinct and timely, which is highly regarded by our time constrained client base.Our Head Office is in London with offices in Chicago, Washington and Beijing, as well as an on the ground presence in other major financial centres across the world.
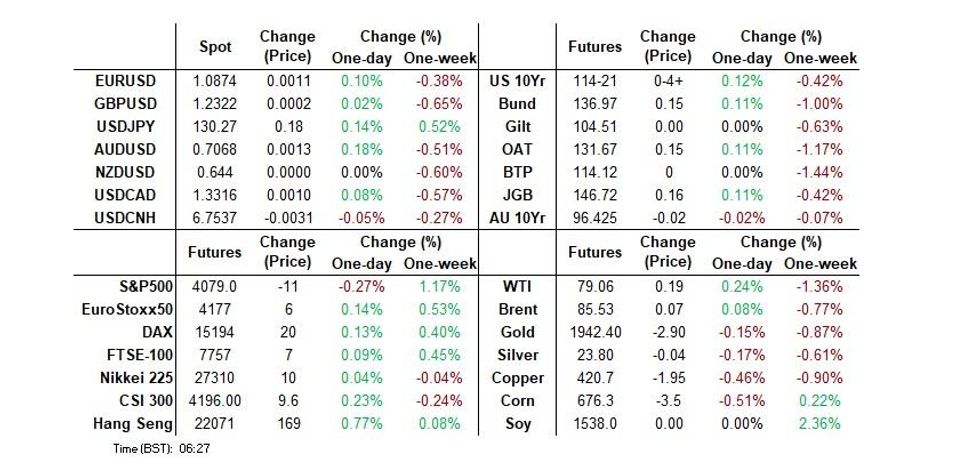
- With Asia-Pac participants seemingly content to stay sidelined ahead of this evening's Fed decision moves were limited and Tsys respected tight ranges.
- USD indices have also traded tight ranges as the market awaits the outcome of the Fed decision later.
- Besides the Fed later on we also have manufacturing PMIs/ISMs for the Eurozone and U.S., as well as Eurozone CPI.
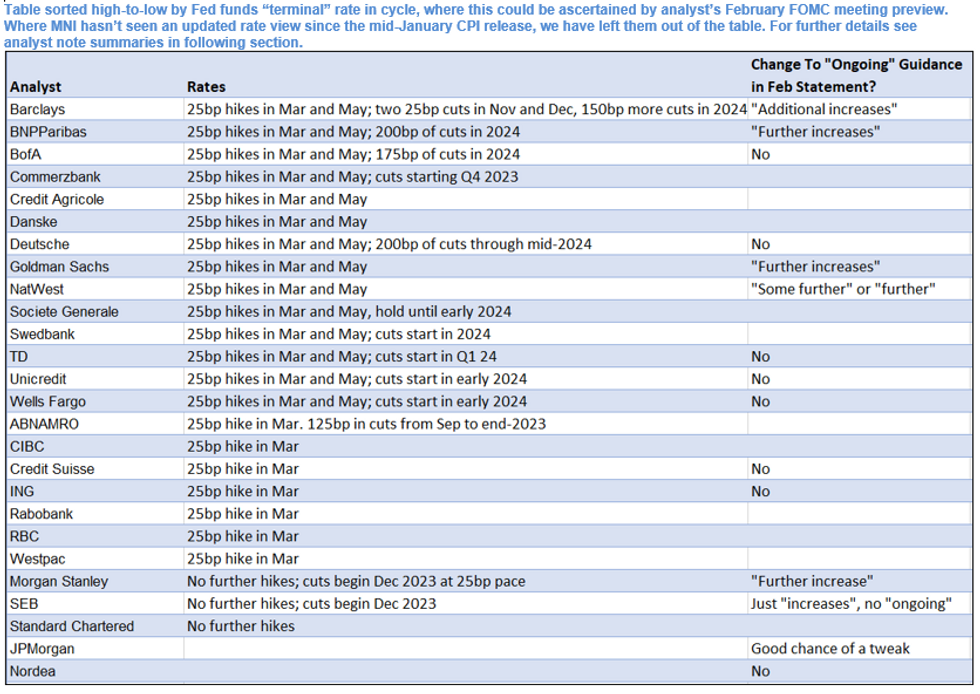
MNI Fed Preview: February 2023 - Analyst Views
EXECUTIVE SUMMARY
- The Fed will downshift its rate hike pace in February for the second consecutive meeting, to 25bp from 50bp.The dovish risks to this meeting appear at least partly priced in, including some expectations of Statement language acknowledging decelerating inflation, or a clear signal that the end of the hiking cycle is near.
- However, there are many ways Powell could re-emphasize the FOMC’s view that the job is not nearly done yet.
- Powell will again steer attention away from the pace of hikes and toward the terminal level (which the FOMC envisages as higher than the market does), while pushing back against rate cut pricing for H2 2023.
- FOR THE FULL PUBLICATION PLEASE USE THE FOLLOWING LINK:FedPrevFeb2023-ANALYSTUPDATE.pdf
MNI UST Issuance Deep Dive: Feb 2023 - Refunding Preview
EXECUTIVE SUMMARY
- We expect Treasury to announce unchanged nominal coupon auction sizes in the upcoming quarter when its quarterly refunding report is released at 8:30 a.m. ET on Wednesday, February 1.
- While coupon sizes will grow again in future, that may not happen until well into 2023, and our estimates reflect an unchanged schedule through the 1st half at least
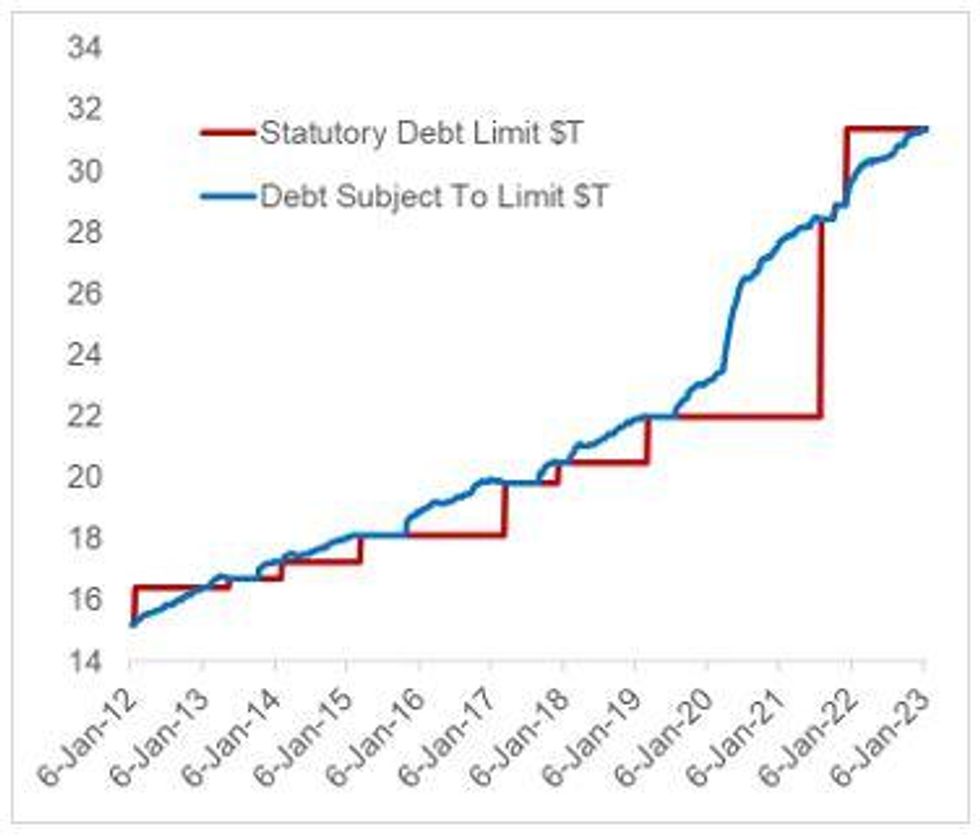
- Key topics outside the auction sizes will include discussion of potential Treasury buybacks and any plans surrounding the debt limit – including indications of cash management and bill supply.
- Our Deep Dive includes an estimated U.S. issuance schedule, review of October's auctions, and sell-side Refunding expectations.
- Please see PDF for full analysis: MNI_US_DeepDive_Issuance_2023_02.pdf
Source: Treasury, MNI
US TSYS: Little Changed In Asia, Fed In View
TYH3 deals at 114-19+, +0-03, operating in a narrow 0-05 range on volume of ~68k.
- Cash Tsys sit little changed across the major benchmarks.
- After a muted start Tsys firmed off session lows in the wake of a softer than expected Caixin PMI print.
- With Asia-Pac participants seemingly content to stay sidelined ahead of this evening's Fed decision moves were limited and Tsys respected tight ranges.
- Macro headline flow was also light.
- Today in Europe we have Eurozone final manufacturing PMI and CPI, before a slew of U.S. data including the ISM manufacturing survey and JOLTs job openings. However, the headline risk event is the FOMC rate decision, with a 25bp hike all but priced into OIS markets participants will look to the guidance in Powell's press conference (our preview is here). We will also get the latest quarterly refunding announcement from the Tsy (see our preview of that event here).
JGBS: Flat To Richer, Futures Consolidate Overnight Gains
A sedate round of JGB trade, particularly by recent standards, was observed on Wednesday.
- JGB futures oscillated either side of late overnight levels during the Tokyo session, dealing +15 into the close, as bulls look to consolidate the bounce from Tuesday’s late Tokyo lows.
- Meanwhile, cash JGBs run flat to ~4bp richer as the curve flattens, while 10-Year JGB yields operate just below the upper limit of the BoJ’s YCC parameters. Be on the lookout for unscheduled Rinban purchases covering the 5- to 10-Year zone of the curve if a more meaningful test of the BoJ’s policy settings plays out in the coming days.
- The swap curve flattened, with benchmark rates there running flat to 3.5bp lower, albeit lagging the moves in JGBs, as swap spreads widened.
- Local headline flow was limited, which left participants to adjust to the broader market moves observed since yesterday’s Tokyo close.
- Looking ahead, Thursday’s local docket consists of 10-Year JGB supply and lower tier data, which will leave auction dynamics and post-FOMC adjustments at the fore.
AUSSIE BONDS: Finishing A Little Cheaper
Aussie bond futures went out just off session cheaps, with YM & XM both -2.0. When it comes to a potential catalyst we would point to a piece from WSJ RBA watcher Glynn, which noted that “there was enough nastiness in Australia’s recent fourth-quarter inflation report to lock in the prospect of several interest-rate increases over the coming months, with the data confirming that the country continues to lag well behind other major economies in the race to tame prices.” The space showed modest to no reaction to NZ labour market data & the Caixin m’fing PMI print out of China. Wider cash ACGBs were ~2bp cheaper across the curve.
- Bills were flat to 5bp cheaper through the reds, steepening. RBA terminal cash rate pricing hovers back around the 3.80% mark, initially pressured by NZ labour market data before edging higher, likely on the Glynn article.
- RBA’s Kohler, Head of Economic Analysis, appeared before the Senate Select Committee on the cost of living. It is worth noting that she was limited in her answers given that the RBA is currently reviewing its forecasts which will be published on February 10 in the Statement on Monetary Policy. She said that the central bank thinks that inflation peaked at the end of last year at around 8%. Kohler reiterated that higher rates were necessary to bring supply and demand into balance and inflation down.
- Building approvals data and the Q4 NAB business survey headline domestically tomorrow, with post-FOMC adjustments set to dominate.
AUSTRALIA: Housing Correction Remains Orderly For Now
CoreLogic house prices fell 1.1% m/m in January after 1.2% in December, the ninth consecutive fall. This brought the annual rate to -8.8% from -7.1% and house prices now stand 9.7% below their April 2022 peak. The correction to date has not yet unwound half of the Covid bounce in house prices of 25.1% but so far it is one of the largest corrections globally. Higher rates are weighing on the housing market but currently the adjustment is orderly and is likely to be an area the RBA is monitoring rather than wanting to pause over.
- Prices in Sydney fell 1.2% m/m and -13.8% y/y (December -1.4%/-12.1%) and Melbourne -1.1% m/m and -9.3% y/y (-1.2%/-8.1%).
- House prices nationally are still 8.1% above trend after peaking at 21.9%. While housing valuation, ratio of house price to rents, is improving as well, it remains overvalued by around 6.5%.
- Sales remain weak with new home sales falling 4.5% m/m and -41.6% y/y in December. A turn in this would be required for prices to turn up again.
- NZ CoreLogic house prices fell 0.3% m/m and -7.2% y/y in January after -0.2% and -5% last month, more moderate than Australia’s correction despite more tightening.

Source: MNI - Market News/Refinitiv/CoreLogic
Fig. 2: Australia new home sales y/y% 3mma

Source: MNI - Market News/Refinitiv
NZGBS: Curve Bull Steepens, RBNZ Terminal OCR Pricing Lower In Wake Of Labour Market Data
NZGBs worked away from richest levels as the session wore on, leaving the major benchmarks running flat to 7bp richer at the close, bull steepening. Swap rates were 2-9bp lower, also steepening on the curve, with swap spreads a touch tighter on the day.
- That came after the domestic Q4 labour market report triggered an early bid, with ASB and BNZ both switching their calls for next month’s RBNZ meeting to a 50bp hike (from 75bp previously), leaving all of the “Big 4” looking for a 50bp step.
- To recap, there was an unexpected 0.1ppt uptick in the unemployment rate as employment growth provided a marginal downside miss, the participation rate held steady, private wages printed largely in line with expectations and average hourly earnings slowed.
- This was the last round of meaningful data before next month’s RBNZ meeting. The downside surprise in the Q4 CPI reading (at least relative to Bank expectations) saw RBNZ dated OIS pricing come in, while today’s data has pushed pricing more towards a 50bp hike as opposed to another 75bp step. There is ~56p of tightening now priced for next month’s meeting, a handful of bp lower on the day. Meanwhile, terminal OCR pricing has also come in a touch, showing just below 5.30%.
- Looking ahead, building permits data and weekly NZGB supply, covering NZGB-28, -33 & -37, headline Thursday’s domestic docket, although adjustment to the impending U.S. Fed monetary policy decision will likely dominate.
NEW ZEALAND: Continued Elevated Wage Pressures Keep RBNZ On Hiking Path
The unemployment rate for Q4 came in slightly higher than expected at 3.4% after 3.3% the previous quarter. The increase was driven by a 2.1% q/q rise in the number of unemployed while new jobs rose by only 0.1% q/q. Wages continued to rise at a solid pace but in line with expectations and Q3. The RBNZ is likely to welcome these tentative signs of easing in the overheated labour market but the worsening wage pressures are likely to mean further tightening ahead.
- Salaries and wages (including overtime) rose 1.1% q/q to 4.1% y/y, a series high. This was the third consecutive 1.1% quarterly rise, a rate not seen since 2007-08, which is likely to be a development that concerns the RBNZ. There was some easing in private sector average hourly earnings with a 0.9% q/q rise after 2.6% in Q3 but the annual rate remains above 8%.
- Full-time employment rose 2% y/y while part-time fell 1.6%. Hours worked rose a solid 1.4% q/q after 1.2% in Q3, despite people away with illness and on holiday. Vacancies fell 6.1% q/q and the ratio with unemployment has peaked.
- The underutilisation rate was also higher up to 9.4% from 9% but Statistics NZ note that this was due to “increases in the potential labour force”. The participation rate was stable at a series high of 71.7% and the employment rate at 69.3%.

Source: MNI - Market News/Refinitiv
Fig. 2: NZ employment y/y%

Source: MNI - Market News/Refinitiv
FOREX: USD Tracks Recent Ranges
USD indices have traded tight ranges as the market awaits the outcome of the Fed decision later. The BBDXY was last close to 1223.50, little changed versus NY closing levels. Cross asset signals remain modest, with US cash Tsys yields mixed across the curve, the 2yr slightly higher, but weakness at the back end. US equity futures remain in the red, although are away from worst levels.
- USD/JPY is drifting higher this afternoon (last at 130.20/25), but this could be cross related, with AUD/JPY moving back above 92.00. USD/JPY has been running out steam above 130.50 in the past week, so this level could be eyed on the topside. Dips sub 130.00 remain supported for now.
- AUD/USD is back close to 0.7070, around +0.20% firmer for the session. Besides against the yen, AUD/NZD is also pushing higher post the NZ jobs report. The cross was last near 1.0980, with bulls eyeing a move through 1.1000. Commodity prices are mixed with copper off to 420.75%, -0.45%, while iron ore is around flat, last at $127.25/ton.
- NZD/USD sits at 0.6435, around 0.40% lower from pre-data levels this morning. Slowing jobs growth and the unemployment rate edging higher as seen local banks trim their expectations for the RBNZ meeting. Dips in the pair were supported below 0.06420.
- Besides the Fed later on we also have PMIs/ISMs for the EU and US.
USD: D Day For The Dollar...Down But Not Out?
Since mid-January USD indices have largely tracked sideways. The Fed meeting later today shapes as key one in terms of short term USD sentiment.
- As our Fed preview noted, "The dovish risks to this meeting appear at least partly priced in, including some expectations of Statement language acknowledging decelerating inflation, or a clear signal that the end of the hiking cycle is near. However, there are many ways Powell could re-emphasize the FOMC’s view that the job is not nearly done yet."
- Arguably this raises the bar in terms of Fed dovishness needed to see a fresh wave of further USD selling.
- The first chart below overlays the DXY index against the unweighted 2yr yield differential on a 2yr government bond yield basis. This differential has also stabilized in recent weeks, although more so against JP and UK yields rather than the EU.
Fig 1: DXY Versus US-G3 2yr Yield Differential
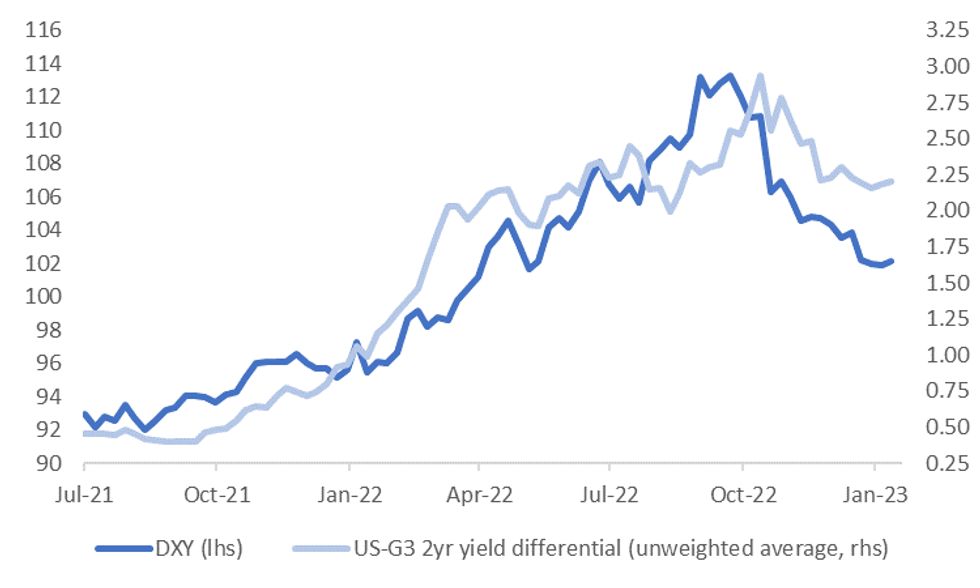
Source: MNI - Market News/Bloomberg
- Of course, the market may also pushback against any relative Fed hawkishness. Relative data surprises have also swung against the USD.
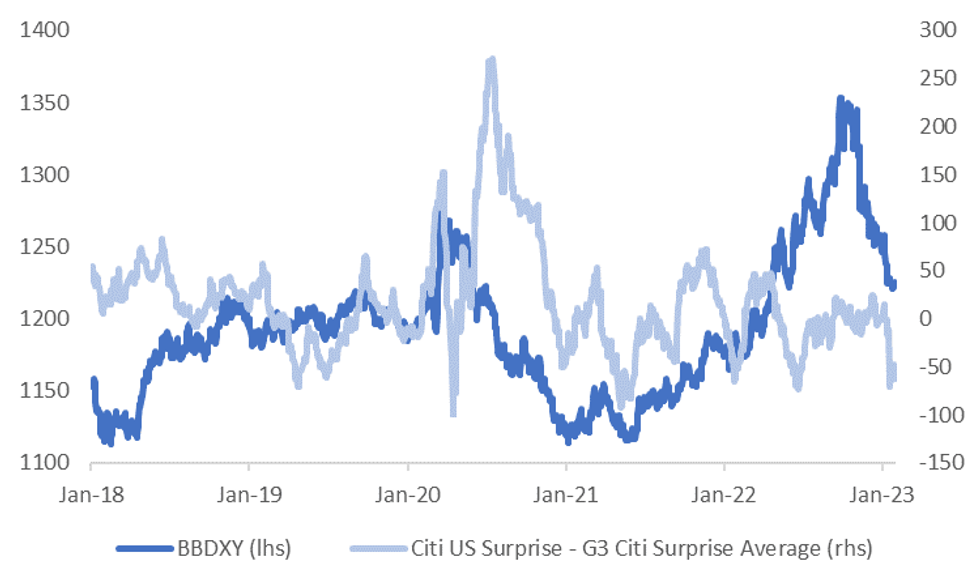
- The chart below plots the BBDXY index against the Citi US Surprise index differential with the EU, Japan and China Citi Surprise Indices.
- Interestingly though, we aren't too far away from recent trough points for this differential, at least using the last 5 years worth of history. If we see this differential start to stabilize it may take away one headwind for USD, all else equal. It's also hard not to argue some of this differential is also not priced in by the USD to some degree.
Fig 2: BBDXY Versus US Citi Surprise Index Differential With EU, Japan & China Average (Unweighted)
Source: Citi/MNI - Market News/Bloomberg
FX OPTIONS: Expiries for Feb01 NY cut 1000ET (Source DTCC)
- EUR/USD: $1.0765-70(E675mln), $1.0790-05(E996mln), $1.0850-55(E718mln), $1.0885-10(E3.0bln)
- USD/JPY: Y129.00($596mln), Y130.50($636mln)
- AUD/USD: $0.6920(A$527mln), $0.7000(A$572mln), $0.7140-50(A$683mln), $0.7185(A$1.1bln)
- USD/CNY: Cny6.82($1.1bln)
ASIA FX: Firmer Equities Helps Offset Softer Data Outcomes
USD/Asia pairs are mostly tracking within recent ranges, as the market awaits the Fed outcome later. Most pairs are slightly lower for the session, with a firmer equity market tone helping offset weaker data outcomes in China and South Korea. The Indian budget speech has just kicked off, while tomorrow the main focus is likely to be with South Korean CPI.
- USD/CNH couldn't sustain lows sub 6.7500, the pair back at 6.7550 currently. The Caixin PMI was weaker than expected at 49.2, versus 49.8 forecast, although did show improvement on the Dec print of 49.0. China related equities are a little firmer in the tech space today, while mainland aggregate indices are around +0.25% higher.
- 1 month USD/KRW hasn't been able to sustain moves sub 1230. Trade data was disappointing, with export growth slowing further to -16% y/y, while the trade deficit widened to a record. Local equities are higher (+0.70%), while offshore investors have returned, adding +$117.5mn.
- The bulls appear to be winning the USD/INR battle. The pair last at 81.86, which is down from late highs yesterday above 82.00, but a positive bias remains. Foreign investors sold the most Indian shares in 2 days since June, as the short selling report on the Adani Group continues to weigh on local equities. A net $1.45bn was withdrawn from Indian Equities by global investors on Friday and Monday bring the net outflow for January to ~$3bn. The manufacturing PMI slipped to 55.4 from 57.8. India's budget speech has also commenced.
- USD/IDR has seen some resistance above 15000, with the pair last tracking just under 14980. CPI data for Jan was a touch weaker than expected, core at 3.27% (3.30% forecast), while headline came in at 5.28% (5.40% forecast). The PMI rose to 51.3 from 50.9, while the detail showed reduced inflation pressures.
- USD/THB is around 0.30% lower for the session so far, last around 32.90/91. Still the pair has been probing higher in recent sessions, getting above 33.00 late yesterday. J.P. Morgan took profit on its long held overweight position, saying the currency had caught up with re-opening theme to a large degree, although it looks to re-establish longs at better entry levels. The manufacturing PMI did improve though to 54.5, while the Thai government stated growth of 4% this year is achievable.
SOUTH KOREA: Trade Figures Disappoint, Recovery Likely To Be Gradual
January trade figures were disappointing, with export growth coming in at -16.6% y/y (-11.1% forecast, -9.6% prior), while imports printed as expected -2.6% y/y (prior -2.5%). The trade deficit ballooned out to -$12.69bn, versus -$9.27bn expected and -$4.69bn prior.
- Export growth continues to trend lower, now at levels last seen in early 2020 (we troughed around -26% in April 2020).
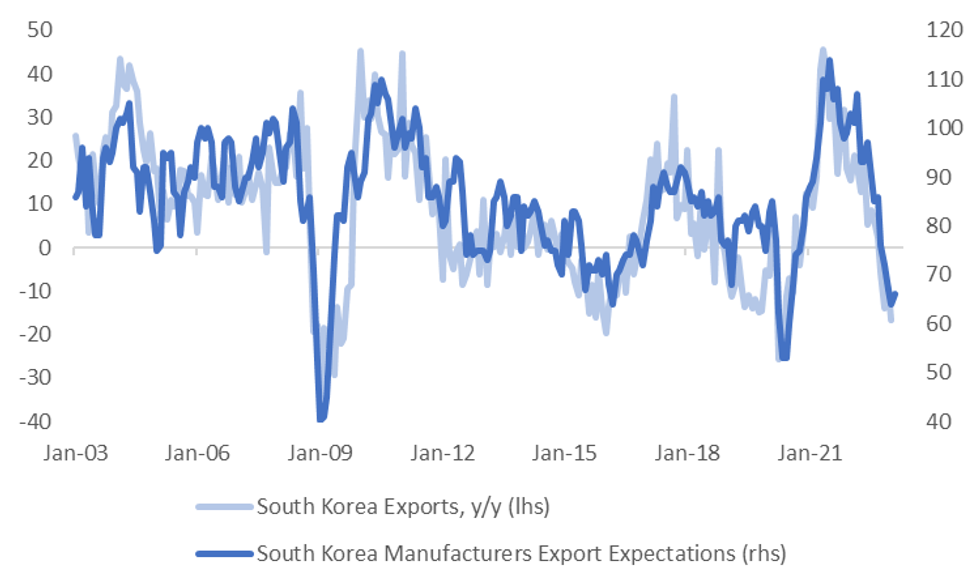
- There is some hope of improved conditions going forward, the first chart below overlays export growth against export expectations from South Korean manufacturers (sourced from the BoK).
- The most recent survey showed a slight uptick after a sharp downturn through the latter stages of 2023. We remain at depressed levels though and while China's exit from CZS should aid demand, the recovery is not expected to be V shaped.
- The consensus looks for real export growth to be back at 3.0% y/y by end of this year (we were at -4.4% in Q4 of last year).
Fig 1: South Korean Exports Versus Manufacturers' Expectations
Source: MNI - Market News/Bloomberg/BoK
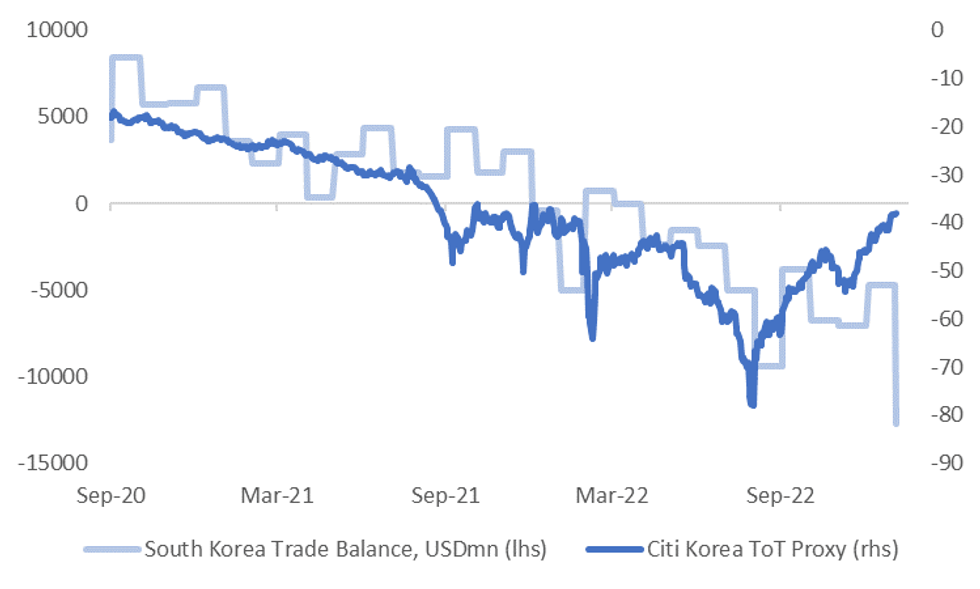
- The relationship between the trade deficit and the Citi South Korean terms of trade (ToT) proxy has weakened, see the second chart below. The trade deficit hit a fresh record wide near -$12.7bn in January. The authorities cited weakness in chip prices and still elevated energy costs as drivers of this result.
Fig 2: South Korea Trade Deficit Hits Fresh Wides Despite Citi ToT Proxy Improving
Source: Citi/MNI - Market News/Bloomberg
INDONESIA: Price Pressures Moderate In January
Inflation moderated in Indonesia in January suggesting that Bank Indonesia’s 225bp of tightening this cycle are doing their work and that BI may be close to pausing. Headline inflation rose less than expected in January at 5.3% y/y from 5.5% in December driven by lower utilities, transport and household goods prices. Underlying inflation, which the BI focuses on, moderated to 3.3% y/y from 3.4% but it is too soon to call a peak here (see chart).
- Headline inflation remains well above the upper end of the 2-4% target band but for now it looks like core inflation will remain within the band, which will be a relief to BI. It has been tightening policy to limit the pass through of higher headline prices and also to stabilise the IDR. The BI aims to return inflation to target in H2 2023.
- Transport prices moderated to 13.9% y/y from 15.3% in December. They remain elevated as the reduction in fuel subsidies in September is still feeding through. Food inflation was stable at 5.8%.

Source: MNI - Market News/Refinitiv/Bloomberg
EQUITIES: Modest Gains Ahead Of The Fed
Regional markets are mostly higher, although key bourses are struggling to make meaningful positive headway. US futures are in the red, albeit away from worst levels. Eminis are down -0.20%, Nasdaq futures off -0.28%. This is taking some of the shine off the better tone from Wall Street through Tuesday's session. Some cautiousness is also evident ahead of the upcoming Fed decision.
- The HSI is modestly higher, last +0.27%, after correcting lower for the first two sessions of the week. The tech sub index has rebounded 1.73% so far. The China-HK authorities plan to expand the border re-opening by Feb 6.
- The CSI 300 is close to flat. The Caixin manufacturing PMI, which is orientated towards smaller and export firms, disappointed coming in at 49.2, versus 49.8 expected.
- The Nikkei 225 is around flat as well, while the Kospi is enjoying a better session, up 0.45%, although this is down from earlier session highs. Trade figures were weaker than expected, while chip maker SK Hynix had a disappointing earnings result, but this hasn't impact sentiment. The Taiex is up around 0.45% as well.
- India shares are higher, last +0.60% for the Nifty, even with further Adani headwinds. The Indian budget is due later.
GOLD: Bullion Range Trading Ahead Of Fed Decision
Gold has been trading in a narrow range during the APAC session ahead of the Fed announcement later today. A 25bp rate hike is widely expected but the tone of the comments will be important and a hawkish note is likely to be detrimental to bullion. Gold prices are down 0.1% today to around $1926.40/oz after rising 0.3% on Tuesday following softer US data. DXY is flat on the session.
- Gold continues to trade between resistance at $1949.20, the January 26 high, and support at $1899.50, the 20-day EMA. But trend conditions remain bullish.
- The World Gold Council reported that demand for gold rose around 20% in 2022 to its highest since 2011 driven by precautionary flows due to rising inflation. Central bank purchases were their highest in over 50 years but jewellery demand was down slightly. The Council sees upside demand potential in 2023 because of recessionary and geopolitical fears and the recovery in China should drive increased demand for jewellery.
- Later the Fed meets and is expected to hike rates 25bp (see MNI Fed Preview). There are also manufacturing PMIs/ISM for January for the US and Europe and US JOLTS job openings for December.
OIL: Crude Extends Recovery Ahead Of Fed & OPEC Announcements Later
Oil prices have been zigzagging in a tight range during the APAC session ahead of the Fed and OPEC+ decisions later. A hawkish tone to Fed comments could put downward pressure on crude. WTI is currently up 0.5% to around $79.25/bbl and Brent +0.4% to $85.75. The USD is flat.
- WTI is still trading below $80 and initial resistance is at $80.49, the January 30 high. The sharp correction on Monday has put the uptrend in doubt and a further correction could see an extension towards $72.74, the January 5 low. WTI is ahead of its 50-day MA and Brent its 50- and 100-day MA.
- API reported another rise in US crude inventories of 6.3mn barrels and distillate was up 1.5mn and gasoline 2.7mn. The EIA stock data is out today.
- Later the Fed meets and is expected to hike rates 25bp (see MNI Fed Preview). OPEC+ also meets but reports before the meeting implied that there would be no change in their guidance. There are also manufacturing PMIs/ISM for January for the US and Europe and US JOLTS job openings for December.
UP TODAY (TIMES GMT/LOCAL)
| Date | GMT/Local | Impact | Flag | Country | Event |
| 01/02/2023 | 0815/0915 | ** |  | ES | IHS Markit Manufacturing PMI (f) |
| 01/02/2023 | 0845/0945 | ** |  | IT | S&P Global Manufacturing PMI (f) |
| 01/02/2023 | 0850/0950 | ** |  | FR | IHS Markit Manufacturing PMI (f) |
| 01/02/2023 | 0855/0955 | ** |  | DE | IHS Markit Manufacturing PMI (f) |
| 01/02/2023 | 0900/1000 | ** |  | EU | IHS Markit Manufacturing PMI (f) |
| 01/02/2023 | 0930/0930 | ** |  | UK | S&P Global Manufacturing PMI (Final) |
| 01/02/2023 | 1000/1100 | *** | | IT | HICP (p) |
| 01/02/2023 | 1000/1100 | *** | | EU | HICP (p) |
| 01/02/2023 | 1000/1100 | ** | | EU | Unemployment |
| 01/02/2023 | 1200/0700 | ** |  | US | MBA Weekly Applications Index |
| 01/02/2023 | - | *** | | US | Domestic-Made Vehicle Sales |
| 01/02/2023 | 1315/0815 | *** | | US | ADP Employment Report |
| 01/02/2023 | 1445/0945 | *** | | US | IHS Markit Manufacturing Index (final) |
| 01/02/2023 | 1500/1000 | *** | | US | ISM Manufacturing Index |
| 01/02/2023 | 1500/1000 | * | | US | Construction Spending |
| 01/02/2023 | 1500/1000 | ** | | US | JOLTS jobs opening level |
| 01/02/2023 | 1500/1000 | ** | | US | JOLTS quits Rate |
| 01/02/2023 | 1530/1030 | ** | | US | DOE Weekly Crude Oil Stocks |
| 01/02/2023 | 1900/1400 | *** | | US | FOMC Statement |
Why MNI
MNI is the leading provider
of intelligence and analysis on the Global Fixed Income, Foreign Exchange and Energy markets. We use an innovative combination of real-time analysis, deep fundamental research and journalism to provide unique and actionable insights for traders and investors. Our "All signal, no noise" approach drives an intelligence service that is succinct and timely, which is highly regarded by our time constrained client base.Our Head Office is in London with offices in Chicago, Washington and Beijing, as well as an on the ground presence in other major financial centres across the world.