
Why MNI
MNI is the leading provider
of intelligence and analysis on the Global Fixed Income, Foreign Exchange and Energy markets. We use an innovative combination of real-time analysis, deep fundamental research and journalism to provide unique and actionable insights for traders and investors. Our "All signal, no noise" approach drives an intelligence service that is succinct and timely, which is highly regarded by our time constrained client base.Our Head Office is in London with offices in Chicago, Washington and Beijing, as well as an on the ground presence in other major financial centres across the world.
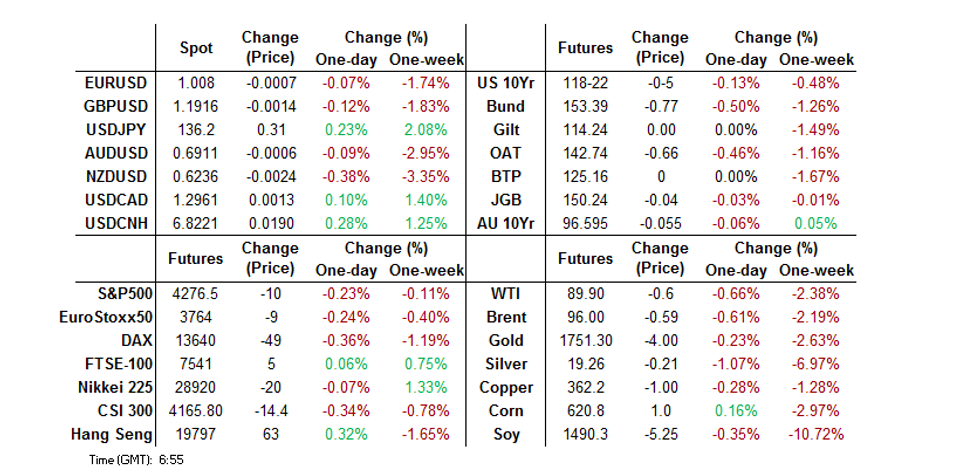
- The USD was better bid, sitting atop the G10 FX table. Asia FX was weaker against the greenback as USD/CNH edged closer to YtD highs on a lack of PBoC pushback when it comes to the latest move higher in USD/CNY, as the fix cleared the CNY6.80 level. Vol markets remain fairly calm though, so the market isn't expecting fireworks at this stage., although the well-documented Chinese economic headwinds present a clear risk for the yuan.
- Global core FI markets leaked lower, excluding JGBs, with a bid in the super-long end of that curve indicative of continued demand from Japanese lifers & pension funds.
- Looking ahead, UK and Canadian retail sales data round off the week. Elsewhere, Fedspeak is due from Richmond Fed President Barkin.
US TSYS: Bear Flattening Overnight
TYU2 is -0-06 at 118-21 ahead of London dealing, 0-01+ off the base of its 0-10 Asia-Pac range, on limited volume of ~51K. Cash Tsys run 2-4bp cheaper across the curve, bear flattening after yesterday’s bull steepening.
- Early cash Tsy trade saw some light cheapening aided by news that Chinese President Xi & Russian President Putin will be attending the G20 summit in Indonesia, which is due to take place in November. A reminder that there is an expectation that U.S. President Biden will speak with Xi in South East Asia in November, owing to previous press reports and the U.S. confirming that planning for such a meeting is underway. In addition, the Kremlin had previously flagged Putin’s desire to attend the November summit, meaning that this headline flow doesn’t come as much of a shock. Cross-asset moves aren’t definitively risk-off or -on in nature, with e-minis marginally lower, the USD bid and Tsys cheaper. Note that some suggested that Putin’s presence could bolster the Sino-Russian power axis at the meeting, with no firm consensus amongst the remainder of the G20 re: his attendance of the summit (although we don’t believe such a view is driving market moves given the leg higher in USD/JPY, with the USD strength aided by a technical break through Thursday’s high in the BBDXY).
- The cheapening then extended later in the session as Aussie bonds leaked lower, with little in the way of fresh, overt headline drivers noted (next week’s AOFM issuance schedule perhaps provided some background pressure for ACGBs).
- Friday’s NY session will be headlined by Fedspeak from Richmond Fed President Barkin (’24 voter).
JGBS: Futures Cheapen A Little, Long End Remains Bid, Lifers Likely At Work
JGBs were relatively resilient in the face of the broader downtick in core global FI markets, with futures down a mere 6 ticks on the day ahead of the bell after giving back a modest early uptick, while cash JGBs run flat to 3bp richer, with the curve flattening. 7s underperform on the curve owing to the downtick in futures, while super-long end outperformance has been evidence from early Tokyo trade, with the resilience likely a clue re: continued domestic lifer & pension demand when it comes to the longer end of the JGB curve.
- Domestic headline flow remains limited, with the only real point of note being the 0.2ppt uptick observed across each of the 3 major Y/Y CPI readings (which was in line with exp., outside of the CPI excluding fresh food and energy measure, which provided a 0.1ppt beat vs. expectations). Note that the excluding fresh food and energy measure remains some way shy of the BoJ's 2% target, operating at +1.2% Y/Y.
- Monday’s docket lacks any meaningful events of note.
AUSSIE BONDS: Bear Steepening
ACGBs sit a little off session lows after cheapening throughout the Sydney session, more than unwinding the limited bull steepening in Aussie bond futures overnight. The move lower was aided in part by a modest early downtick in U.S. Tsys (fleshed out elsewhere), with little in the way of overt macro headline drivers and local economic data releases to further explain the move lower later in the day. Cash ACGBs run 5.0-6.5bp cheaper across the curve, bear steepening. YM and XM are -4.0 and -6.0, respectively, after breaching their overnight lows and deal a shade above worst levels of the Sydney session. The 3-/10-Year EFP box is steeper, with 3-Year EFP little changed and 10-Year EFP wider, while Bills run +1 to -10 through the reds, twist steepening.
- The AOFM’s weekly issuance slate announced for next week will see a total A$1.8bn in ACGBs and A$2.5bn of Notes on offer. Aussie bonds moved lower after the release, with the step up in ACGB DV01 on offer possibly aiding the weakness, which accelerated on the aforementioned break of overnight lows in YM & XM.
- The latest round of ACGB Nov-27 supply went well, with the weighted average yield printing 2.68bp through prevailing mids (per Yieldbroker) while the cover ratio improved to 3.41x, bouncing from the 2.53x seen previously (albeit with a lower amount on offer at today’s auction). Outright yield levels were sufficient to drive demand at the auction despite their recent move away from cycle cheaps, with the cheapness of 5s against 3s and 10s (in z-spread terms) providing another positive for smooth digestion.
- Monday’s local docket will see A$300mn of ACGB Jun-51 on offer, with no economic releases of note scheduled.
EUROZONE: Fragmentation Risks Have Dialed Down On Multiple Fronts #1
As long as the Eurozone lacks the fully fledged architecture of a single currency area - notably full banking union (including mutualised deposit insurance) and a centralised fiscal authority (with permanent risk-sharing and cross-border fiscal transfers) - fragmentation risks will never be fully eradicated. However, the ECB's ever expanding toolkit and frequent policy innovations have mitigated short-term pressures. In the following charts we present evidence of a containment of fragmentation risks on multiple fronts since the sovereign debt crisis.
- Most references to fragmentation refer explicitly to the bond market which has provided the most visible signs of stress between the core and periphery. On this front, the current situation is a world away from the sovereign debt crisis and notably less stressed than when the Italian government squared off against Brussels in 2018 over the proposed expansionary fiscal budget.
- While uncertainty over how and when the ECB will activate the Transmission Protection Instrument may partly explain why periphery-core spreads remain elevated, the mere existence of the tool has arguably prevented spreads widening further. As we suggested in our review of the July ECB meeting "the ECB now has a tool unlimited in size, that it can use with complete discretion, with activation criteria that are deliberately vague, and everybody around the table supports it".
- Following in the footsteps of the TLTROs, OMT, APP and PEPP, the TPI marks the latest evolution of the ECB's toolkit which has anchored spreads since the sovereign debt crisis.
- The relative improvement in risk premia over the past decade is also reflected in CDS prices and implied default probabilities. In Fig 2, we provide estimates of the 5-year implied default probability under the assumption of a 40% recovery rate and near-zero risk-free rate. As the chart shows, implied default probabilities are a fraction of what they were at the height of the debt crisis.
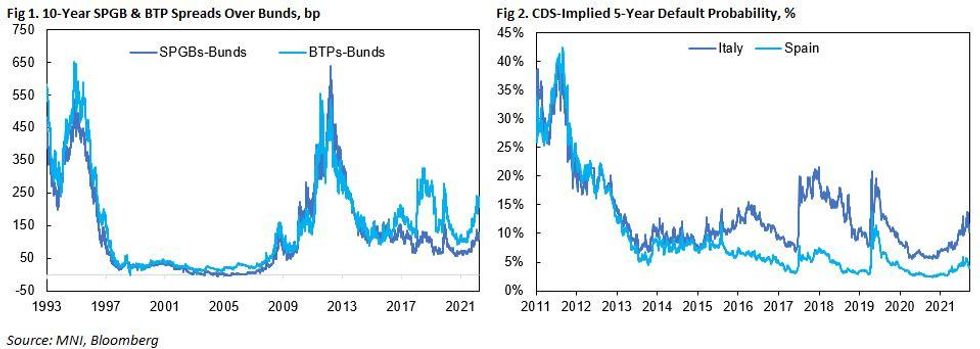
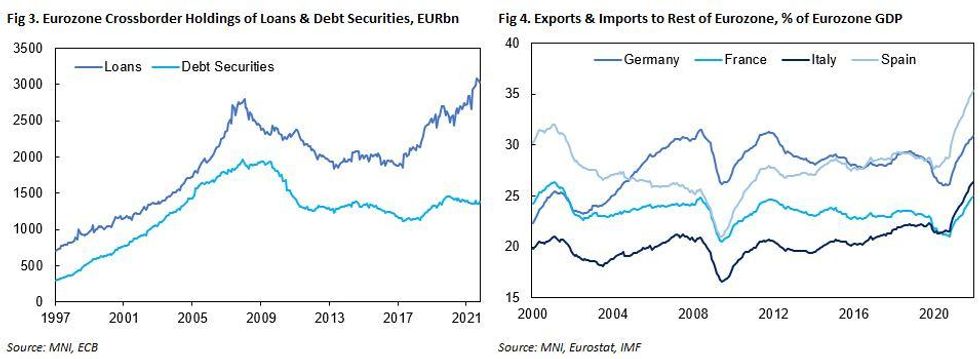
- In Fig 3 we show the total cross-border holdings of loans and debt securities in the eurozone. During the sovereign debt crisis cross-border holdings noticeably fell, raising the risk of a de facto financial balkanisation of the euro area. During this period, concerns among creditors and national regulators about exposures to foreign banks and government debt underpinned a shift towards asset onshoring inside national borders. However, the situation today is again markedly different from that era with cross-border lending surpassing pre-crisis peaks, while holdings of debt securities have stabilised.
- In Fig 4 we combine measures of trade openness (exports + imports as a % of GDP) with trade exposure (% trade concentration) by looking at the total exports and imports of four largest eurozone countries with the rest of the euro area, relative to GDP. During the debt crisis there was some evidence of regional trade deteriorating - particularly in Germany and France where total trade with the euro area fell relative to GDP - which likely reflected the weaker demand during the austerity years. Again, the situation today is markedly different with trade integration within the euro area appearing to deepen coming out of the pandemic, further suggesting that economic and financial fragmentation risks have materially fallen.
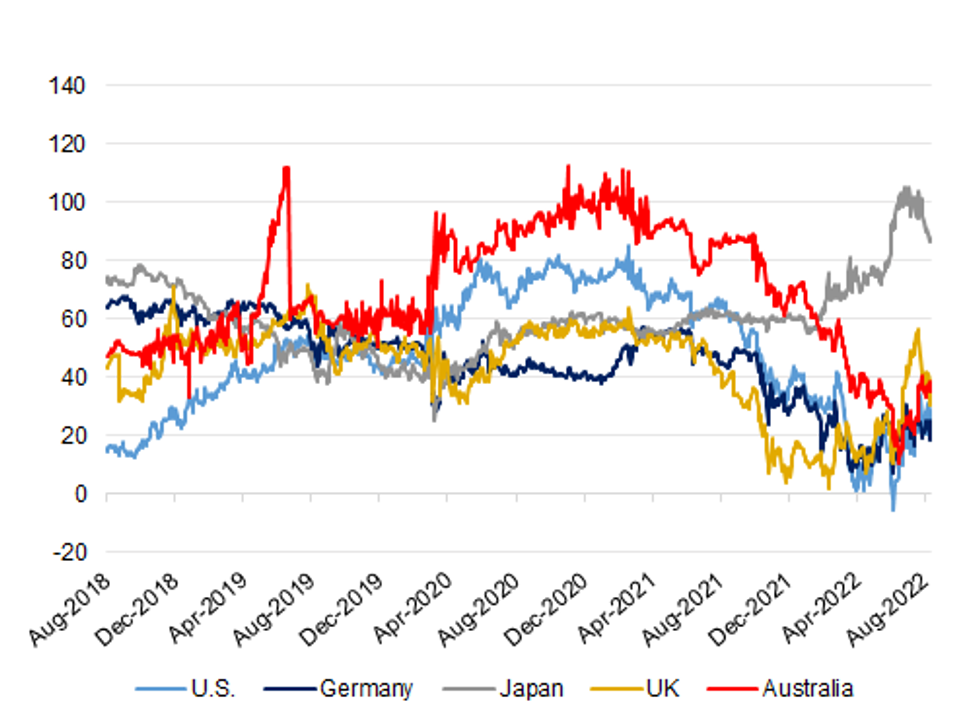
BONDS: Longer JGB Curve Flattening An Outlier Since Mid-June
A quick eyeball of the 10-/30-Year yield spreads across some of the major core global FI markets shows that the Japanese 10-/30-Year yield spread has moved away from cycle steeps registered in mid-June, with the rest of the 10-/30-Year yield spreads that we have chosen (U.S., German, UK and Australian) all operating off of their cycle flats, albeit with the UK variant pulling flatter in recent sessions owing to increased stagflationary worry and a related uptick in BoE tightening premium priced into money markets. What are the driving factors for the JGB curve?:
- Increased recession worry centred on the U.S. & Europe, driving yields lower, but the flattening impulse hasn’t been observed in the remaining core FI global markets over the horizon in question, so there must be something else at play.
- Mid-June saw the challenge and ultimately successful defence of the BoJ’s existing YCC parameters with the subsequent insistence that the Bank remains on hold until meaningful underlying inflationary pressures emerge (with a formal easing bias maintained). Foreign investors were the key party in the challenge with subsequent data revealing notable short selling of JGBs by that particular cohort ahead of the Bank’s June meeting as speculation surrounding the potential for a hawkish move stepped up, followed by short covering in the weeks that have followed. The fact that the BoJ has less relative control beyond the 10-Year point of the curve allowed the test of the BoJ to be amplified by a steepening of the curve, with flows in swaps also noted at the time of the challenge. The recent short covering could have aided the flattening in question.
- Another idiosyncratic factor has been the willingness of domestic life insurers to deploy capital in the longer end of the JGB curve (as alluded to in their semi-annual investment interviews), with pension funds and lifers shedding a record amount of foreign bonds in the month of July (per JSDA data), as Japan experienced deployed a record stretch of weekly net sales of foreign paper, owing to market volatility and elevated FX-hedging costs. That trend has started to turn recently, with Japan registering purchases of foreign bonds in each of the last 4 weeks (albeit in relatively limited terms when compared to the net sales that came before).
- The previous steepness of the curve, in both a domestic and international sense, added to aforementioned demand from the domestic lifer and pension community, who have likely been the min driver of the recent curve flattening.
 Source: MNI - Market News/Bloomberg
FOREX: Dollar Back To Mid July Highs
The USD has continued to strengthen, with the DXY at +0.20% above NY closing levels, putting the index at 107.70, fresh highs back to around mid-July.
- We highlighted earlier that DXY trends this past week have generally been outperforming US yield momentum. However, as the session has progressed we have seen yields moving higher in this space. The US 2yr is up nearly 4bps to 3.24% at the time of writing. The 10yr is +2bps to 2.91%.
- Aggregate US data surprises continue to trend higher, while there is also focus on next week's Jackson Hole Symposium, where Powell will speak on Friday (the 26th of August).
- Japan inflation data came in close to expectations, with a modest upside surprise to core (ex energy) +1.2%, versus +1.1% expected. There was no reaction in JPY though. USD/JPY spiked above 136.00 in early trade and has stayed above this level for the session (last 136.20).
- Some USD strength was attributed to plans for Xi and Putin to attend the G20 meeting in Indonesia, later this year. The meeting could serve to bolster the Sino-Russian power axis, although price action today in terms of higher USD/JPY levels is not consistent with such a backdrop.
- AUD and NZD are both lower, although more so Kiwi, as the trade position remained comfortable in deficit. NZD/USD fell to sub 0.6230 before support kicked in. The AUD/NZD cross has pushed higher to 1.1080, but can't gain a foothold above this level. AUD/USD's dip sub 0.6900 was supported (last at 0.6910).
- Looking ahead, UK and Canadian retail sales data round off the week. There is no US data on Friday which should keep any FedSpeak and geopolitical developments in focus.
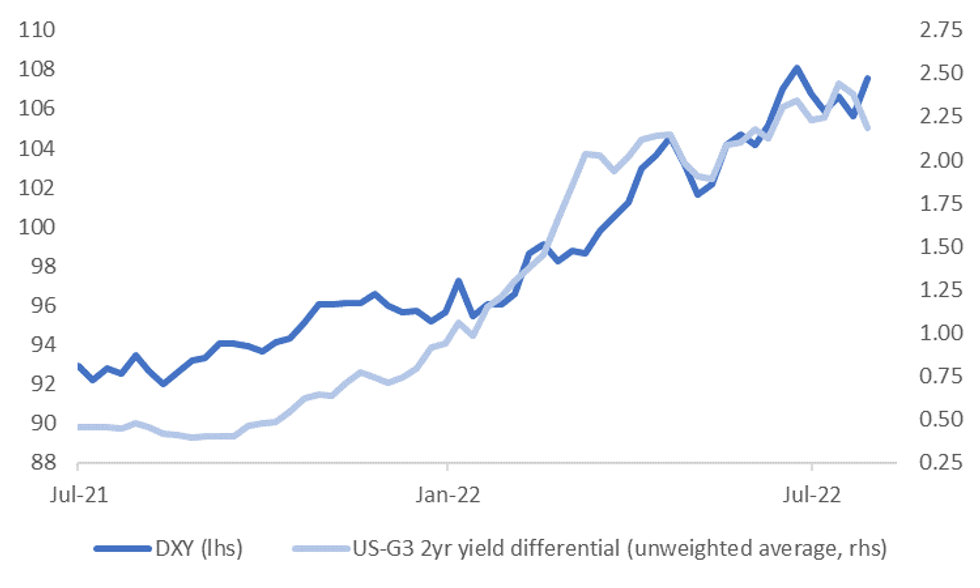
USD: USD Outperforming Yield Momentum, But Data Surprises Still Trending Higher
Current levels of the DXY index, near 107.60, would put weekly gains for the USD at just over 1.80%. This would be the strongest weekly gain for the index since early June. This week's strength is a little at odds with relative yield momentum. The first chart below overlays the DXY against the US-G3 average yield differential for the 2yr tenor. This is the opposite image to when we last presented this chart, when the USD index looked too low relative to yields.
Fig 1: DXY Index Versus US-G3 Yield Differential (2yr Tenor, Unweighted Average)
 Source: MNI/Market News/Bloomberg
- This past week the yield differential has dropped by around 20bps for the 2yr tenor, on average. Looking at the 10yr yield differential points to a more modest drop of 5bps over the past week. However, the correlation has been stronger with the 2yr differential this year (91%), versus the 10yr (78%).
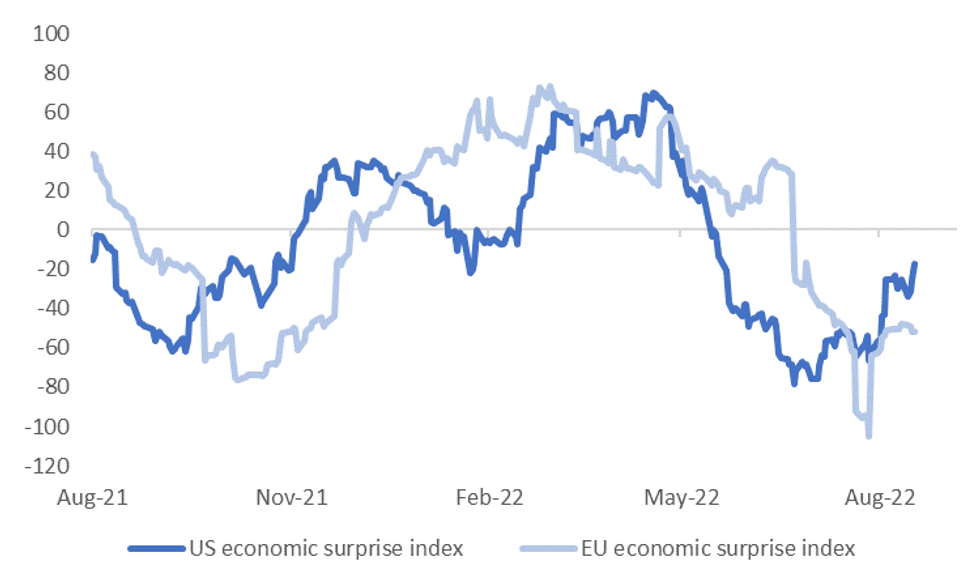
- One clear positive for the USD has been the on-going improvement in data momentum, at least at the aggregate level. The second chart below plots the Citi EASI readings for both the US and the EU. China's EASI is also off recent highs given the weaker than expected activity data from the start of the week. The bias has been to further revise down 2022 growth expectations for China.
- Although obviously such trends haven't been reflected in relative yield performance over the past week.
- All else equal, we might expect upside USD momentum to ease if we don't see some catch up in the yield space. On-going positive data surprises would help, but clearly there will also be a lot of focus on next week's Jackson Hole symposium, where Chair Powell will speak on Friday (the 26th of August).
Fig 2: Citi US & EU EASIs
 Source: Citi/MNI/Market News/Bloomberg
AUDNZD: Dips Post RBNZ Have Been Supported
AUD/NZD is back to the top end of its range for the past week or so. We currently sit at 1.1075. We haven't been able to see much topside beyond the 1.1080 level over this period and beyond this is the earlier August highs around 1.1125. Still, the cross is back above both the 100 day MA (1.1019) and the 50 day (1.1055). We are also around 0.75% above the post RBNZ lows (~1.0990).
- Yield momentum is shifting back in favor of the A$, albeit with spreads still within familiar ranges. The 2yr swap spread is back to -50bps versus -63bps immediately post RBNZ.
- The other differentiator has been the morning's NZ trade figures for July, which continues to highlight the divergence in relative current account backdrops between the two economies. NZ is posting record wide trade deficits (for the past 12 months) against Australia's record trade surpluses.
- It may be the case that the yield differential needs to break higher in AUD's favor to push the cross to sustainable higher levels (above 1.1100, challenging 1.1200 etc). However, dips could still be supported given the relative current account differential.
- Next week's calendar is light in Australia, with just the preliminary PMIs on tap for August (out on Tuesday). There will be slightly more interest in NZ releases, with Q2 retail sales volumes out (market expects a 1.7% rise, versus -0.5% in Q1). This data is out on Wednesday, followed by the ANZ consumer confidence number on Thursday.
ASIA FX: Broad Based USD/Asia Gains
USD/Asia pairs are higher across the board, amid broad based USD gains. USD/KRW has spiked to fresh cyclical highs, while USD/CNH is edging closer to a test of the previous YTD high (6.8380).
- CNH: USD/CNH has broken to fresh weekly highs through 6.8200. We have stopped short of a test above 6.8300, but the near term focus will be on test of previous YTD highs of 6.8380. Vol markets remain fairly calm though, so the market isn't expecting fireworks at this stage. Onshore equities have been mixed, while the bias for bond yields remains skewed to the downside. The 2yr is back to 2.05%, but isn't seeing a sharp move lower.
- KRW: Spot USD/KRW hit fresh cyclical highs in early trade, getting close to 1329 before selling interest emerged. The pair is around +0.50% above yesterday's close. Onshore equities are weaker, -0.50% for the Kospi and -1.10% for the Kosdaq.
- INR: Spot USD/INR has nudged higher in the first part of trading, sitting close to 79.75. This is close to fresh highs for the month, although remains sub the 80.00 level. The 1 month USD/INR NDF has tried to push above this level, but hasn't been able to do so convincingly yet. The overnight rebound in crude prices isn't helping.
- IDR: USD/IDR opened higher and has generally held these gains, last at +31 figs to 14864. Q2 current account data was close to expectations ($3.9bn versus $4.5bn expected), and 1.1% of GDP. The authorities are considering a tax on nickel exports this year, which has weighed on sentiment at the margin. President Jokowi has also stated he supports a change in the BI mandate, which would include supporting jobs growth.
- PHP: USD/PHP has drifted higher, in line with the broader USD trend. The pair did find selling resistance above 56.00 though, last at 55.955. BSP Governor Medalla stated inflation expectations should be anchored following a cumulative 175bps in hikes. Further hikes are likely to be in 25bps increments. However, the central bank will delay plans to cut the RRR.
- THB: USD/THB is flirting with a break back above the 50-day MA (35.71), with current spot at 35.73 (+0.34% for the session). The Thai PM stated that an emergency decree is still necessary to contain the spread of Covid. The measure is expected to expire end-September though. Thai equities are down modestly, but net equity inflow momentum from offshore investors has been positive this week. We have had +$636.7mn in net inflows, just over half the sum seen in August to date.
EQUITIES: Mixed In Asia; Chinese Developers Gain Ahead Of PBOC LPR Fixing
Chinese, Japanese, and Australian equity index benchmarks sit little changed at writing, with a lacklustre showing from Wall St. on Thursday providing little direction for regional equities (major cash indices closed 0.1-0.2% firmer). Stocks of Chinese developers were notably bid, with participants eyeing the PBOC’s benchmark LPR fixing next week (with BBG median estimates calling for a cut to rates).
- The Hang Seng outperformed, dealing 0.6% firmer at typing, aided by a strong showing from China-based tech (HSTECH: +1.1%), adding to gains in the properties (+0.5%) and finance (+0.5%) sub-gauges. Some pre-earnings optimism may have also fed into the bid, with the likes of Orient Overseas (+3.5%) and China Merchants Bank (+1.0%) outperforming ahead of their respective earnings calls later today.
- The CSI300 is little changed after falling by as much as 0.5% earlier, with the benchmark index on track to close virtually unchanged on the week at current levels. A rebound in the consumer staples (+1.1%) sub-index (after a 1.5% lower close on Thursday) was offset by shallow weakness in consumer discretionary and healthcare stocks, while elsewhere, Chinese tech equities are mostly lower,
- The Nikkei 225 sits 0.1% better off at writing, back from as much as 0.7% higher earlier. The benchmark index is set for its third higher weekly close, with major export-oriented names contributing most to the move higher, aided by recent weakness in the JPY.
- E-minis sit 0.1-0.2% worse off at writing, having traded comfortably within Thursday’s range in a fairly directionless Asia-Pac session.
GOLD: Fresh Two-Week Lows In Asia; Test Of Key Support Eyed
Gold deals ~$3/oz weaker to print ~$1,756/oz, a little above two-week lows made earlier in the session amidst an uptick in the USD, with the DXY trading just shy of fresh one-month highs at writing.
- The limited move lower in gold comes after headlines re: the attendance of Russian Pres Putin and Chinese Pres Xi at the G20 summit in November, with the event possibly contributing to the aforementioned bid in the USD, while nominal U.S. Tsy yields have edged a little higher as well (details fleshed out in earlier bullets).
- Gold is on track for its first weekly decline in five, with recent Dollar strength and debate re: the size of incoming Fed rate hikes remaining in focus for the space.
- Elsewhere, Chinese imports of gold from major refiner Switzerland has hit a five-year high for the month of July, with the rise in demand attributed to the relaxation of domestic COVID measures.
- From a technical perspective, gold’s move lower has taken it to the threshold of key short-term support at $1,754.4/oz (Aug 3 low), with a clear break of that level potentially exposing further support at $1,711.7/oz (Jul 27 low).
OIL: On Track For Lower Weekly Close; Supply Outlook Remains Tight
WTI and Brent are ~$0.40 weaker apiece, backing away from their respective Thursday peaks at writing. Both benchmarks remain on track for a lower weekly close but are off multi-month lows made earlier in the week, having found some poise in recent sessions after U.S. inventory data pointed to persistent tightness in crude supplies, with wider optimism re: increases to global supplies of oil moderating from their extremes as well.
- To recap, WTI and Brent closed between $2-3 firmer on Thursday for a second consecutive higher daily close, drawing support from a moderation in demand destruction worry from better-than-expected prints for the Philly Fed survey and jobless claims (both initial and continuing).
- OPEC Sec Gen al-Ghais on Thursday said that the demand for crude remains “robust” despite the group reducing its forecast for demand growth in ‘22 to 3.1mn bpd last week, while also hinting at possible production cuts in coming OPEC+ meetings “if necessary”.
- Turning to supply matters, Argus source reports on Thursday re: OPEC+ compliance pointed to the group missing collective output targets by ~2.9mn bpd for July, highlighting consistent production problems amongst some members.
- Elsewhere, preliminary data from analytics firm Kpler has shown Russian crude exports for Aug so far remaining above levels observed prior to the Russia-Ukraine war for a fifth straight month, pointing to the limited impact of Western sanctions so far. Further measures are however expected to kick in in H2 ‘22 (e.g. EU’s ban on Russian oil and shipping insurance), potentially affecting >3mn bpd in current crude exports.
- Little by way of fresh, discernible progress has been made towards a U.S.-Iran nuclear deal, with the Biden administration yet to formally comment on the EU’s “final draft”.
UP TODAY (Times GMT/Local)
| Date | GMT/Local | Impact | Flag | Country | Event |
| 19/08/2022 | 0600/0700 | *** |  | UK | Retail Sales |
| 19/08/2022 | 0600/0700 | *** | | UK | Public Sector Finances |
| 19/08/2022 | 0600/0800 | ** |  | DE | PPI |
| 19/08/2022 | 0800/1000 | ** |  | EU | EZ Current Acc |
| 19/08/2022 | 1230/0830 | ** |  | CA | Retail Trade |
| 19/08/2022 | 1300/0900 |  | US | Richmond Fed's Tom Barkin |
Why MNI
MNI is the leading provider
of intelligence and analysis on the Global Fixed Income, Foreign Exchange and Energy markets. We use an innovative combination of real-time analysis, deep fundamental research and journalism to provide unique and actionable insights for traders and investors. Our "All signal, no noise" approach drives an intelligence service that is succinct and timely, which is highly regarded by our time constrained client base.Our Head Office is in London with offices in Chicago, Washington and Beijing, as well as an on the ground presence in other major financial centres across the world.