
Free Trial
Why MNI
MNI is the leading provider
of intelligence and analysis on the Global Fixed Income, Foreign Exchange and Energy markets. We use an innovative combination of real-time analysis, deep fundamental research and journalism to provide unique and actionable insights for traders and investors. Our "All signal, no noise" approach drives an intelligence service that is succinct and timely, which is highly regarded by our time constrained client base.Our Head Office is in London with offices in Chicago, Washington and Beijing, as well as an on the ground presence in other major financial centres across the world.
Bitcoin has managed to deliver spectacular returns over the past year. An overview of the medium-term technical conditions using the Hurst cycle approach and shorter-term price dynamics using the point and figure chart on the 60-min frequency highlights some key trend features for the next 2-4 week time horizon.
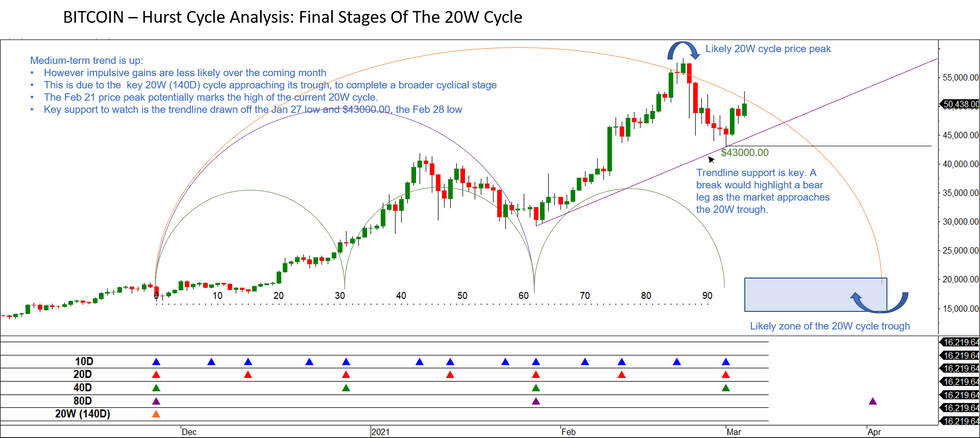
- An observation of the Hurst cycle, suggests that the key 20W cycle that began Nov 26, 2020 has entered the final quarter of its phase and is approaching its trough. This means that the cycle trough will likely occur sometime around early April.
- For price, this means that while the medium-term trend remains up, impulsive rallies are less likely over the coming month
- This is because the 20W(140D) cycle is approaching its trough, to complete the current broader cycle. In other words, the 20W cycle has crossed its peak and is falling, suggesting a period where price rallies are more difficult to sustain.
- The Feb 21 high potentially marks the price peak of the current 20W cycle.
- Key support to watch is the cycle related trendline drawn off the Jan 27 low and $43000, the Feb 28 low.
- A break would suggest a deeper corrective phase.
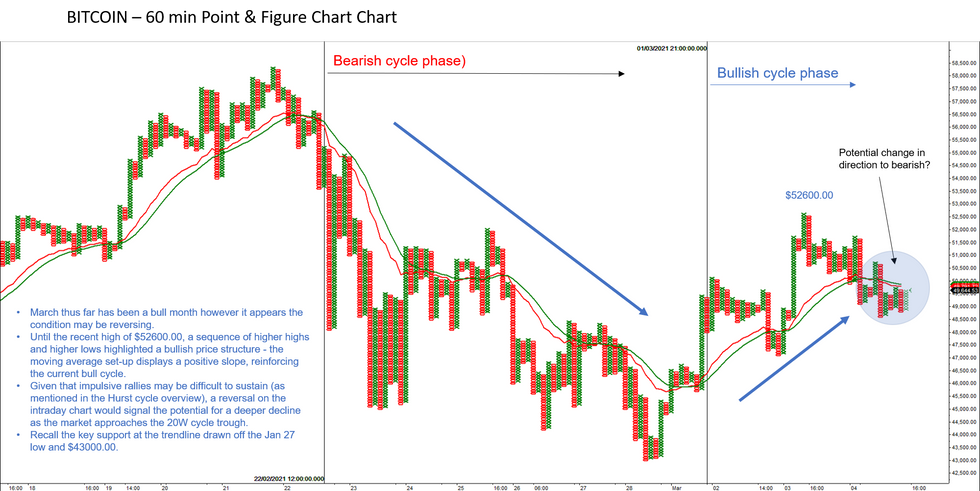
Looking at the intraday frequency (60-mins), a point and figure chart clearly highlights recent intraday swings and the direction in price.
- March thus far has been a bull month however it appears the condition may be reversing.
- Until the recent high of $52600.00, a sequence of higher highs and higher lows highlighted a bullish price structure - the moving average set-up displays a positive slope , reinforcing the current bull cycle.
- Given that impulsive rallies may be difficult to sustain (as mentioned in the Hurst cycle overview), a reversal on the intraday chart would signal the potential for a deeper decline as the market approaches the 20W cycle trough.
- Recall the importance of the key support at the trendline drawn off the Jan 27 low and $43000.
To conclude, the broader trend remains bullish.
- However as the market approaches the trough of the key 20W cycle, gains are likely to be difficult to maintain during the next 2-4 week time horizon.
- The 60-min point and figure chart highlights recent intraday swings. A reversal to bearish would suggest scope for a deeper sell-off.
- The trendline drawn off the Jan 27 low highlights an initial key support. Today, the line intersects at $44839.
Why MNI
MNI is the leading provider
of intelligence and analysis on the Global Fixed Income, Foreign Exchange and Energy markets. We use an innovative combination of real-time analysis, deep fundamental research and journalism to provide unique and actionable insights for traders and investors. Our "All signal, no noise" approach drives an intelligence service that is succinct and timely, which is highly regarded by our time constrained client base.Our Head Office is in London with offices in Chicago, Washington and Beijing, as well as an on the ground presence in other major financial centres across the world.
We are facing technical issues, please contact our team.
ok
Your request was sent sucessfully! Our team will contact you soon.
ok