-
Policy
Policy
Exclusive interviews with leading policymakers that convey the true policy message that impacts markets.
LATEST FROM POLICY: -
EM Policy
EM Policy
Exclusive interviews with leading policymakers that convey the true policy message that impacts markets.
LATEST FROM EM POLICY: -
G10 Markets
G10 Markets
Real-time insight on key fixed income and fx markets.
Launch MNI PodcastsFixed IncomeFI Markets AnalysisCentral Bank PreviewsFI PiFixed Income Technical AnalysisUS$ Credit Supply PipelineGilt Week AheadGlobal IssuanceEurozoneUKUSDeep DiveGlobal Issuance CalendarsEZ/UK Bond Auction CalendarEZ/UK T-bill Auction CalendarUS Treasury Auction CalendarPolitical RiskMNI Political Risk AnalysisMNI Political Risk - US Daily BriefMNI Political Risk - The week AheadElection Previews -
Emerging Markets
Emerging Markets
Real-time insight of emerging markets in CEMEA, Asia and LatAm region
-
Commodities
-
Credit
Credit
Real time insight of credit markets
-
Data
-
Global Macro
Global Macro
Actionable insight on monetary policy, balance sheet and inflation with focus on global issuance. Analysis on key political risk impacting the global markets.
Global MacroDM Central Bank PreviewsDM Central Bank ReviewsEM Central Bank PreviewsEM Central Bank ReviewsBalance Sheet AnalysisData AnalysisEurozone DataUK DataUS DataAPAC DataInflation InsightEmployment InsightGlobal IssuanceEurozoneUKUSDeep DiveGlobal Issuance Calendars EZ/UK Bond Auction Calendar EZ/UK T-bill Auction Calendar US Treasury Auction Calendar Global Macro Weekly -
About Us
To read the full story
Sign up now for free trial access to this content.
Why MNI
MNI is the leading provider
of intelligence and analysis on the Global Fixed Income, Foreign Exchange and Energy markets. We use an innovative combination of real-time analysis, deep fundamental research and journalism to provide unique and actionable insights for traders and investors. Our "All signal, no noise" approach drives an intelligence service that is succinct and timely, which is highly regarded by our time constrained client base.Our Head Office is in London with offices in Chicago, Washington and Beijing, as well as an on the ground presence in other major financial centres across the world.
Real-time Actionable Insight
Get the latest on Central Bank Policy and FX & FI Markets to help inform both your strategic and tactical decision-making.
Free AccessMNI China Daily Summary: Wednesday, March 12
MNI BRIEF: EU Targets Retaliation Tariffs On US Red States
MNI BRIEF: EU Working On New Trade Retaliation Steps Vs US
MNI Markets Analysis: Bitcoin Bears Pause For Breath
Bitcoin price has settled down, relatively speaking, since the sharp sell-off from the 13-Apr high when it was trading above $60000.00. In recent notes, we have evaluated trend conditions in BTC using the Hurst cycle approach. In this overview, we will apply pattern and moving average analysis to assess the current trend structure.
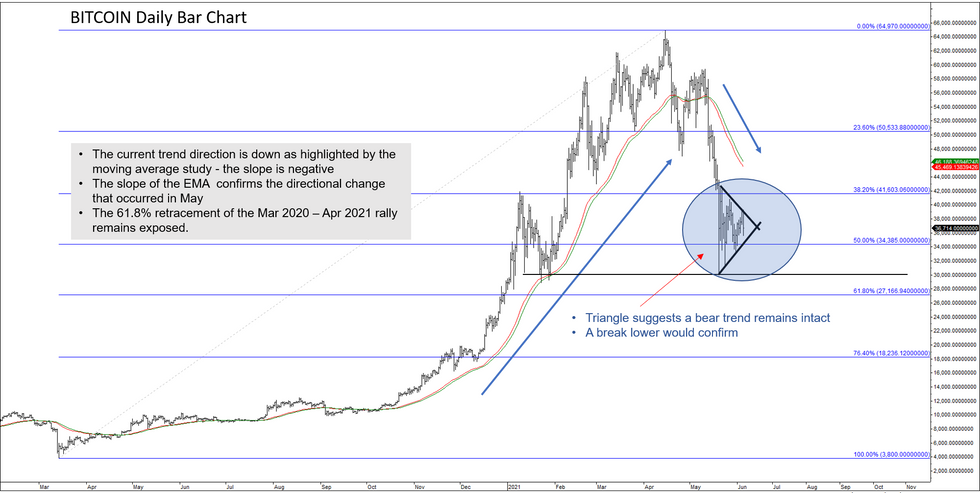
- BTC sold off from around $64970 to $30010 between Apr - May, a 53.81% depreciation.
- This represents the first meaningful reversal of the runaway uptrend that started mid-Mar 2020. The reversal has thus far retraced almost 61.8% of the Mar 2020 - Apr 2021 rally.
- One key trend identifier we monitor is the slope of a moving average study. This approach uses a 50-day exponential moving average (EMA). A second average is calculated, a 5-period EMA of the 50-day EMA and the position of the two averages determines the slope.
- The chart clearly shows how the EMA slope shifted to positive in May 2020 and when it reversed last month.
- A positive sloping EMA condition suggests the trend is up and the reverse is true for a downtrend. The current slope condition is negative and this suggests the trend remains down.
- Since the May 19 low, price appears to be trading within a triangular formation. A triangle is a continuation pattern and if correct, suggests the recent sharp sell-off, even if it does represent a correction, has more ground to cover. A pattern breakout to the downside would confirm a resumption of weakness.
- The technical studies suggest BTC remains bearish and has the potential to test the 61.8% retracement of the Mar 2020 - Apr 2021 rally at $27167.00. A break of the $30000.00 level would strengthen the bearish case.
- In terms of resistance, the first major point of reference is at the $46188.00 level. This is resistance highlighted by the EMA study.

To read the full story
Sign up now for free trial access to this content.
Why MNI
MNI is the leading provider
of intelligence and analysis on the Global Fixed Income, Foreign Exchange and Energy markets. We use an innovative combination of real-time analysis, deep fundamental research and journalism to provide unique and actionable insights for traders and investors. Our "All signal, no noise" approach drives an intelligence service that is succinct and timely, which is highly regarded by our time constrained client base.Our Head Office is in London with offices in Chicago, Washington and Beijing, as well as an on the ground presence in other major financial centres across the world.
