-
Policy
Policy
Exclusive interviews with leading policymakers that convey the true policy message that impacts markets.
LATEST FROM POLICY: -
EM Policy
EM Policy
Exclusive interviews with leading policymakers that convey the true policy message that impacts markets.
LATEST FROM EM POLICY: -
G10 Markets
G10 Markets
Real-time insight on key fixed income and fx markets.
Launch MNI PodcastsFixed IncomeFI Markets AnalysisCentral Bank PreviewsFI PiFixed Income Technical AnalysisUS$ Credit Supply PipelineGilt Week AheadGlobal IssuanceEurozoneUKUSDeep DiveGlobal Issuance CalendarsEZ/UK Bond Auction CalendarEZ/UK T-bill Auction CalendarUS Treasury Auction CalendarPolitical RiskMNI Political Risk AnalysisMNI Political Risk - US Daily BriefMNI Political Risk - The week AheadElection Previews -
Emerging Markets
Emerging Markets
Real-time insight of emerging markets in CEMEA, Asia and LatAm region
-
Commodities
-
Credit
Credit
Real time insight of credit markets
-
Data
-
Global Macro
Global Macro
Actionable insight on monetary policy, balance sheet and inflation with focus on global issuance. Analysis on key political risk impacting the global markets.
Global MacroDM Central Bank PreviewsDM Central Bank ReviewsEM Central Bank PreviewsEM Central Bank ReviewsBalance Sheet AnalysisData AnalysisEurozone DataUK DataUS DataAPAC DataInflation InsightEmployment InsightGlobal IssuanceEurozoneUKUSDeep DiveGlobal Issuance Calendars EZ/UK Bond Auction Calendar EZ/UK T-bill Auction Calendar US Treasury Auction Calendar Global Macro Weekly -
About Us
To read the full story
Sign up now for free trial access to this content.
Please enter your details below.
Why MNI
MNI is the leading provider
of intelligence and analysis on the Global Fixed Income, Foreign Exchange and Energy markets. We use an innovative combination of real-time analysis, deep fundamental research and journalism to provide unique and actionable insights for traders and investors. Our "All signal, no noise" approach drives an intelligence service that is succinct and timely, which is highly regarded by our time constrained client base.Our Head Office is in London with offices in Chicago, Washington and Beijing, as well as an on the ground presence in other major financial centres across the world.
Real-time Actionable Insight
Get the latest on Central Bank Policy and FX & FI Markets to help inform both your strategic and tactical decision-making.
Free AccessMNI UST Issuance Deep Dive: Dec 2024
MNI US Employment Insight: Soft Enough To Keep Fed Cutting
MNI ASIA MARKETS ANALYSIS: Jobs Data Green Lights Rate Cuts
MNI MARKETS ANALYSIS - Is the Copper Rally Over?
- The pullback from the 2021 highs in Copper accelerated Tuesday
- Copper is now over 10% off the all-time high printed in May at $4.899/lb
- Price now trades below the 50-day EMA support, exposing key trendline support
- Proxies for Chinese liquidity provide an effective leading indicator
- Net speculative positions have also waned and could suggest a further weakening of the outlook
COPPER TECHS: Is The Rally Over? A Look At The 50-Day EMA
Copper is under pressure today.
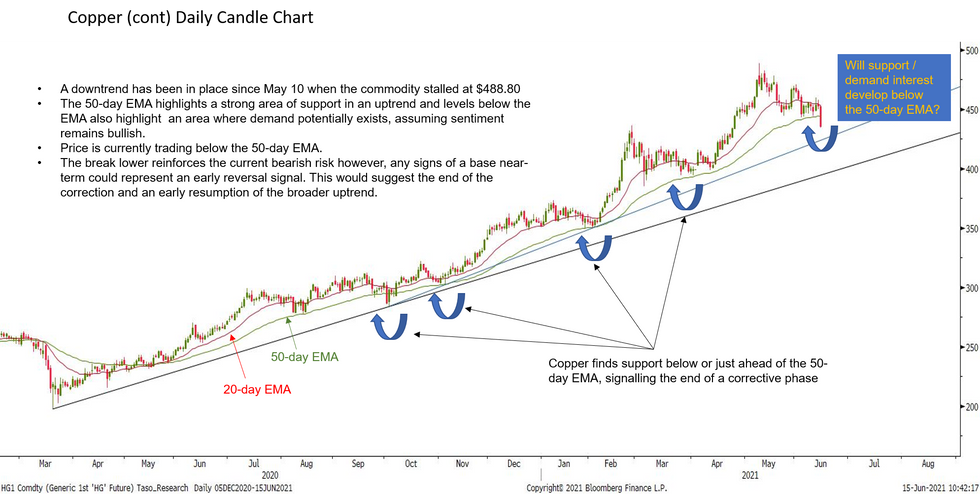
- A downtrend has been in place since May 10 when the commodity stalled at $488.80.
- The month-long downleg is likely a correction within a broader uptrend. However, today's sell-off has resulted in the break of the 50-day EMA.
- The 50-day EMA highlights a strong area of support in an uptrend, and levels below the EMA also highlight an area where demand potentially exists, assuming sentiment remains bullish.
- The chart below displays a number of instances, since March 2020, where a corrective pullback found support either below the 50-day EMA or just ahead of it.
- Price is currently trading below the 50-day EMA.
- The break lower reinforces the current bearish risk however, any signs of a base near-term could represent an early reversal signal. This would suggest the end of the correction and an early resumption of the broader uptrend.
- An extension lower though would expose three key support levels:
- SUP 1: 423.62 - Trendline support drawn off the Oct 2, 2020 low
- SUP 2: 394.19 - Trendline support drawn off the Mar 19, 2020 low
- SUP 3: 384.90 - Mar 4 low
- Currently, while the moving average overview remains in a bull-mode and price trades above both trendline supports, the current bear cycle is considered a correction. A change in the EMA set-up and a breach of trendline supports however, would alter the picture.

Is The Rally on Copper Over?
- In the past few months, we have seen that Chinese 'liquidity' has been contracting sharply, increasing investors' concern over the sustainability of the current market rally, especially in risky assets.
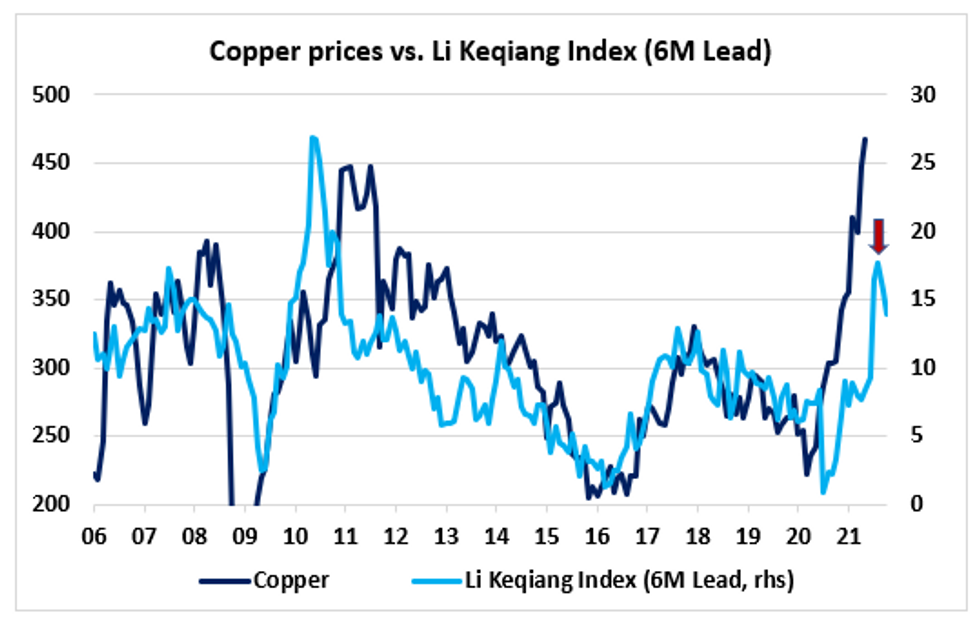
- Interestingly, the Li Keqiang Index, which is an economic measurement index that tracks China's economy using three indicators - railway cargo volume, electricity consumption and loans disbursed by banks - seems to also have peaked in February this year, which corresponds to the high reach in Chinese equities (CSI 300 Index is down 12% from its high reached in mid-February).
- It is very common that macro economists have their in-house measures that track Chinese economic activity as the GDP and industrial production numbers have often been criticized.
- This chart shows that the Li Keqiang Index has generally led copper prices by 6 months in the past 15 years (Index inception).

Source: Bloomberg/MNI
Copper Net Specs: Smart Money Is Following Chinese Liquidity
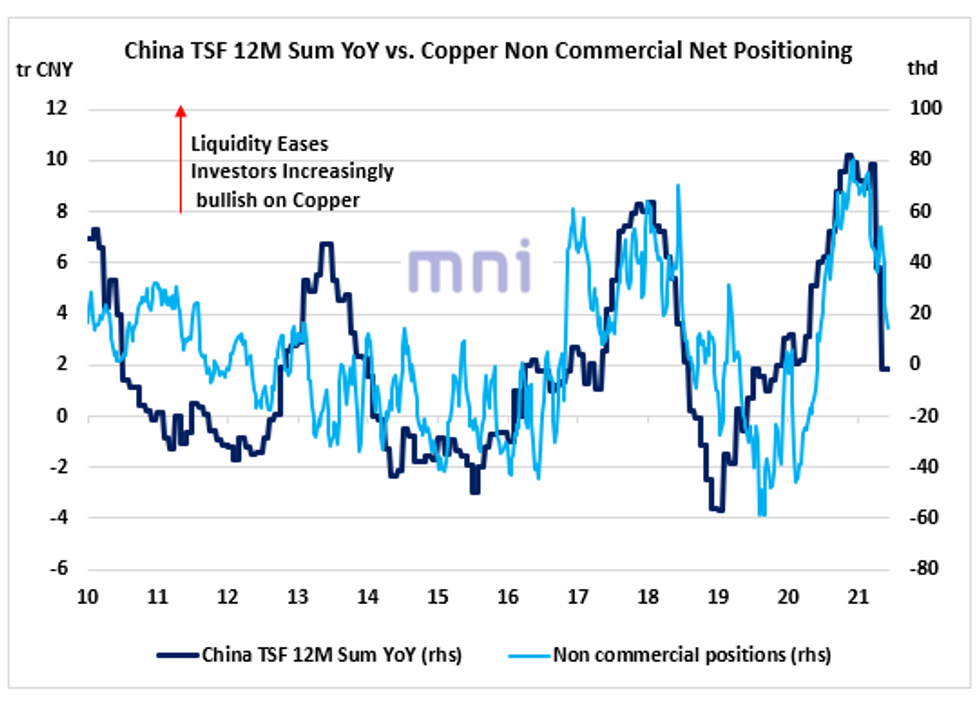
- Net specs positions on copper have significantly fallen since the start of the year as investors are worried that the global reopening will not be enough to offset the contraction in Chinese 'liquidity', which we define as the annual change in Total Social Financing (TSF) 12M sum.
- 'Smart money' investors seem to follow China liquidity and therefore have been reducing their exposition to risky assets in recent months.
- This chart shows how strongly China YoY change in liquidity has co-moved with copper net specs position in the past 7 years.

Source: Bloomberg/MNI
To read the full story
Sign up now for free trial access to this content.
Please enter your details below.
Why MNI
MNI is the leading provider
of intelligence and analysis on the Global Fixed Income, Foreign Exchange and Energy markets. We use an innovative combination of real-time analysis, deep fundamental research and journalism to provide unique and actionable insights for traders and investors. Our "All signal, no noise" approach drives an intelligence service that is succinct and timely, which is highly regarded by our time constrained client base.Our Head Office is in London with offices in Chicago, Washington and Beijing, as well as an on the ground presence in other major financial centres across the world.
