
Why MNI
MNI is the leading provider
of intelligence and analysis on the Global Fixed Income, Foreign Exchange and Energy markets. We use an innovative combination of real-time analysis, deep fundamental research and journalism to provide unique and actionable insights for traders and investors. Our "All signal, no noise" approach drives an intelligence service that is succinct and timely, which is highly regarded by our time constrained client base.Our Head Office is in London with offices in Chicago, Washington and Beijing, as well as an on the ground presence in other major financial centres across the world.
EUR Heavy Again as Merkel Paints Bleak Picture
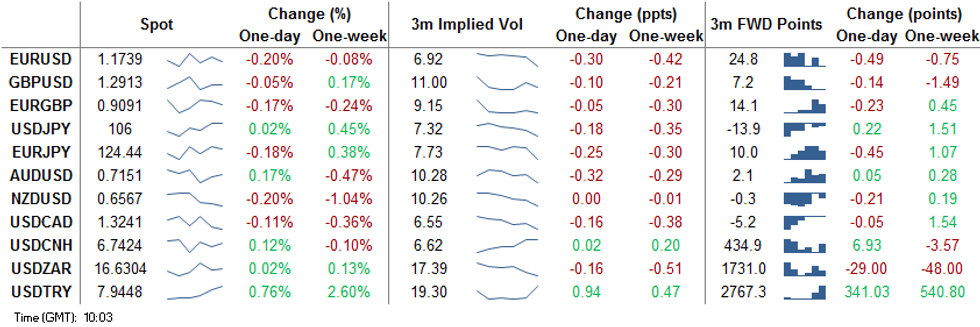
Following the sharp sell-off this week, stocks have stabilised a little in Europe, but the bounce is shallow and there's no sign of a sharp recovery at this stage. This has translated into a mixed USD, leaving FX largely non-directional so far.
GBP is modestly outperforming, still getting some support from yesterday's Bloomberg report which suggested that gaps were narrowing between EU and UK negotiators. EUR is faring less well, with German Chancellor Merkel this morning painting a stark picture of Germany's current status - she stated that health authorities are near their limits and the situation is dramatic. EUR/USD sits just above the Wednesday lows at $1.1718. A break below here opens $1.1689 key support ahead of $1.1612.
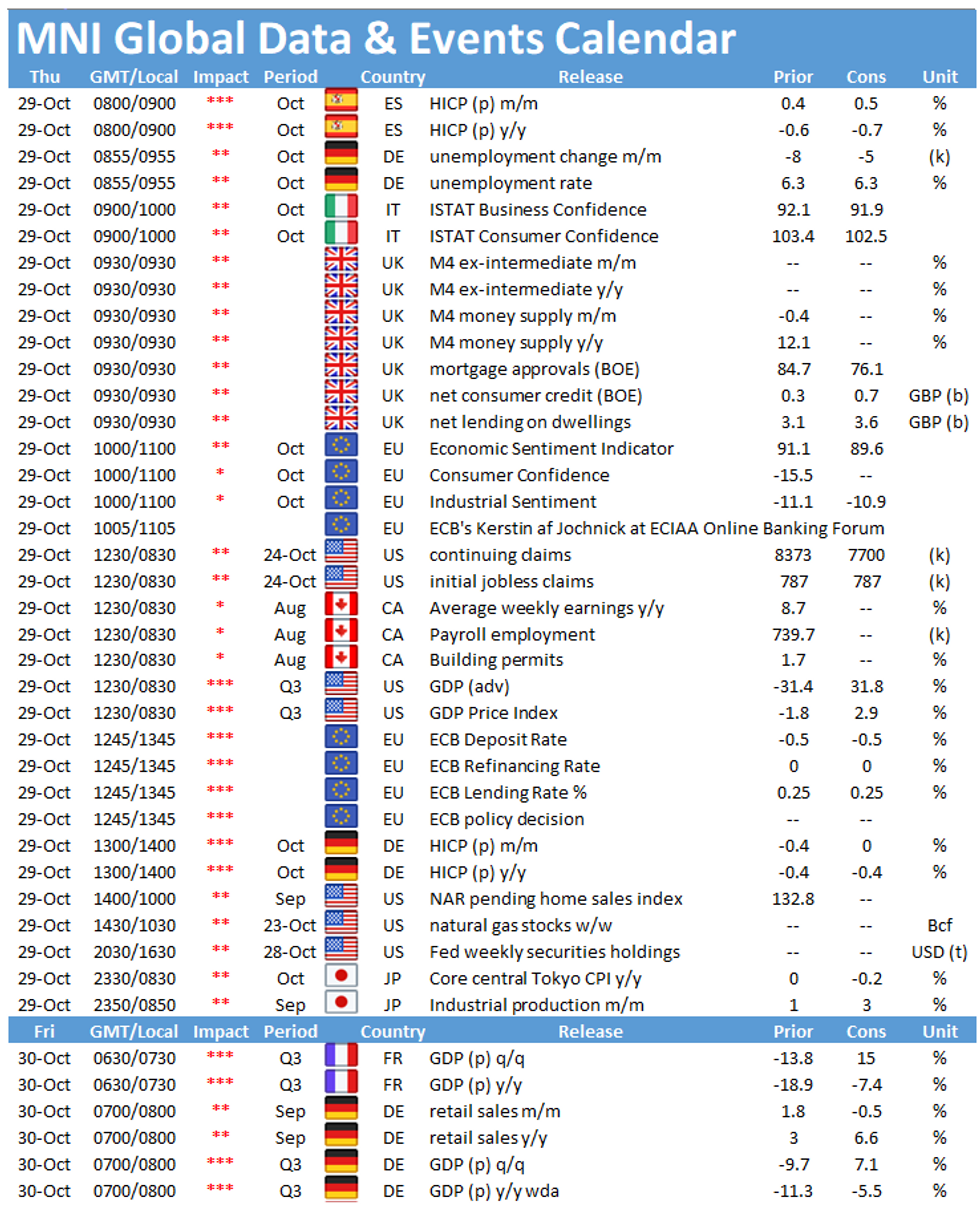
The ECB rate decision takes focus going forward. While the ECB are not expected to pull the trigger on further policy action today, pressure is clearly building on the governing council given the fragile recovery and the looming risk of further lockdowns.
Weekly US jobless claims data are due as well as Q3 advance GDP numbers from the US, which are expected to show GDP growing at 32% on an annualized basis.
EUR/USD TECHS: Key Trendline Remains Under Pressure
- RES 4: 1.1909 1.0% 10-dma envelope
- RES 3: 1.1881 High Oct 21 and the bull trigger
- RES 2: 1.1839 High Oct 27
- RES 1: 1.1798 High Oct 28
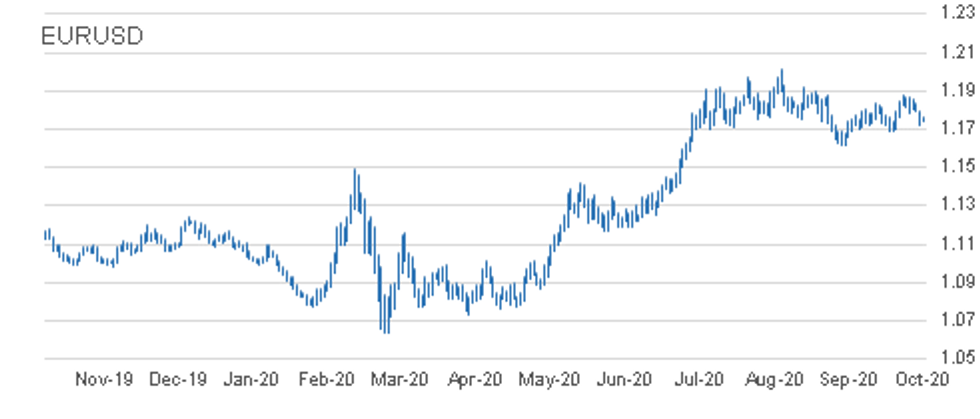
- PRICE: 1.1733 @ 09:29 GMT Oct 30
- SUP 1: 1.1718 Low Oct 28
- SUP 2: 1.1689 Low Oct 15 and a key support
- SUP 3: 1.1612 Low Sep 25 and the bear trigger
- SUP 4: 1.1541 Low Jul 23
EURUSD remains under pressure. The pair is trading back below the key near-term trendline support drawn off the Sep 28 low that was probed yesterday. A clear breach, confirmed by a move below yesterday's low of 1.1718, would strengthen a bearish case and open 1.1689, Oct 15 low and a key support. A break of 1.1689 would open 1.1612, Sep 25 low. Initial resistance is at 1.1798, Wednesday's intraday high.
GBP/USD TECHS: Bearish Pressure
- RES 4: 1.3280 Former trendline support drawn off the Mar 20 low
- RES 3: 1.3264 2.0% 10-dma envelope
- RES 2: 1.3177 High Oct 21 and the bull trigger
- RES 1: 1.3080 High Oct 27
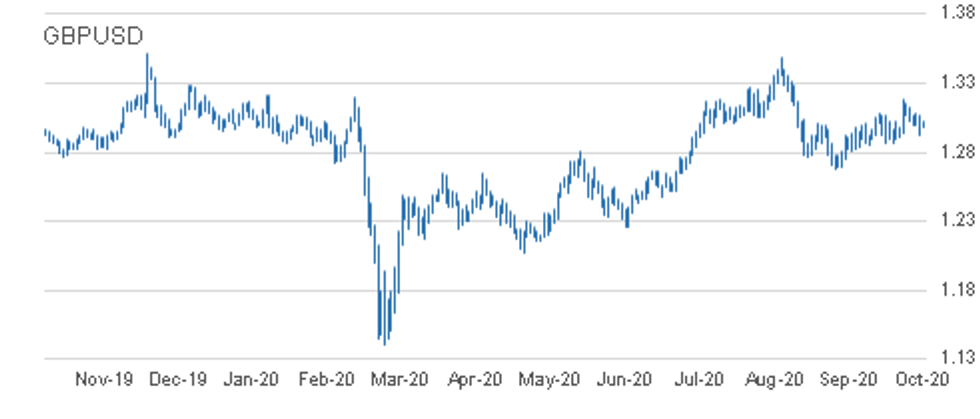
- PRICE: 1.3022 @ 09:35 GMT Oct 29
- SUP 1: 1.2917 Low Oct 28
- SUP 2: 1.2863 Low Oct 14 and key near-term support
- SUP 3: 1.2806 Low Sep 30
- SUP 4: 1.2794 76.4% retracement of the Sep 23 - Oct 21 rally
GBPUSD remains above yesterday's low. Despite this, a bearish threat continues to dominate following recent weakness and yesterday's break of support at 1.2940 Oct 21 low. The print below 1.2940 suggests scope for a deeper corrective pullback exposing 1.2863, Oct 14 low and a key support. Price action has defined initial resistance at 1.3080, Oct 27 high. A move back above this hurdle would ease bearish pressure and open 1.3177.
EUR/GBP TECHS: Tests Key Support
- RES 4: 0.9220 High Sep 22
- RES 3: 0.9158/62 1.0% 10-dma envelope / High Oct 7
- RES 2: 0.9149 Oct 20 high
- RES 1: 0.9107 High Oct 23
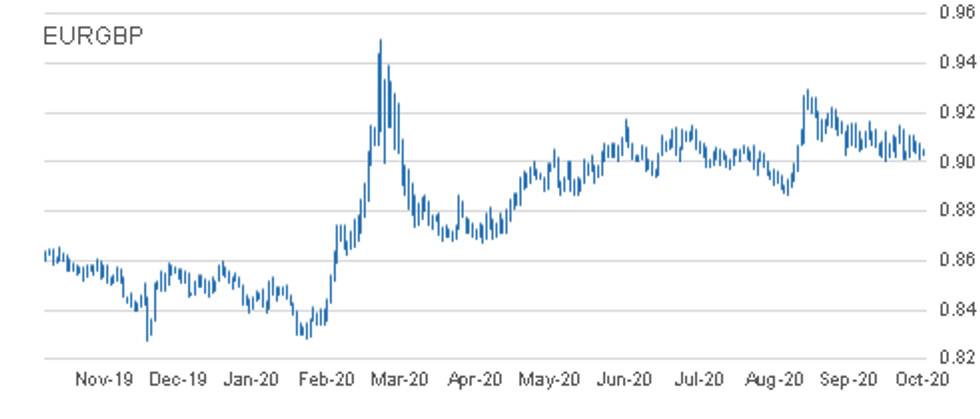
- PRICE: 0.9017 @ 09:42 GMT Oct 29
- SUP 1: 0.9007 Low Oct 14 and the bear trigger
- SUP 2: 0.8967 76.4% retracement of the Sep 3 - 11 rally
- SUP 3: 0.8925 Low Sep 7
- SUP 4: 0.8900 Low Sep 4
EURGBP is trading close to recent lows. The outlook remains bearish following the sharp sell-off on Oct 21. Attention is on 0.9007, Oct 14 low, the near-term bear trigger and today's intraday low. A break of 0.9007 would confirm a resumption of the downtrend that started Sep 11 and expose 0.8967, a retracement. Key S/T resistance has been defined at 0.9149, Oct 20 high. Clearance of this level would undermine bearish conditions.
USD/JPY TECHS: Key Support Still Exposed
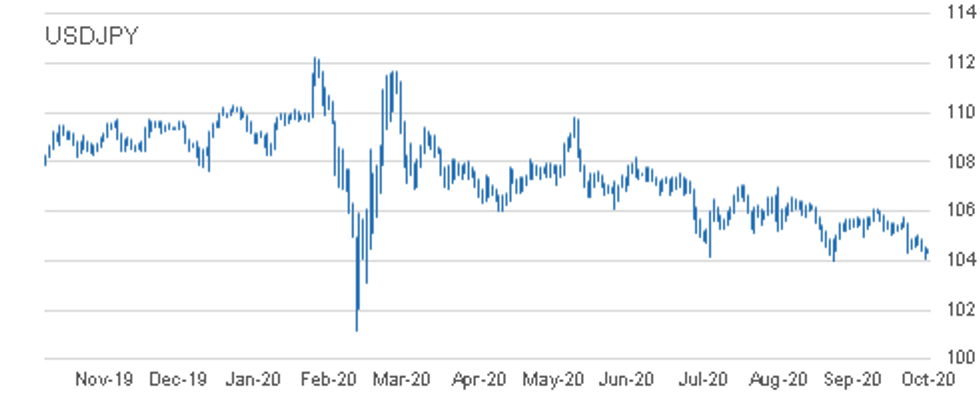
- RES 4: 105.75 High Oct 20
- RES 3: 105.53 High Oct 21 / 50-dma
- RES 2: 105.06 High Oct 26 and key near-term resistance
- RES 1: 104.56 Intraday high
- PRICE: 104.18 @ 09:44 GMT Oct 29
- SUP 1: 104.00 Low Sep 21 and the bear trigger
- SUP 2: 103.67 76.4% retracement of the Mar 9 - 24 rally
- SUP 3: 103.09 Low Mar 12
- SUP 4: 102.02 Low Mar 10
USDJPY maintains a softer tone and edged lower again yesterday. The outlook is bearish following the Oct 21 sell-off that marked a resumption of the downleg from 106.11, Oct 7 high. A number of important supports have been cleared and attention is on the key 104.00 handle, Sep 21 low. Clearance of 104.00 would suggest scope for a deeper USD sell-off within the bear channel drawn off the Mar 24 high. Firm resistance is at 105.06.
EUR/JPY TECHS: Erodes Key Support Levels
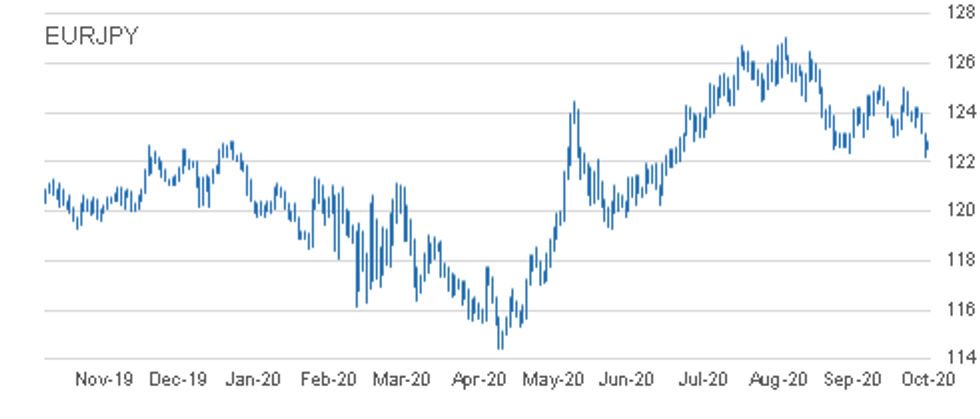
- RES 4: 125.00/09 High Oct 20 and Oct 9
- RES 3: 124.23 High Oct 23 and 26
- RES 2: 123.84 20-day EMA
- RES 1: 123.19 High Oct 28
- PRICE: 122.17 @ 09:47 GMT Oct 29
- SUP 1: 122.14 Intraday low
- SUP 2: 121.82 Low Jul 15 / 16
- SUP 3: 121.50 0.764 proj of Sep 1 - 28 decline from Oct 9 high
- SUP 4: 120.70 Low Jul 13
EURJPY yesterday cleared support at 123.03/02 as well as 122.38, Sep 28 low. This undermines the recent bullish outlook and instead signals a likely resumption of the downleg that started on Sep 1. Scope is seen for weakness towards 121.82 - levels not seen since July. 121.50, a Fibonacci projection has also appeared on the radar. Initial resistance is at 123.19, the Wednesday high.
AUD/USD TECHS: Trendline Resistance Caps Gains
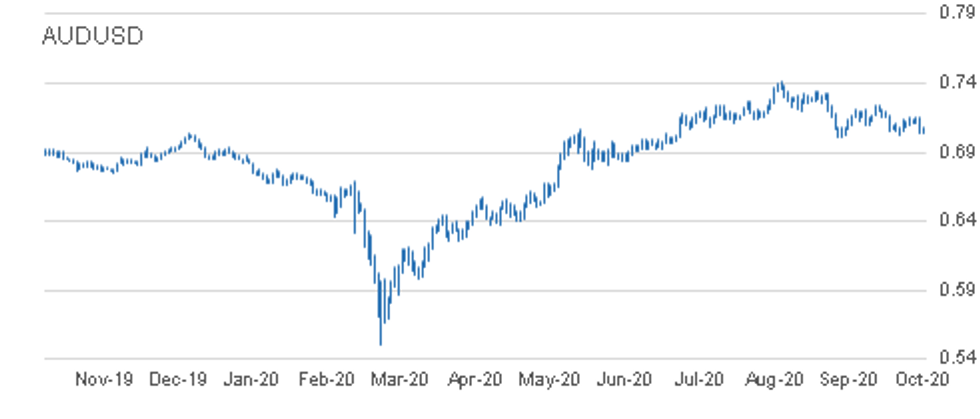
- RES 4: 0.7324 High Sep 21
- RES 3: 0.7258 61.8% retracement of the Sep 1 - 25 decline
- RES 2: 0.7243 High Oct 10 and a key resistance
- RES 1: 0.7151/58 Trendline drawn off the Sep 1 high / High Oct 23
- PRICE: 0.7045 @ 09:51 GMT Oct 29
- SUP 1: 0.7038 Low Oct 28
- SUP 2: 0.7021 Low Oct 20
- SUP 3: 0.7006 Low Sep 25 and the bear trigger
- SUP 4: 0.6965 23.6% retracement of the Mar - Sep rally
AUDUSD outlook is bearish. The Aussie continues to trade below trendline resistance drawn off the Sep 1 high. The line intersects at 0.7151 and represents a key hurdle for bulls. This resistance line was tested Wednesday and capped gains. While the trendline holds, a bearish theme remains intact with attention is on key support and bear trigger at 0.7006, Sep 25 low. A trendline breach would signal a reversal and open 0.7243, Oct 10 high.
USD/CAD TECHS: Developing Bullish Theme
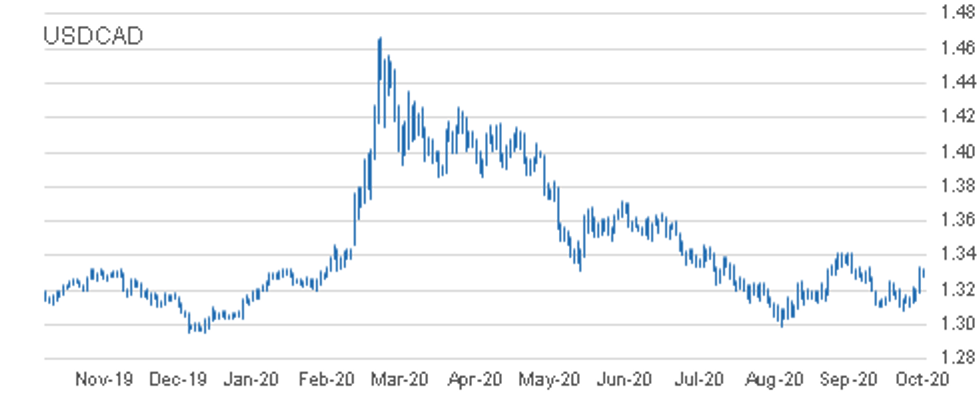
- RES 4: 1.3450 2.0% 10-dma envelope
- RES 3: 1.3421 High Sep 30 and primary resistance
- RES 2: 1.3341 High Oct 7
- RES 1: 1.3334 High Oct 28
- PRICE: 1.3323 @ 09:55 GMT Oct 29
- SUP 1: 1.329 High Oct 15 and recent breakout level
- SUP 2: 1.3180 Low Oct 28
- SUP 3: 1.3109/3081 Low Oct 23 / Low Oct 21 and the bear trigger
- SUP 4: 1.3047 Low Sep 7
USDCAD started the week on a firm note and confirmed a bullish statement Wednesday, rallying sharply higher. This led to a break of key S/T resistance at 1.3259, Oct 15 high exposing 1.3341, Oct 7 high. Clearance of 1.3341 would signal scope for a climb towards 1.3421, Sep 30 and primary resistance. Initial firm support is seen at yesterday's low of 1.3180. A break of this level is required to undermine the developing bullish tone.
EUR/USD: MNI KEY LEVELS
- *$1.1913/16 Upper 1.0% 10-dma env/Upper Boll Band (3%)
- *$1.1870 Upper Bollinger Band (2%)
- *$1.1851/56 Jun14-2018 high/100-mma
- *$1.1815 Sep24-2018 high
- *$1.1809 200-hma
- *$1.1803/04 100-hma/Cloud top
- *$1.1797 55-dma
- *$1.1790 50-dma
- *$1.1776 21-dma
- *$1.1757/59 Sep27-2018 high/Intraday high
- *$1.1753 ***CURRENT MARKET PRICE 07:20GMT THURSDAY***
- *$1.1742 Intraday low
- *$1.1736 Fibo 38.2% 1.3993-1.0341
- *$1.1685 Lower Bollinger Band (2%)
- *$1.1677 Lower 1.0% 10-dma envelope
- *$1.1668 Cloud base
- *$1.1651 Sep28-2018 high, 100-dma
- *$1.1639 Lower Bollinger Band (3%)
- *$1.1621 Oct16-2018 high
- *$1.1614/13 Down Trendline from Jul18-2008/161.8% swing $1.1497-1.1309
- *$1.1570 Jan10-2019 high
GBP/USD: MNI KEY LEVELS
- *$1.3191/95 Apr04-2019 high/Upper Boll Band (3%)
- *$1.3185 May06-2019 high
- *$1.3144/45 38.2% 1.4377-1.2382/Upper 1.0% 10-dma env
- *$1.3133 Apr12-2019 high
- *$1.3126/31 Upper Boll Band (2%)/May07-2019 high
- *$1.3109 Fibo 50% 1.1841-1.4377
- *$1.3080 May08-2019 high
- *$1.3041 May13-2019 high
- *$1.3025/26/28 Intraday high/100-hma/200-hma
- *$1.3015 55-dma
- *$1.3014 ***CURRENT MARKET PRICE 07:20GMT THURSDAY***
- *$1.3002/99 50-dma/61.8% 1.3381-1.2382
- *$1.2991 May10-2019 low
- *$1.2983/81 21-dma/Cloud top, Intraday low
- *$1.2970 May14-2019 high
- *$1.2960 Cloud base
- *$1.2952/47 50-mma/200-wma
- *$1.2904 May14-2019 low
- *$1.2885/82 Lower 1.0% 10-dma env/50% 1.3381-1.2382
- *$1.2872 100-dma
- *$1.2852/50 May16-2019 high/Lower Boll Band (2%)
EUR/GBP: MNI KEY LEVELS
- *Gbp0.9154 Upper 1.0% 10-dma envelope
- *Gbp0.9130/33/34 Upper Boll Band (2%)/Cloud top/Sep11-2017 high
- *Gbp0.9108 Jan03-2019 high
- *Gbp0.9079 Cloud base
- *Gbp0.9070 21-dma
- *Gbp0.9065/69 55-dma/50-dma
- *Gbp0.9061/62/64 100-hma/Jan11-2019 high/200-hma
- *Gbp0.9052 100-dma
- *Gbp0.9048/51 Jul16-2019 high, Intraday high/Jul17-2019 high
- *Gbp0.9039 Jul18-2019 high
- *Gbp0.9031 ***CURRENT MARKET PRICE 07:20GMT THURSDAY***
- *Gbp0.9025 Intraday low
- *Gbp0.9010/07 Jul10-2019 high/Lower Boll Band (2%)
- *Gbp0.9005/00 Jul23-2019 high/Jul22-2019 high
- *Gbp0.8976/73 Lower Boll Band (3%)/Lower 1.0% 10-dma env
- *Gbp0.8953 Jul23-2019 low
- *Gbp0.8921 Jul02-2019 low
- *Gbp0.8902 200-dma
- *Gbp0.8882 Lower 2.0% 10-dma envelope
- *Gbp0.8874/73/72 Jun19-2019 low/Jun20-2019 low/Jun12-2019 low
- *Gbp0.8865 Fibo 61.8% 0.9108-0.8473
USD/JPY: MNI KEY LEVELS
- *Y105.50 50-dma
- *Y105.30 Cloud base
- *Y105.22 21-dma
- *Y105.11 Cloud Kijun Sen
- *Y104.93 Cloud Tenkan Sen
- *Y104.87 Jan03-2019 low
- *Y104.85 200-hma
- *Y104.61 100-hma
- *Y104.56 Mar26-2018 low
- *Y104.50 Intraday high
- *Y104.34 ***CURRENT MARKET PRICE 07:20GMT THURSDAY***
- *Y104.28 Intraday low
- *Y104.15 Lower Bollinger Band (2%)
- *Y104.00 YTD low
- *Y103.94 200-mma
- *Y103.79 Lower 1.0% 10-dma envelope
- *Y103.62 Lower Bollinger Band (3%)
- *Y102.74 Lower 2.0% 10-dma envelope
- *Y101.70 Lower 3.0% 10-dma envelope
- *Y101.20 Nov09-2016 low
- *Y100.75 Sep30-2016 low
EUR/JPY: MNI KEY LEVELS
- *Y123.60 Cloud Tenkan Sen
- *Y123.58 100-dma
- *Y123.54 Fibo 50% 109.57-137.50
- *Y123.51 May22-2019 high
- *Y123.47 100-hma
- *Y123.18 Jun11-2019 high
- *Y123.11 Fibo 50% 118.71-127.50
- *Y123.08 Fibo 38.2% 126.81-120.78
- *Y123.01 Jun12-2019 high
- *Y122.88 Intraday high
- *Y122.63 ***CURRENT MARKET PRICE 07:20GMT THURSDAY***
- *Y122.56/51 Jun13-2019 high, Lower Boll Band (2%)/Intraday low
- *Y122.43 Lower 1.0% 10-dma envelope
- *Y122.23 Jul12-2019 high
- *Y122.13 Jun17-2019 high
- *Y122.07 Fibo 61.8% 118.71-127.50
- *Y121.95 Fibo 50% 94.12-149.78
- *Y121.92 Jun20-2019 high
- *Y121.89 Lower Bollinger Band (3%)
- *Y121.85 Jul15-2019 high, 100-wma
- *Y121.42 Jul15-2019 low
AUD/USD: MNI KEY LEVELS
- *$0.7190/91 50-dma/55-dma
- *$0.7166/68 Upper 1.0% 10-dma env/Cloud base
- *$0.7153 Apr17-2019 low
- *$0.7140 Apr16-2019 low
- *$0.7131 21-dma
- *$0.7116 Apr12-2019 low
- *$0.7110/12/13 Apr10-2019 low/100-dma/100-hma
- *$0.7100 200-hma
- *$0.7088 Apr08-2019 low
- *$0.7076 Intraday high
- *$0.7076 ***CURRENT MARKET PRICE 07:20GMT THURSDAY***
- *$0.7073/69 Mar29-2019 low/Apr30-2019 high
- *$0.7057/53 Jul22-2019 high/Apr02-2019 low
- *$0.7048/44 Jul04-2019 high, May07-2019 high/Jul16-2019 high, Intraday low
- *$0.7026/24 Lower Boll Band (2%)/Lower 1.0% 10-dma env
- *$0.6985 Jan03-2019 low
- *$0.6974/71 Lower Boll Band (3%)/Jul12-2019 low
- *$0.6967 Jun11-2019 high
- *$0.6953 Lower 2.0% 10-dma envelope
- *$0.6909 Jun19-2019 high
- *$0.6895 100-wma
USD/CAD: MNI KEY LEVELS
- *C$1.3376/77 50% 1.4690-1.2062/100-wma
- *C$1.3358 Fibo 50% 1.3565-1.3151
- *C$1.3345 Jun12-2019 high
- *C$1.3339 Upper Bollinger Band (2%)
- *C$1.3333 100-dma
- *C$1.3326/28 Intraday high/38.2% 1.2783-1.3665
- *C$1.3320/24 Cloud top/Upper 1.0% 10-dma env
- *C$1.3309 Fibo 38.2% 1.3565-1.3151
- *C$1.3300 Jun13-2019 low
- *C$1.3286 Jun20-2019 high
- *C$1.3284 ***CURRENT MARKET PRICE 07:20GMT THURSDAY***
- *C$1.3278 Intraday low
- *C$1.3226/24 Jun10-2019 low/50% 1.2783-1.3665, Cloud base
- *C$1.3204/03/02 55-dma, 21-dma/50-dma/100-hma
- *C$1.3178/76 50-mma/200-hma
- *C$1.3164/63/60 Jul23-2019 high/Feb21-2019 low/200-wma
- *C$1.3151/50 Jun20-2019 low/Feb20-2019 low
- *C$1.3120/16 61.8% 1.2783-1.3665/Jul23-2019 low
- *C$1.3113 Feb25-2019 low
- *C$1.3107 Jun26-2019 low
- *C$1.3066 Fibo 38.2% 1.4690-1.2062
OPTIONS: Expiries for Oct29 NY cut 1000ET (Source DTCC)
EUR/USD: $1.1700(E785mln), $1.1720-25(E1.2bln), $1.1745-55(E1.6bln), $1.1765-70(E766mln), $1.1850-55(E634mln)
USD/JPY: Y103.20-25($1.6bln-USD puts), Y103.60($1.0bln-USD puts), Y104.00($1.8bln-USD puts), Y104.75($523mln), Y105.15-16($654mln), Y105.25($1.3bln), Y105.55-65($2.4bln), Y106.00($1.2bln)
GBP/USD: $1.2800(Gbp425mln)
EUR/GBP: Gbp0.9050(E920mln), Gbp0.9110(E697mln)
AUD/JPY: Y71.60(A$727mln-AUD calls), Y73.20(A$1.0bln-AUD puts), Y76.35-40(A$2.4bln-AUD calls)
USD/CAD: C$1.3160-75($1.0bln), C$1.3325($530mln)
Larger Option Pipeline
- EUR/USD: Oct30 $1.1750-54(E1.4bln), $1.1800(E2.2bln), $1.1850(E1.65bln), $1.1950(E1.7bln-EUR calls), $1.2000(E1.3bln); Nov03 $1.1900-05(E1.4bln)
- USD/JPY: Oct30 Y104.00($1.4bln), Y104.50($2.4bln), Y104.80-85($1.6bln), Y104.95-105.00($1.1bln), Y106.00-05($2.2bln); Nov03 Y105.45-49($1.3bln); Nov04 Y105.00($1.1bln); Nov05 Y106.06-09($1.6bln)
- EUR/JPY: Nov05 Y124.50(E1.1bln)
- GBP/USD: Nov02 $1.3100(Gbp1.2bln), $1.3150(Gbp911mln)
- EUR/GBP: Nov02 Gbp0.8900(E2.1bln-EUR puts), Gbp0.9000(E1.4bln)
- AUD/USD: Oct30 $0.7180-00(A$1.4bln); Nov02 $0.7140-45(A$1.9bln)
- AUD/JPY: Oct30 Y77.45(A$1.2bln)
- AUD/NZD: Oct30 N$1.0750(A$1.2bln)
- USD/CAD: Oct30 C$1.3025($1.1bln), C$1.3150($1.3bln)
- USD/CNY: Nov03 Cny6.5334($1.2bln); Nov05 Cny6.75($1.0bln), Cny6.80($1.9bln), Cny6.85($1.3bln)
Why MNI
MNI is the leading provider
of intelligence and analysis on the Global Fixed Income, Foreign Exchange and Energy markets. We use an innovative combination of real-time analysis, deep fundamental research and journalism to provide unique and actionable insights for traders and investors. Our "All signal, no noise" approach drives an intelligence service that is succinct and timely, which is highly regarded by our time constrained client base.Our Head Office is in London with offices in Chicago, Washington and Beijing, as well as an on the ground presence in other major financial centres across the world.