
Why MNI
MNI is the leading provider
of intelligence and analysis on the Global Fixed Income, Foreign Exchange and Energy markets. We use an innovative combination of real-time analysis, deep fundamental research and journalism to provide unique and actionable insights for traders and investors. Our "All signal, no noise" approach drives an intelligence service that is succinct and timely, which is highly regarded by our time constrained client base.Our Head Office is in London with offices in Chicago, Washington and Beijing, as well as an on the ground presence in other major financial centres across the world.
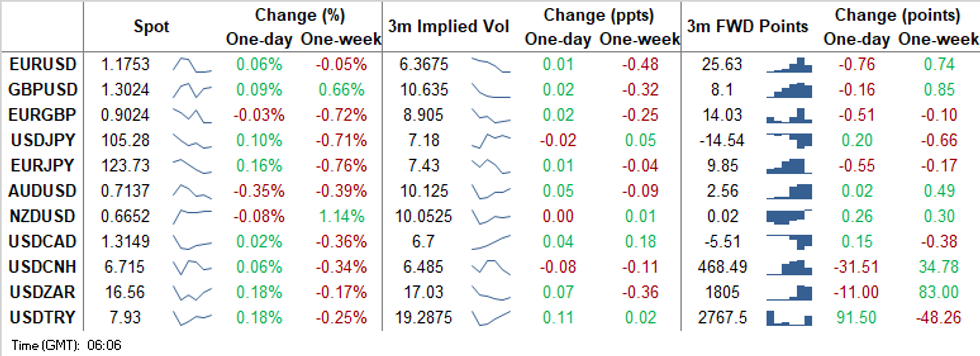
FOREX SUMMARY
A super busy session for FX and across assets.
- Risk Off hit hard on the Govies opening bell.
- Chance of a US Stimulus package before the election, are all but gone according to Mnuchin, blaming politics.
- France is "a couvre feu" following Covid spikes, and the data across Europe paint a bleak picture, with numbers worst than the initial first wave.
- These have been the drivers, and USD took its cue and rallied across the board.
- Worth noting that volumes on Core Bonds are running close to 190% averages for this time of the day, with buying pushing yields to new lows.
- USD test high of the day against EUR, GBP, AUD, JPY, CAD, SEK NOK, PLN, ZAR, MXN, and we are still seeing buying momentum at the time of typing.
- CEE FX have felt the pinch with the EUR under pressure, but also having their own issues on Covid cases for Eastern Europe. EURCZK, EURHUF, and EURPLN are testing high of the session.
- AUD is the worst performing currency against the USD in G10, down 1.23%,
- Risk Off and RBA Gov Lowe's speech which was widely interpreted as dovish, has weighted on the Aussie.
- AUDUSD is off the lows at 0.7074 at the time of typing.
- Looking ahead, US Jobless is the data of interest, while BoE Cunliffe, BoC Tim Lane, ECB Lagarde, Fed Bostic, Bullard, Quarles, Kaplan, Barkin, and Kashkari are the schedule speakers.
- ALL EYES of course on the EU Summit
Resend - Under Pressure
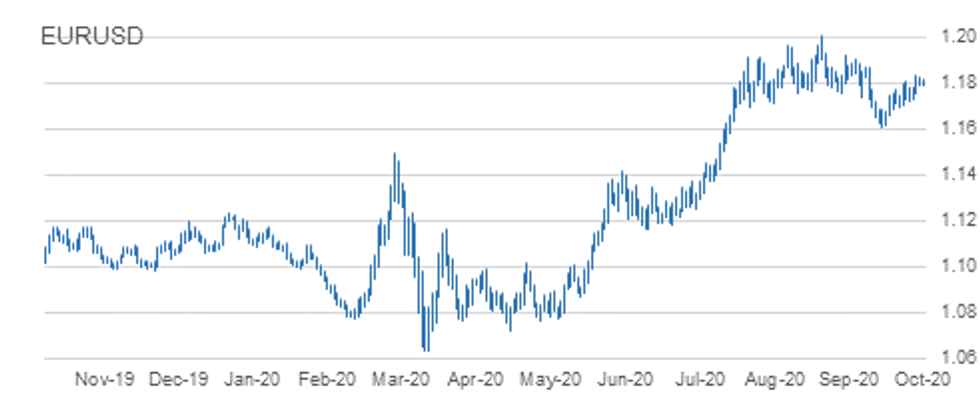
- RES 4: 1.1917 High Sep 10 and 76.4% of the Sep 1 - 25 sell-off
- RES 3: 1.1859 61.8% retracement of the Sep 1 - 25 sell-off
- RES 2: 1.1817/31 High Oct 13 / High Oct 9 and the bull trigger
- RES 1: 1.1771 High Oct 14
- PRICE: 1.1705 @ 10:27 BST Oct 15
- SUP 1: 1.1685 Low Sep 30
- SUP 2: 1.1612/1581 Low Sep 25 and the bear trigger / Low Jul 24
- SUP 3: 1.1591 100-dma
- SUP 4: 1.1541 Low Jul 23
EURUSD is trading lower today in line with general USD strength. The move lower follows the recent rejection off the 1.1831 high on Oct 9. Attention turns to the next important support handle at 1.1685, Sep 30 low. A break of this level would set the scene for a deeper decline and expose the key 1.1612 level, Sep 25 low. 1.1612 also represents the trigger for a resumption of the downtrend that started on Sep 1. Resistance is at 1.1771.
Still Trading Below Monday's High
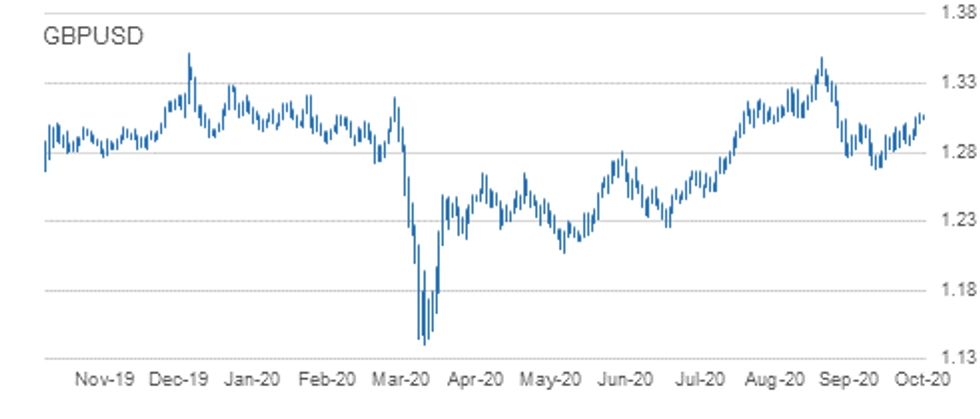
- RES 4: 1.2280 High Sep 7
- RES 3: 1.3174 61.8% retracement of the Sep 1 - 23 sell-off
- RES 2: 1.3163 Former trendline support drawn off the Mar 20 low
- RES 1: 1.3083 High Oct 12
- PRICE: 1.2962 @ 10:30 BST Oct 15
- SUP 1: 1.2863 Low Oct 14
- SUP 2: 1.2846 Low Oct 7 and key near-term support
- SUP 3: 1.2806 Low Sep 30
- SUP 4: 1.2745 Low Sep 28
GBPUSD maintains a choppy tone. The pair recovered Wednesday bouncing sharply off the day low of 1.2863. Price however remains below Monday's high of 1.3083. A break of this level is needed to resume the recent uptrend that would open 1.3000 and 1.3163. The latter is the former trendline support drawn off the Mar 20 low. The trendline was breached on Sep 9. A break of 1.3163 is required to strengthen a bullish theme. Initial support is at 1.2863.
Bearish Conditions Still Dominate
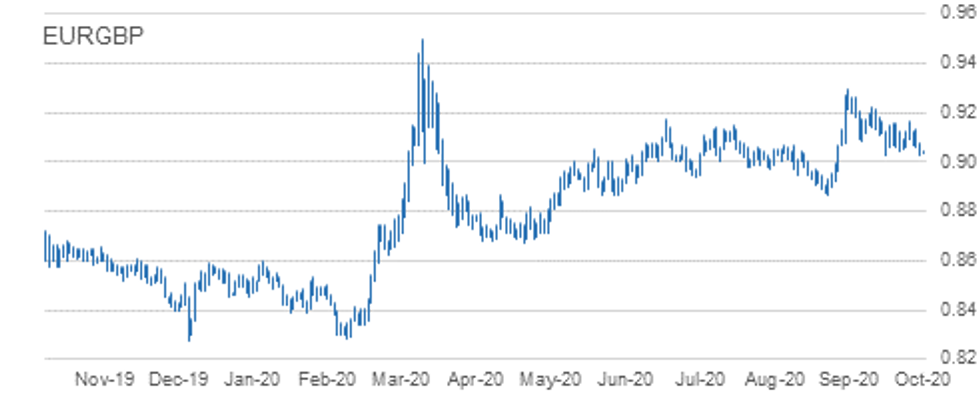
- RES 4: 0.9190 61.8% retracement of the Sep 11 - 28 sell-off
- RES 3: 0.9162 High Oct 7 and the bull trigger
- RES 2: 0.9132 High Oct 10
- RES 1: 0.9122 Oct 14 high
- PRICE: 0.9035 @ 10:32 BST Oct 15
- SUP 1: 0.9007 Low Oct 14
- SUP 2: 0.9000 Round number support
- SUP 3: 0.8967 76.4% retracement of the Sep 3 - 11 rally
- SUP 4: 0.8808 Low May 13
EURGBP remains soft following yesterday's strong rejection off the day high. The break lower follows another failed attempt yesterday to convincingly clear trendline resistance drawn off the Sep high. The move lower also confirms a resumption of the downtrend that has been in place since Sep 11 and sets the scene for a move to 0.9000 and below towards 0.8967, a retracement level. Resistance is at 0.9122, the Oct 14 high.
Eyeing Key Short-Term Support
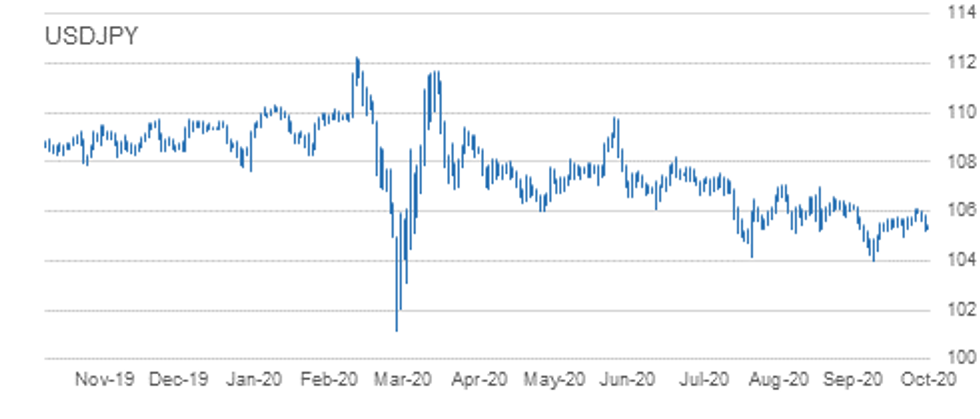
- RES 4: 106.95 High Sep 28
- RES 3: 106.55 High Sep 3 / Channel resistance drawn off Mar 24 high
- RES 2: 106.11/38 High Oct 7 and the bull trigger / High Sep 8
- RES 1: 105.63 High Oct 13
- PRICE: 105.32 @ 10:34 BST Oct 15
- SUP 1: 105.04 Low Oct 14
- SUP 2: 104.94 Low Oct 2 and key near-term support
- SUP 3: 104.41 Low Sep 22
- SUP 4: 104.00 Low Sep 21 and the bear trigger
USDJPY traded lower Wednesday extending this week's slide and the recent pullback from last week's 106.11 high on Oct 7. Intraday momentum studies still point south however, to strengthen a bearish theme price needs to trade below 104.94, Oct 2 low. This would open 104.00, Sep 21 low. While 104.94 remains intact, the current sell-off is considered a correction following recent gains. The bull trigger is at 106.11, Oct 7 high. Initial resistance is at 105.63.
Edges Lower
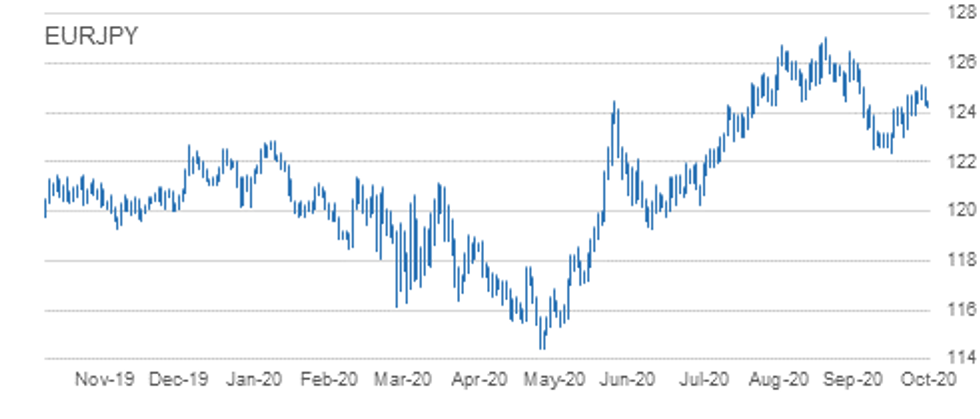
- RES 4: 126.46 High Sep 10 and a key resistance
- RES 3: 125.77 High Sep 15
- RES 2: 125.09/28 High Oct 9 / 61.8% of the Sep 1 - 28 sell-off
- RES 1: 124.48 High Oct 13
- PRICE: 123.33 @ 10:43 BST Oct 15
- SUP 1: 123.03 Low Sep 29 and Oct 2 and key near-term support
- SUP 2: 122.38/28 Low Sep 28 / 61.8% of the Jun 22 - Sep 1 rally
- SUP 3: 122.25 38.2% retracement of the May - Sep rally
- SUP 4: 121.82 Low Jul 15 and 16
EURJPY maintains a softer tone, trading lower once again this morning. While near term weakness is considered a correction, attention turns to support at 123.03, Oct 6 low with the former support at 123.86, Oct 6 low breached. This week's move below 123.86 strengthens the intraday bearish tone and clearance of 123.03 would highlight scope for a deeper pullback. Key resistance is at 125.09, Oct 9 high. Initial resistance is at 124.48.
Pulls Further Away From Trendline Resistance
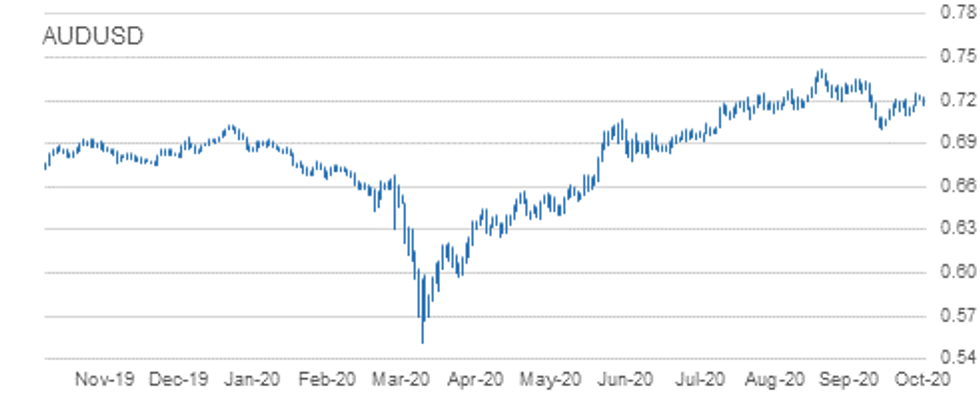
- RES 4: 0.7258 61.8% retracement September Sell-Off
- RES 3: 0.7243 High Oct 10 and the intraday bull trigger
- RES 2: 0.7213 Trendline resistance drawn off the Sep 1 high
- RES 1: 0.7170 Intraday high
- PRICE: 0.7077 @ 10:56 BST Oct 15
- SUP 1: 0.7067 Intraday low
- SUP 2: 0.7029 Low Sep 28
- SUP 3: 0.7006 Low Sep 25 and the bear trigger
- SUP 4: 0.6965 23.6% retracement of the Mar - Sep rally
AUDUSD is sharply lower this morning. On Oct 9, the pair cleared resistance at 0.7209, Oct 1 and 6 high resulting in a test of trendline resistance drawn off the Sep 1 high. The line intersects at 0.7213 today. A failure to clear the trendline is weighing and with support at 0.7096, Oct 7 low cleared this morning, the scene is set for a deeper pullback. Attention turns to the primary support and bear trigger at 0.7006, Sep 25 low. 0.7170 is first resistance.
TECHS: Corrective Bounce
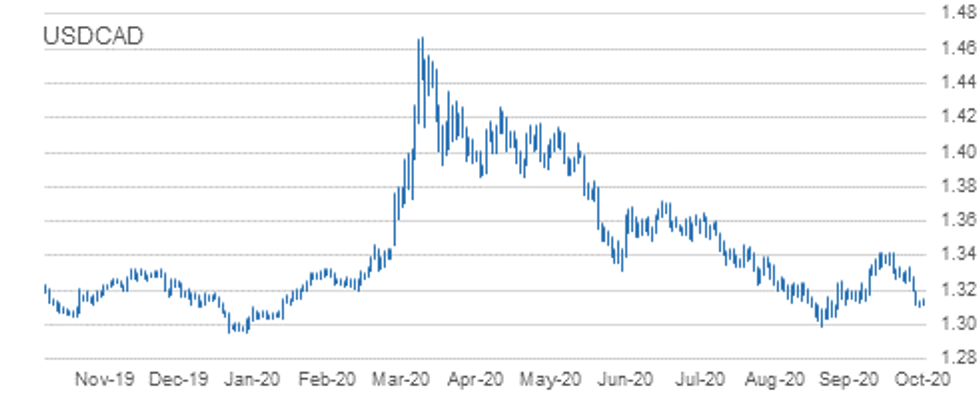
- RES 4: 1.3341 High Oct 7 and a reversal trigger
- RES 3: 1.3268 High Oct 7 and 50-day EMA
- RES 2: 1.3225 20-day EMA
- RES 1: 1.3205 Intraday high
- PRICE: 1.3198 @ 11:04 BST Oct 15
- SUP 1: 1.3143 Intraday low
- SUP 2: 1.3099 Low Oct 13
- SUP 3: 1.3095 76.4% retracement of the Sep 1 - 30 rally
- SUP 4: 1.3038 Low Sep 2
USDCAD has rebounded this morning as the USD rallies across the board. The recovery highlights scope for a corrective bounce with attention turning to resistance at 1.3222 next, the 20-day EMA. A break of this level would signal scope for a stronger short-term recovery and expose the 50-day EMA that intersects at 1.3268 today. The 1.3222/68 zone represents a key resistance. On the downside, initial support lies at 1.3143, today's intraday low.
Expiries for Oct15 NY cut 1000ET (Source....>
OPTIONS: Expiries for Oct15 NY cut 1000ET (Source DTCC)
EUR/USD: $1.0950-55(E660mln), $1.1015-20(E1.07bln), $1.1100(E532mln),
$1.1200(E646mln)
USD/JPY: Y106.50($579mln), Y107.00-10($2.1bln), Y107.40-50($589mln),
Y107.75-85(E636mln), Y108.00-20($1.62bln), Y109.00-10($962mln), Y110.00($824mln)
EUR/JPY: Y118.00-05(E536mln), Y119.45-50(E624mln), Y121.00(E595mln)
GBP/USD: $1.2200(Gbp713mln), $1.2600(Gbp1.0bln)
AUD/USD: $0.6800(A$624mln), $0.6880-00(A$812mln)
USD/CAD: C$1.3260-80($950mln)
USD/CNY: Cny6.97($700mln), Cny7.08($1.12bln)
KEY LEVELS:
EUR/USD: MNI Key Levels
- *$1.1882 Sep16 high
- *$1.1872/81 Cloud top, Sep21 high/Upper 1.0% 10-dma env
- *$1.1849/56 Upper Boll Band (2%)/100-mma
- *$1.1817/27/31 Oct13 high/Oct12 high/Oct09 high
- *$1.1796/98 50-dma/55-dma
- *$1.1771/73/82 Oct14 high/200-hma/100-hma
- *$1.1756 Intraday high
- *$1.1748 ***CURRENT MARKET PRICE 05:20BST THURSDAY***
- *$1.1745/41 21-dma/Intraday low
- *$1.1720 Oct14 low
- *$1.1696/85 Oct02 low, 61.8% 1.1612-1.1831/Sep30 low, Sep25 high
- *$1.1664/61/46 76.4% 1.1612-1.1831/Sep29 low/Lower 1.0% 10-dma env
- *$1.1630 Lower Bollinger Band (2%)
- *$1.1612/98 Sep25 low/Cloud base, 100-dma
- *$1.1581/75 Jul24 low/Lower Boll Band (3%)
GBP/USD: MNI Key Levels
- *$1.3231 Upper 2.0% 10-dma envelope
- *$1.3203 Upper Bollinger Band (3%)
- *$1.3173/84 Sep08 high/Cloud top
- *$1.3101 Upper Boll Band (2%), Upper 1.0% 10-dma env
- *$1.3083 Oct12 high
- *$1.3064/72 Oct14 high/Oct13 high
- *$1.3022/28/30 50-dma/55-dma/Intraday high
- *$1.3014 ***CURRENT MARKET PRICE 05:35BST THURSDAY***
- *$1.3007/06 Sep16 high, Oct06 high, Intday low, NY Hly low Oct14/100-hma
- *$1.2971/64 200-hma/50% 1.2863-1.3064
- *$1.2952/40 50-mma/200-wma, 61.8% 1.2863-1.3064
- *$1.2910/99 76.4% 1.2863-1.3064/21-dma
- *$1.2870/63 Cloud base/Oct14 low
- *$1.2846/42/38 Oct07 low/Lower 1.0% 10-dma env/Oct02 low
- *$1.2832/31/20 100-dma/61.8% 1.2676-1.3083/Oct01 low
EUR/GBP: MNI Key Levels
- *Gbp0.9162/81 Oct07 high/Sep24 high
- *Gbp0.9156/57/59 Oct01 high/Sep30 high/Upper 1.0% 10-dma env
- *Gbp0.9122/23/32 Oct14 high/Oct08 high/Oct09 high
- *Gbp0.9106 21-dma
- *Gbp0.9068/77 10-dma/200-hma
- *Gbp0.9057/59/60 55-dma/50-dma/100-hma
- *Gbp0.9029/38 Intraday high/100-dma
- *Gbp0.9028 ***CURRENT MARKET PRICE 05:42BST THURSDAY***
- *Gbp0.9020/07 Intraday low/Oct14 low, Cloud top
- *Gbp0.9003/99 Lower Boll Band (2%)/Cloud base
- *Gbp0.8978/67 Lower 1.0% 10-dma env/Sep08 low
- *Gbp0.8953 Lower Bollinger Band (3%)
- *Gbp0.8925 Sep07 low
- *Gbp0.8900/87 Sep04 low/Lower 2.0% 10-dma env
- *Gbp0.8874/66/64 200-dma/Sep03 low/Jun09 low
USD/JPY: MNI Key Levels
- *Y106.08 Cloud base
- *Y106.04 Oct09 high
- *Y105.85 Oct12 high
- *Y105.77 50-dma, 55-dma
- *Y105.58/63/64 Cloud Tenkan Sen/Oct13 high/200-hma
- *Y105.47/52 100-hma/Oct14 high
- *Y105.30/38 Intraday high/21-dma(Expiries 105.20-30 $3.4bln)
- *Y105.28 ***CURRENT MARKET PRICE 05:52BST THURSDAY***
- *Y105.15/09 Cloud Kijun Sen/Intraday low
- *Y105.04 Oct14 low(Expiries 105.00-10 $1.7bln)
- *Y104.94/88 Oct02 low/Sep23 low(Expiries Y104.80-85 $1.6bln)
- *Y104.67 Lower Bollinger Band (2%)
- *Y104.50/41 Lower 1.0% 10-dma envelope/Sep22 low
- *Y104.29 Lower Bollinger Band (3%)
- *Y104.00/94 Sep21 low/200-mma
EUR/JPY: MNI Key Levels
- *Y124.93 Fibo 38.2% 149.78-109.57
- *Y124.77/79 50-dma/55-dma, 50-mma
- *Y124.42/48 Cloud Kijun Sen/Oct13 high
- *Y124.36 200-hma
- *Y124.20/26 Cloud Tenkan Sen/100-hma
- *Y123.94 Oct14 high
- *Y123.77/78 Intraday high/21-dma
- *Y123.73 ***CURRENT MARKET PRICE 05:55BST THURSDAY***
- *Y123.67 Cloud base
- *Y123.47/40 Oct14 low, Intraday low/100-dma
- *Y123.31 Oct05 low
- *Y123.03 Oct02 low, Sep29 low
- *Y122.93 Lower 1.0% 10-dma envelope
- *Y122.45/38 Lower Bollinger Band (2%)/Sep28 low
- *Y122.06/95 Jul20 low/100-wma
AUD/USD: MNI Key Levels
- *$0.7281/82 Upper Boll Band (2%)/Cloud top
- *$0.7263 50-mma*$0.7243/45/54 Oct09 high/200-wma/Sep17 low
- *$0.7235/37 Sep22 high, Oct12 high/Upper 1.0% 10-dma env
- *$0.7204/07/18 55-dma/50-dma/Oct13 high
- *$0.7188/91 100-hma/Oct14 high
- *$0.7160/70/73 21-dma/Intraday high/200-hma
- *$0.7135 ***CURRENT MARKET PRICE 06:01BST THURSDAY***
- *$0.7124/23 Cloud base, Intraday low/Oct08 low
- *$0.7096/94 Oct07 low/Lower 1.0% 10-dma env, 100-dma
- *$0.7070 Sep29 low
- *$0.7029/22 Sep28 low/Lower 2.0% 10-dma env, Lower Boll Band (2%)
- *$0.7006 Sep25 low
- *$0.6973/63 Jul20 low/Jul16 low
- *$0.6957/51 Lower Boll Band (3%)/Lower 3.0% 10-dma env
USD/CAD: MNI Key Levels
- *C$1.3332/41 Upper 1.0% 10-dma env/Oct07 high
- *C$1.3261/73 21-dma/Oct08 high
- *C$1.3242 Oct06 low
- *C$1.3214/26 50-dma/55-dma
- *C$1.3198/02 200-hma/Oct09 high
- *C$1.3163/75 200-wma, Oct14 high/50-mma
- *C$1.3158/62 Intraday high/Cloud base
- *C$1.3147 ***CURRENT MARKET PRICE 06:04BST THURSDAY***
- *C$1.3143/35 Intraday low/100-hma
- *C$1.3117 Oct14 low
- *C$1.3099/87 Oct13 low/Sep08 low
- *C$1.3076/68 Lower Boll Band (2%)/Lower 1.0% 10-dma env
- *C$1.3038 Sep02 low
- *C$1.2994/81 YTD Sep01 low/Lower Boll Band (3%)
- *C$1.2976 Jan08 low
Why MNI
MNI is the leading provider
of intelligence and analysis on the Global Fixed Income, Foreign Exchange and Energy markets. We use an innovative combination of real-time analysis, deep fundamental research and journalism to provide unique and actionable insights for traders and investors. Our "All signal, no noise" approach drives an intelligence service that is succinct and timely, which is highly regarded by our time constrained client base.Our Head Office is in London with offices in Chicago, Washington and Beijing, as well as an on the ground presence in other major financial centres across the world.