
June 28, 2024 00:00 GMT
Tokyo Core CPI Ticks Higher, Job-To-Applicant Ratio Eases
JAPAN DATA
Tokyo June CPI was a touch above market expectations and showed sequential y/y pick up relative to May. The headline rose 2.3%y/y in line with forecasts and versus 2.2% prior. The ex fresh food measure was 2.1% (against a 2.0% forecast and 1.9% prior), while ex fresh food and energy rose 1.8% (forecast 1.7% and prior 1.7%).
- The chart below plots these measures, which are showing some signs of basing around the 2% level from a y/y standpoint.
- In terms of the detail, m/m trends were mixed. The main drags came from food (-0.3%, with fresh food down 3.4%m/m) and entertainment -1.1%m/m. Entertainment has fallen for the second straight month after a generally positive higher in the previous 6 months.
- Utilities, up 3.2%m/m was the biggest positive, along with household goods and medical care. Education is back to flat after falling sharply in April. Still services inflation was up 0.3%m/m in seasonally adjusted terms
- In y/y terms, trends didn't change dramatically versus May in terms for the sub-indices. Note only education is seeing a negative y/y read.
- On balance this data should support a further trimming of the BoJ's accommodative policy stance.
- Other data showed a steady unemployment rate at 2.6%, although the job to applicant ratio fell to 1.24 from 1.26, lows in the index back to the first part of 2022.
- IP growth for May was stronger than forecast, rising 2.8% y/y, versus 2.0% forecast (prior -0.9%).
Fig 1: Tokyo CPI Y/Y Trends
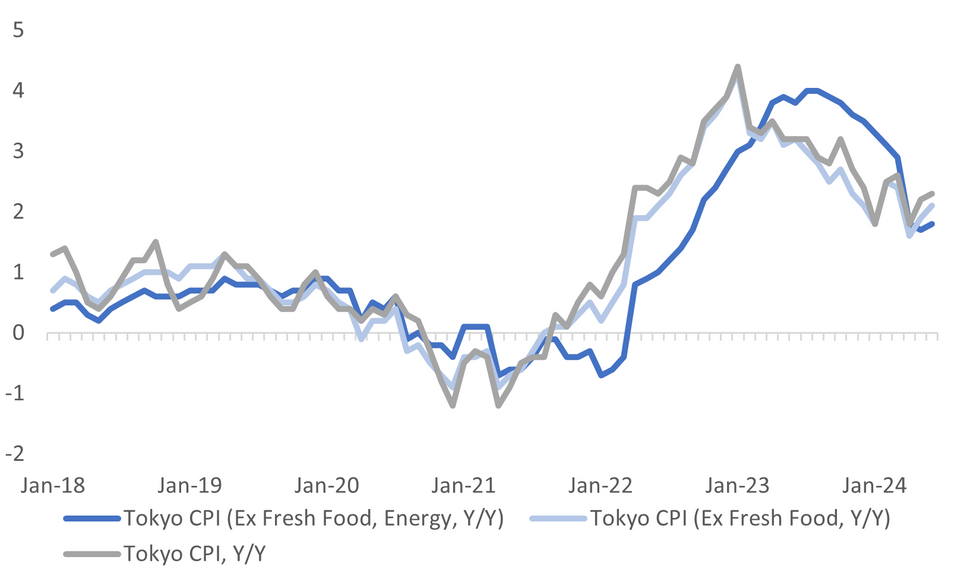
Source: MNI - Market News/Bloomberg
Keep reading...Show less
259 words