
Why MNI
MNI is the leading provider
of intelligence and analysis on the Global Fixed Income, Foreign Exchange and Energy markets. We use an innovative combination of real-time analysis, deep fundamental research and journalism to provide unique and actionable insights for traders and investors. Our "All signal, no noise" approach drives an intelligence service that is succinct and timely, which is highly regarded by our time constrained client base.Our Head Office is in London with offices in Chicago, Washington and Beijing, as well as an on the ground presence in other major financial centres across the world.
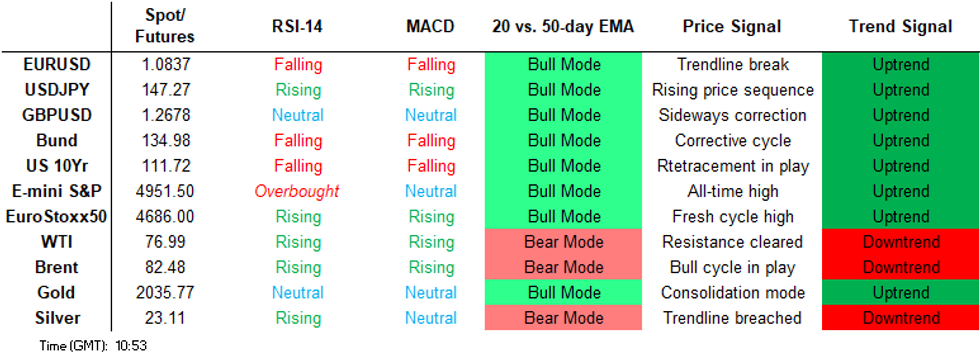
Price Signal Summary - S&P E-Minis Bull Cycle Extends
- In the equity space, the uptrend in S&P E-Minis remains intact and Monday’s rally reinforces current conditions. Resistance at 4841.50, the Dec 28 high, has recently been cleared, confirming an extension of the uptrend. Sights are on 4982.62 next,1.50 projection of Nov 10 - Dec 1 - 7 price swing. Initial support is at 4844.18 20- day EMA. EUROSTOXX 50 futures traded sharply higher last week and the contract started this week’s session on a bullish note, with price holding on to its recent gains. Key resistance at 4634.00, the Dec 14 high, has been cleared. The break confirms a resumption of the medium-term uptrend and sights are on the 4700.00 handle next. Initial firm support lies at 4522.80, the 20-day EMA.
- In FX, EURUSD traded lower Monday, starting the week on a bearish note. A downtrend remains intact for now. 1.0822, the Jan 23 low, has been breached and this confirms a resumption of the current downtrend. Sights are on 1.0793, 50.0% of the Oct - Dec bull leg. On the upside, clearance of 1.0932, the Jan 24 high, would signal scope for a stronger recovery. GBPUSD is in consolidation mode and continues to trade inside its range. Key resistance is at 1.2827, the Dec 28 high, and key support lies at 1.2597, the Jan 17 low. Both price points represent important directional triggers. A break of 1.2827 would resume the uptrend and open 1.2881, 76.4% of the Jul 14 - Oct 4 bear leg. For bears, clearance of 1.2597 would highlight a S/T reversal and signal scope for weakness towards the 1.2500 handle, the Dec 13 low. The USDJPY trend outlook remains bullish and the pair is holding on to the bulk of its recent gains. Moving average studies have recently crossed and are in a bull-mode set-up. This reinforces the current trend condition. Sights are on 149.16 next, 76.4% of the Nov 13 - Dec 28 bull leg. Initial firm support to watch lies at 146.14, the 50-day EMA.
- On the commodity front, Gold remains in consolidation mode and continues to trade above the Jan 17 low of $2001.9. The recent print below the 50-day EMA and the break of support at $2013.4, the Jan 11 low, has strengthened a bearish threat and a resumption of weakness would open a key level at $1973.2, the Dec 13 low. For bulls, clearance of 2062.3, the Jan 12 high, is required to signal a reversal. In the oil space, WTI futures traded higher last week. The contract has breached resistance at $76.31, the Dec 26 high. The clear break of this hurdle undermines the recent bearish theme and highlights a stronger short-term bullish condition. A continuation higher would open $79.56, the Nov 30 high. On the downside, initial key support lies at $74.55, the 50-day EMA. Monday’s move lower appears - for now - to be a correction.
- In the FI space, Bund futures traded higher earlier. Recent gains suggest that the bull cycle is likely to extend. The move higher does undermine the recent bearish theme and price has traded above the 20-day EMA, at 134.91. A continuation higher would expose 136.16, the Jan 5 / 8 high where a break would strengthen a bullish theme. For bears, a move below 133.55, the Jan 25 low, is required to reinstate a bearish theme. The trend needle in Gilt futures continues to point south and recent gains appear - for now - to be a correction. The contract has cleared support at 99.60, the Jan 5 low. This confirmed a resumption of the downtrend that started Dec 27, signalling scope for a continuation lower towards 97.39, the Dec 11 low. Firm resistance to watch is 99.39, the 20-day EMA. It has been pierced, a clear break of the average would ease bearish pressure and open 100.00.
FOREIGN EXCHANGE
EURUSD TECHS: Bear Extension
- RES 4: 1.1139 High Dec 28 and the bull trigger
- RES 3: 1.1077 76.4% retracement of the Dec 28 - Jan 5 sell-off
- RES 2: 1.1046 High Jan 2
- RES 1: 1.0932/98 High Jan 24 / 5 and a reversal trigger
- PRICE: 1.0826 @ 05:42 GMT Jan 30
- SUP 1: 1.0793 50.0% retracement of the Oct - Dec bull leg
- SUP 2: 1.0724 Low Dec 8
- SUP 3: 1.0712 61.8% retracement of the Oct - Dec bull leg
- SUP 4: 1.0656 Low Nov 10
EURUSD traded lower Monday, starting the week on a bearish note. A downtrend remains intact for now. 1.0822, the Jan 23 low, has been breached and this confirms a resumption of the current downtrend. Sights are on 1.0793, a Fibonacci retracement. On the upside, clearance of 1.0932, the Jan 24 high, would signal scope for a stronger recovery and expose key short-term resistance at 1.0998, the Jan 5 high and a reversal trigger.
GBPUSD TECHS: Directional Parameters Remain Intact
- RES 4: 1.2996 High Jul 27
- RES 3: 1.2881 76.4% retracement of the Jul 14 - Oct 4 bear leg
- RES 2: 1.2827 High Dec 28 and the bull trigger
- RES 1: 1.2775 High Jan 24
- PRICE: 1.2706 @ 05:56 GMT Jan 30
- SUP 1: 1.2642/2597 50-day EMA / Low Jan 17 and key S/T support
- SUP 2: 1.2525 38.2% retracement of the Oct 4 - Dec 28 bull phase
- SUP 3: 1.2500 Low Dec 13
- SUP 4: 1.2432 50.0% retracement of the Oct 4 - Dec 28 bull phase
GBPUSD is in consolidation mode and continues to trade inside its range. Key resistance is at 1.2827, the Dec 28 high, and key support lies at 1.2597, the Jan 17 low. Both price points represent important directional triggers. A break of 1.2827 would resume the uptrend and open 1.2881, a Fibonacci retracement. For bears, clearance of 1.2597 would highlight a S/T reversal and signal scope for weakness towards the 1.2500 handle, the Dec 13 low.
EURGBP TECHS: Heading South
- RES 4: 0.8768 High Nov 20
- RES 3: 0.8715 High Dec 28 and the bull trigger
- RES 2: 0.8676 High Jan 3
- RES 1: 0.8580/8612 20- and 50-day EMA values
- PRICE: 0.8519 @ 06:17 GMT Jan 30
- SUP 1: 0.8513 Low Jan 29
- SUP 2: 0.8493 Low Aug 23 2023 and a key medium-term support
- SUP 3: 0.8487 1.0% 10-dma envelope
- SUP 4: 0.8454 61.8% of the Mar 7 - Sep 26 ‘23 bull phase
The trend needle in EURGBP continues to point south. Last week's move lower resulted in a break of support at 0.8549, the Dec 11 low, strengthening the current bearish condition. Monday’s extension, further reinforces the downtrend. Sights are on 0.8493, the Aug 23 ‘23 low and a key support. The 50-day EMA, at 0.8612, is the initial firm resistance to watch. First resistance is at 0.8580, the 20-day EMA.
USDJPY TECHS: Trend Conditions Remains Bullish
- RES 4: 150.78 High Nov 17
- RES 3: 149.75 High Nov 22
- RES 2: 149.16 76.4% retracement of the Nov 13 - Dec 28 bull leg
- RES 1: 148.80 High Jan 19
- PRICE: 147.31 @ 06:40 GMT Jan 30
- SUP 1: 146.66 Low Jan 24
- SUP 2: 146.14 50-day EMA
- SUP 3: 144.36 Low Jan 12 and key S/T support
- SUP 4: 143.42 Low Jan 9
The USDJPY trend outlook remains bullish and the pair is holding on to the bulk of its recent gains. Moving average studies have recently crossed and are in a bull-mode set-up. This reinforces the current trend condition. Sights are on 149.16 next, a Fibonacci retracement. Key short-term support has been defined at 144.36, the Jan 12 low. A break of this level is required to signal a top. Initial firm support to watch lies at 146.14, the 50-day EMA.
EURJPY TECHS: Corrective Cycle Remains In Play
- RES 4: 164.30 High Nov 16 and key resistance
- RES 3: 163.72 High Nov 27
- RES 2: 162.25 High Nov 29
- RES 1: 160.97/161.86 High Jan 25 / 19 and the bull trigger
- PRICE: 159.28 @ 07:25 GMT Jan 30
- SUP 1: 159.14 50-day EMA
- SUP 2: 158.55 Low Jan 12 and a key short-term support
- SUP 3: 157.21 Low Jan 9
- SUP 4: 156.08 Low Jan 4
The EURJPY trend condition remains bullish and the latest pullback appears to be a correction - for now. The recent breach of resistance at 160.18, the Jan 11 high, confirmed a resumption of the uptrend. Note that 161.69, 76.4% of the Nov 16 - Dec 7 bear leg, has been pierced. A clear break of this retracement point would open 162.25, the Nov 29 high. Initial firm support is at 158.55, the Jan 12 low. A break of it would be a bearish development.
AUDUSD TECHS: Bear Flag
- RES 4: 0.6900 High Jun 16 and a key resistance
- RES 3: 0.6871 High Dec 28 and the bull trigger
- RES 2: 0.6729/71 High Jan 12 / 3
- RES 1: 0.6626 50-day EMA
- PRICE: 0.6610 @ 07:28 GMT Jan 30
- SUP 1: 0.6526/25 Low Dec 7 and key support / Low Jan 17
- SUP 2: 0.6500 61.8% Fibonacci retracement for Oct - Dec upleg
- SUP 3: 0.6453 Low Nov 17
- SUP 4: 0.6412 76.4% Fibonacci retracement for Oct - Dec upleg
AUDUSD remains in consolidation mode. From a trend perspective, a bearish theme continues to dominate and the latest pause appears to be a flag formation - a bearish continuation pattern. A resumption of weakness would open 0.6500, a Fibonacci retracement and the next objective. Clearance of this level would further strengthen the current bearish theme. Initial resistance is at 0.6627, the 50-day EMA.
USDCAD TECHS: Corrective Pullback Extends
- RES 4: 1.3661 High Nov 27
- RES 3: 1.3623 61.8% retracement of the Nov 1 - Dec 27 bear leg
- RES 2: 1.3608 High Dec 13
- RES 1: 1.3542 High Jan 17 and the bull trigger
- PRICE: 1.3408 @ 07:54 GMT Jan 30
- SUP 1: 1.3382 Low Jan 15
- SUP 2: 1.3343 Low Jan 12
- SUP 3: 1.3288/3177 Low Jan 5 / Low Dec 27
- SUP 4: 1.3093 Low Jul 14 and key support
The latest short-term pullback in USDCAD is - for now - considered corrective. Recent gains have reinforced a bullish theme and sights are on 1.3542, the Jan 17 high and bull trigger. Clearance of this level would confirm a resumption of the bull cycle that started Dec 27 and open 1.3623, 61.8% of the Nov 1 - Dec 27 bear leg. The next key support lies at 1.3343, the Jan 12 low. A break of this level would be a bearish development.
FIXED INCOME
BUND TECHS: (H4) Has Traded Above The 20-Day EMA
- RES 4: 139.39 3.764 proj of the Nov of the 13 - 17 - 24 price swing
- RES 3: 137.96/138.84 High Jan 4 / High Dec 27 and the bull trigger
- RES 2: 136.16 High Jan 5 / 8
- RES 1: 135.50 High Jan 16
- PRICE: 135.29 @ 05:20 GMT Jan 30
- SUP 1: 133.55 Low Jan 25 and the bear trigger
- SUP 2: 133.42 Low Dec 4
- SUP 3: 132.89 50.0% retracement of the Oct 4 - Dec 27 bull phase
- SUP 4: 132.29 Low Nov 30
Bund futures are trading higher and early signals suggest that these latest gains are likely to extend. The move higher does undermine the recent bearish theme and price has traded above the 20-day EMA, at 134.91. A continuation higher would expose 136.16, the Jan 5 / 8 high where a break would strengthen a bullish theme. For bears, a move below 133.55, the Jan 25 low, is required to reinstate a bearish theme.
BOBL TECHS: (H4) Corrective Bounce Extends
- RES 4: 119.640 High Jan 4
- RES 3: 119.00 Round number resistance
- RES 2: 118.590 High Jan 12 and a key short-term resistance
- RES 1: 118.360 High Jan 16
- PRICE: 118.190 @ 05:35 GMT Jan 30
- SUP 1: 117.280 Low Jan 25 and the bear trigger
- SUP 2: 117.060 Low Dec 1
- SUP 3: 117.000 Round number support
- SUP 4: 116.830 Low Nov 29
A bearish cycle in Bobl futures remains intact, however, recent gains signal potential for a continuation higher near-term. The contract has traded above the 20-day EMA, at 117.993, and this has exposed resistance at 118.590, the Jan 12 high and a key short-term resistance. Clearance of this level would highlight a stronger reversal. On the downside, key support and the bear trigger has been defined at 117.280, the Jan 25 low.
SCHATZ TECHS: (H4) Remains Above Its Recent Lows
- RES 4: 106.640 High Dec 29 and the bull trigger
- RES 3: 106.360 Low Jan 3
- RES 2: 106.270 High Jan 5 and key short-term resistance
- RES 1: 106.200 50.0% retracement of the Dec 29 - Jan 25 bear leg
- PRICE: 106.090 @ 05:57 GMT Jan 30
- SUP 1: 105.760 Low Jan 25 and the bear trigger
- SUP 2: 105.730 Low Nov 30
- SUP 3: 105.660 High Nov 17
- SUP 4: 105.470 Low Nov 28
The downtrend in Schatz futures remains intact and the latest recovery appears to be a correction. The contract has traded above the 20-day EMA, at 106.040. This signals scope for a continuation higher and potentially exposes resistance at 106.270, the Jan 5 high. A breach of this hurdle would highlight a stronger reversal. On the downside, weakness through support at 105.760, the Jan 25 low, would reinstate a bearish theme.
GILT TECHS: (H4) Watching Resistance
- RES 4: 101.98 High Jan 3
- RES 3: 100.81 High Jan 5
- RES 2: 100.00 Round number resistance
- RES 1: 99.39/55 20-day EMA / Intraday high
- PRICE: 99.29 @ 09:59 GMT Jan 30
- SUP 1: 97.57 Low Jan 25
- SUP 2: 97.39 Low Dec 11 and a key support
- SUP 3: 96.67 Low Dec 5
- SUP 4: 96.10 Low Nov 30
The trend needle in Gilt futures continues to point south and recent gains appear - for now - to be a correction. The contract has cleared support at 99.60, the Jan 5 low. This confirmed a resumption of the downtrend that started Dec 27, signalling scope for a continuation lower towards 97.39, the Dec 11 low. Firm resistance to watch is 99.39, the 20-day EMA. It has been pierced, a clear break of the average would ease bearish pressure.
BTP TECHS: (H4) Approaching Resistance
- RES 4: 122.63 High Dec 7 2022 (cont)
- RES 3: 122.18 3.00 proj of the Nov 10 - 17 - 24 price swing
- RES 2: 121.43 2.764 proj of the Nov 10 - 17 - 24 price swing
- RES 1: 119.23/77 High Jan 12 and a key S/T resistance / High Jan 4
- PRICE: 118.84 @ Close Jan 29
- SUP 1: 116.98 Low Jan 25 and the bear trigger
- SUP 2: 116.85 50-day EMA
- SUP 3: 115.18 Low Dec 4
- SUP 4: 114.10 50.0% retracement of the Oct 19 - Dec 27 bull cycle
BTP futures traded higher Monday, extending the recovery from 116.98, the Jan 25 low. Price has traded above the 20-day EMA and this exposes initial key resistance at 119.23, the Jan 12 high. A clear break of this level would highlight a base and a potential resumption of the primary uptrend. On the downside, clearance of last week’s 116.98 low would instead confirm a resumption of the recent bearish cycle.
US 10YR FUTURE TECHS: (H4) Gains Considered Corrective
- RES 4: 114-06+ 2.00 proj of the Oct 19 - Nov 3 - Nov 13 price swing
- RES 3: 114-00 Round number resistance
- RES 2: 113-12 High Dec 27 and the bull trigger
- RES 1: 112-01+/112-26+ High Jan 17 / 12
- PRICE: 111-16 @ 19:14 GMT Jan 29
- SUP 1: 110-26 Low Jan 19
- SUP 2: 110-16 Low Dec 13
- SUP 3: 109-31+ Low Dec 11 and a key short-term support
- SUP 4: 109-17 50.0% of the Oct 19 - Dec 27 bull phase
The trend needle in Treasuries continues to point south and short-term gains are considered corrective for now. Sights are on 110-26, the Jan 19 low. A break of this level would confirm a resumption of the current bear cycle and highlight a clear break of the 50-day EMA, at 111-03+. This would set the scene for a move towards 110-16, the Dec 13 low. Firm resistance is 112-26+, the Jan 12 high. Initial resistance is at 112-01+, the Jan 17 high.
EQUITIES
EUROSTOXX50 TECHS: (H4) Holding On To Its Latest Gains
- RES 4: 4753.50 1.618 projection of the Nov 8 - 24 - 28 price swing
- RES 3: 4725.50 1.50 projection of the Nov 8 - 24 - 28 price swing
- RES 2: 4700.00 Round number resistance
- RES 1: 4682.00 Intraday high
- PRICE: 4678.00 @ 05:50 GMT Jan 30
- SUP 1: 4599.00/4549.10 High Jan 2 / 20-day EMA
- SUP 2: 4402.00 Low Jan 17 and key short-term support
- SUP 3: 4370.00 Low Nov 28
- SUP 4: 4334.00 50.0% retracement of the Oct 27 - Dec 14 bull leg
Eurostoxx 50 futures traded sharply higher last week and the contract started this week’s session on a bullish note, with price holding on to its recent gains. Key resistance at 4634.00, the Dec 14 high, has been cleared. The break confirms a resumption of the medium-term uptrend and sights are on the 4700.00 handle next. Initial firm support lies at 4522.80, the 20-day EMA. Key trend support has been defined at 4402.00, the Jan 17 low.
E-MINI S&P TECHS: (H4) Northbound
- RES 4: 5012.80 1.618 proj of Nov 10 - Dec 1 - 7 price swing
- RES 3: 5000.00 Psychological round number
- RES 2: 4982.62 1.50 proj of Nov 10 - Dec 1 - 7 price swing
- RES 1: 4957.25 Intraday high
- PRICE: 4952.75 @ 06:27 GMT Jan 30
- SUP 1: 4844.18/4744.97 20- and 50-day EMA values
- SUP 2: 4702.00 Low Jan 5
- SUP 3: 4594.00 Low Nov 30
- SUP 4: 4550.75 Low Nov 16
The uptrend in S&P E-Minis remains intact and Monday’s rally reinforces current conditions. Resistance at 4841.50, the Dec 28 high, has recently been cleared, confirming an extension of the price sequence of higher highs and higher lows. Moving average studies remain in a bull-mode condition too, highlighting positive market sentiment. Sights are on 4982.62 next, a Fibonacci projection. Key support lies at 4744.97, the 50-day EMA.
COMMODITIES
BRENT TECHS: (J4) Bull Cycle Remains In Play
- RES 4: $89.08 - High Oct 20
- RES 3: $87.12 - High Oct 27
- RES 2: $86.03 - 76.4% retracement of the Sep 15 - Dec 13 bear cycle
- RES 1: $84.17 - High Jan 29
- PRICE: $82.11 @ 06:58 GMT Jan 30
- SUP 1: $79.28 - 50-day EMA
- SUP 2: $76.13 - Low Jan 17
- SUP 3: $74.82 - Low Jan 03
- SUP 4: $72.96 - Low Dec 13 and the bear trigger
Brent futures traded higher last week, extending the bull cycle that resulted in a break of $81.22, Dec 26 high. The breach undermines the recent bearish theme and highlights a stronger bullish condition. Monday’s sell-off appears to be a correction. Yesterday’s initial gains resulted in a print above $83.84, the Nov 30 high and the next key hurdle for bulls. A clear break would open $86.03, a Fibonacci retracement. Initial support is at $79.28, the 50-day EMA.
WTI TECHS: (H4) Resistance Remains Exposed
- RES 4: $86.68 - High Sep 19 and a key resistance
- RES 3: $85.71 - High Oct 20
- RES 2: $82.34 - 76.4% retracement of the Sep 19 - Dec 13 bear cycle
- RES 1: $79.56 - High Nov 30 and a key short-term resistance
- PRICE: $77.01 @ 07:10 GMT Jan 30
- SUP 1: $74.63/70.62 - 50-day EMA / Low Jan 17
- SUP 2: $69.56 - Low Jan 3
- SUP 3: $68.28 - Low Dec 13 and the bear trigger
- SUP 4: $65.63 - Low Jun 12
WTI futures traded higher last week. The contract has breached resistance at $76.31, the Dec 26 high. The clear break of this hurdle undermines the recent bearish theme and highlights a stronger short-term bullish condition. A continuation higher would signal scope for a climb towards $79.56, the Nov 30 high. On the downside, initial key support lies at $74.55, the 50-day EMA. Monday’s move lower appears - for now - to be a correction.
GOLD TECHS: Resistance Remains Intact, For Now
- RES 4: $2135.4 - High Dec 4 and all-time high
- RES 3: $2097.1 - 76.4% retracement of the Dec 4 - 13 bear leg
- RES 2: $2062.3/2088.5 - High Jan 12 / High Dec 28
- RES 1: $2039.4 - High Jan 19
- PRICE: $2034.8 @ 07:16 GMT Jan 30
- SUP 1: $2001.9 - Low Jan 17
- SUP 2: $1973.2 - Low Dec 13 and key support
- SUP 3: $1931.7 - Low Nov 13
- SUP 4: $1908.3 - Low Oct 16
Gold remains in consolidation mode and continues to trade above the Jan 17 low of $2001.9. The recent print below the 50-day EMA and the break of support at $2013.4, the Jan 11 low, has strengthened a bearish threat and a resumption of weakness would open a key level at $1973.2, the Dec 13 low. For bulls, clearance of 2062.3, the Jan 12 high, is required to signal a reversal. This would expose $2088.5, the Dec 28 high.
SILVER TECHS: Corrective Cycle
- RES 4: $26.135 - High May 5 and a key resistance
- RES 3: $25.761 - High Dec 4 and key resistance
- RES 2: $24.606/994 - High Dec 22 / 76.4% of Dec 4 - 13 bear leg
- RES 1: $23.534 - High Jan 12
- PRICE: $23.202 @ 08:00 GMT Jan 30
- SUP 1: $21.883 - Low Nov 13 and a key support
- SUP 2: $20.689 - Low Oct 3 and the bear trigger
- SUP 3: $19.904 - Low Mar 10 and a key support
- SUP 4: $19.904 - Low Mar 10 2023
A bearish theme in Silver remains intact and the latest recovery appears to be a correction - for now. The recent breach of support at $22.510, the Dec 13 low, signals scope for a move to $21.883, the Nov 13 low. A break of this support would further strengthen the bearish theme. On the upside, initial key short-term resistance is at $23.534, the Jan 12 high. A break of this level would highlight a stronger reversal.
Why MNI
MNI is the leading provider
of intelligence and analysis on the Global Fixed Income, Foreign Exchange and Energy markets. We use an innovative combination of real-time analysis, deep fundamental research and journalism to provide unique and actionable insights for traders and investors. Our "All signal, no noise" approach drives an intelligence service that is succinct and timely, which is highly regarded by our time constrained client base.Our Head Office is in London with offices in Chicago, Washington and Beijing, as well as an on the ground presence in other major financial centres across the world.