
Why MNI
MNI is the leading provider
of intelligence and analysis on the Global Fixed Income, Foreign Exchange and Energy markets. We use an innovative combination of real-time analysis, deep fundamental research and journalism to provide unique and actionable insights for traders and investors. Our "All signal, no noise" approach drives an intelligence service that is succinct and timely, which is highly regarded by our time constrained client base.Our Head Office is in London with offices in Chicago, Washington and Beijing, as well as an on the ground presence in other major financial centres across the world.
- JGBs were richer, but finished off best levels, with JGB futures failing to test their post-BoJ peak as the adjustment to the surprise YCC tweak continued.
- The USD struggled in Asia-Pac dealing.
- Today's docket doesn't present much in the way of key inputs for G10 markets, with GDP revisions for the UK and U.S. due.
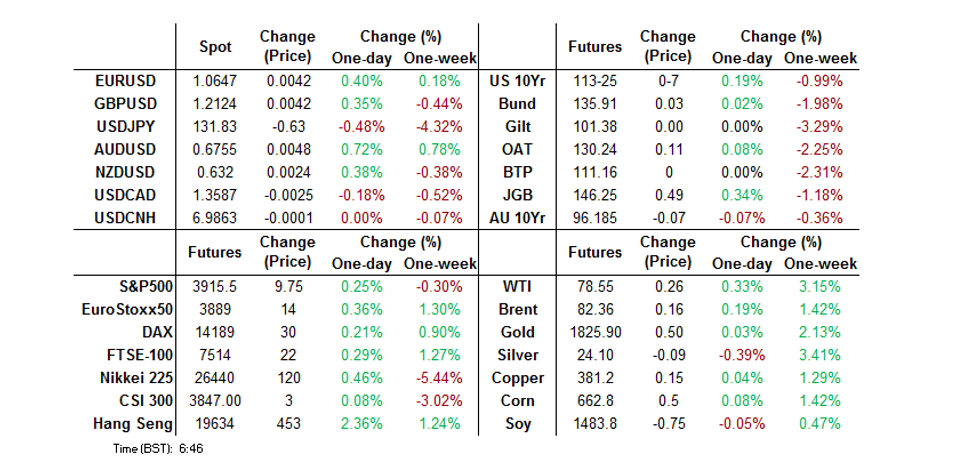
US TSYS: A Touch Firmer Overnight On Broader Inputs
A bid in JGBs and a block buy in TY futures (+1,896) supported Tsys overnight, although some cheapening in ACGBs and a pullback from best levels in the JGB space probably capped the bid.
- That leaves cash Tsys ~1-2bp richer across the major benchmarks, with intermediates outperforming at the margin after lagging during Wednesday’s relatively modest (at least based on net daily change) rally. TYH3 is +0-06 at 113-24, 0-00+ off the peak of its 0-05 range, on volume of ~64K.
- There was a lack of meaningful macro headline flow overnight, outside of U.S. President Biden pledging to back Ukraine for “as long as it takes” re: the conflict with Russia. This left the aforementioned cross-market direction and block flow at the fore. We also believe that U.S. Tsys may have benefitted from spread based demand vs. ACGBs (as we have covered elsewhere).
- Looking ahead, weekly jobless claims data, revised Q3 GDP readings and the Kansas City Fed m’fing index are due in NY hours. We will also get 5-Year TIPS supply.
JGBS: Firmer, But Off Best Levels At The Bell
JGB futures extended on their overnight session gains during the Tokyo morning, with short covering perhaps playing a part.
- The contract has since eased back from best levels after gapping higher at the afternoon open, closing +49. Note that bulls failed to challenge the contract’s post-BoJ high of 146.74, with the vol. continuing.
- An early bull flattening impetus gave way to outperformance in 10s, with the major cash JGB benchmarks running flat to 8bp richer into the close.
- Low offer to cover ratios in the details of the latest round of BoJ Rinban purchases (after the Bank stuck with its focus on the 3- to 10-Year zone, as it looks to facilitate the functioning of its new YCC settings) helped underpin intermediates, resulting in the post-lunch break richening. Reports pointing to a downtick in JGB issuance in the next FY also helped that bid, before the aforementioned fade from best levels., which lacked a clear catalyst.
- Twist steepening on the swap curve may have also been a limiting factor, resulting in mixed swap spread performance (tighter to little changed in the front end of the curve, with a widening theme then extending the further out the curve you look).
- Tomorrow’s local docket is headlined by national CPI data and the outdated minutes from the BoJ’s Oct meeting.
JGBS: Implied Vol. Comfortably Below YtD Peaks
Note that although the implied volatility of JGB futures has pushed higher in the wake of the BoJ’s surprise YCC tweak, the JPX JGB VIX Measure sits somewhat shy of peaks observed around the 3 major challenges of the BoJ’s YCC settings seen earlier in ’22. Why? Our best guess is that the new 50bp YCC cap is more subdued than some of the alternatives that were being priced into the measure during the aforementioned challenges, while the finite outcome naturally provides less variability than the unknown outcomes speculated on earlier in the year
Fig. 1: JPX JGB VIX
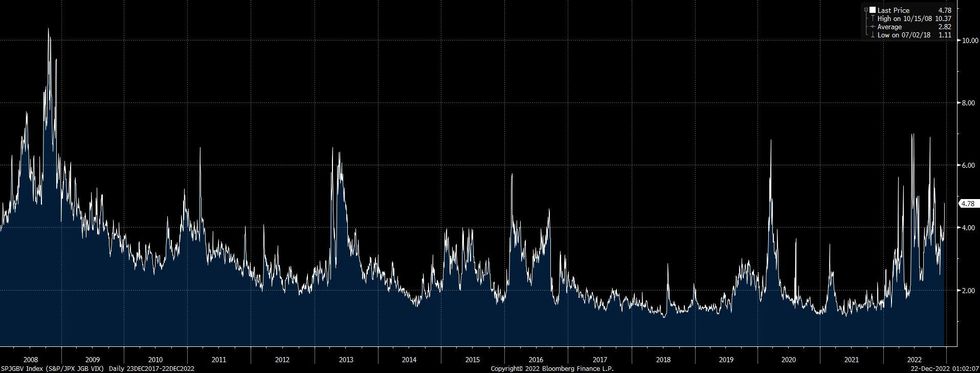
Source: MNI - Market News/Bloomberg
JAPAN: Japan Sells Foreign Bonds Again
The Japanese MoF’s weekly international security flow data covering last week revealed that Japanese investors were net sellers of foreign bonds for the second consecutive week (and for the seventh time in eight weeks). Expect this trend to continue given BoJ monetary policy dynamics and subsequent moves in 10-Year JGB yields, alongside the still elevated FX-hedge costs that Japanese investors are currently burdened with and still steep domestic yield curve.
- Japanese investors were small net buyers of foreign equities for a third straight week.
- On the other side of the ledger, foreign investors were net sellers of both foreign bonds and equities last week, although the net amounts were relatively limited, and smaller than the net purchases witnessed in the respective categories in the week prior.
| Latest Week | Previous Week | 4-Week Rolling Sum | |
| Net Weekly Japanese Flows Into Foreign Bonds (Ybn) | -941.8 | -596.4 | -1057.2 |
| Net Weekly Japanese Flows Into Foreign Stocks (Ybn) | 156.3 | 204.0 | 740.1 |
| Net Weekly Foreign Flows Into Japanese Bonds (Ybn) | -479.1 | 854.0 | -774.8 |
| Net Weekly Foreign Flows Into Japanese Stocks (Ybn) | -667.1 | 1109.3 | 536.5 |
Source: MNI - Market News/Bloomberg/Japanese Ministry Of Finance
AUSSIE BONDS: Bucking The Trend, Likely Weighed By Cross Market Flows
Thursday’s weakness in ACGBs was somewhat peculiar, given the general core FI richening theme and a lack of idiosyncratic news flow.
- This (once again) leads us to conclude that cross-market flows were at the fore, with the AU/U.S. 10-Year yield spread resuming its recent widening, hitting the widest level seen since October, perhaps aided by some exits from crowded compression trade positioning in that spread. AU/NZ cross-market flows may also have been at work, given the relative resilience in NZGBs and movement in AUD/NZD.
- That left YM -6.0 and XM -7.0 at the close, while the wider cash ACGB benchmarks were 4.5-8.0bp cheaper, with bear steepening in play.
- Swap flow seemed to aid the general trajectory, with EFPs a little wider on the day. This came as the Bill curve ran steeper, finishing 1-11bp cheaper through the reds. Meanwhile terminal cash rate pricing in the RBA dated OIS strip nudged higher, finishing a little shy of 3.80%, aiding the cheapening & swap paying dynamics.
NZGBS: Early, Light Richening Holds
NZGBs held on to their early richening, even as their Antipodean counterparts faltered on the back of what seems like cross-market flow-driven moves (which perhaps underpinned NZGBs further).
- That left the major NZGB benchmarks running flat 2.5-4.0bp richer across the curve at the close, with some light bull steepening seen after NZGBs looked to Wednesday’s bid in U.S. Tsys for early support.
- Swap rates are essentially unchanged across the curve.
- The front end of the RBNZ dated OIS strip was flat, with ~71bp of tightening priced for the Feb ’23 gathering and a terminal OCR of ~5.55% currently baked in.
- Broader inputs will shape the NZGB space on Friday, although activity is likely to be limited, unless we get major macro headline flow, with the local docket empty and participants eying the exits ahead of the Christmas holiday.
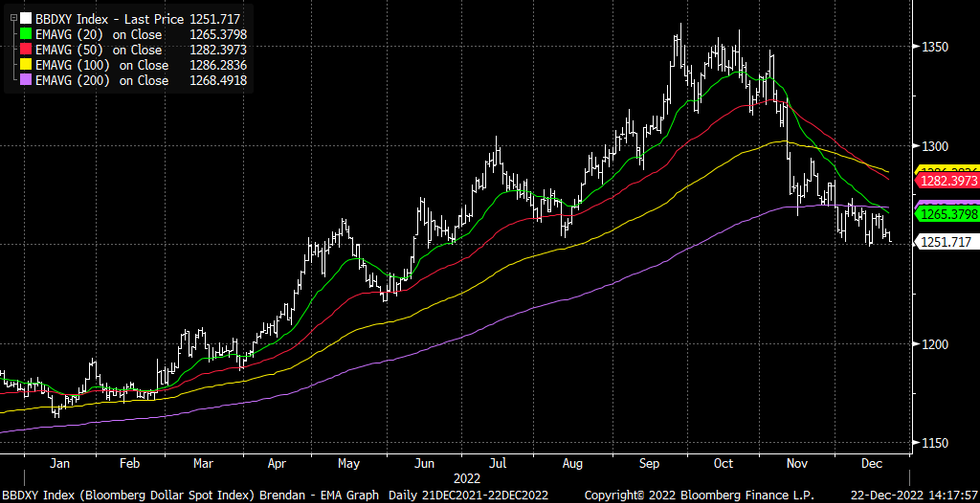
FOREX: USD Index Edging Closer To December Lows, A$ Surges On Cross-Asset Support
USD losses have continued, with the BBDXY now off by ~0.30%, last tracking under 1252. Through December the index has found support around the 1250 level, see the chart below. The set up for the DXY is a little less adverse but this index is also down by a similar amount for the session (last around 103.85/90).
- Similar drivers of USD weakness appear are still in play that were evident earlier (firmer equities/lower US cash Tsy yields). The bigger shift has come from gains seen for regional equities, particularly in Hong Kong.
- The A$ has jumped ahead of the yen to be the leader of G10 moves. AUD/USD is now +0.80% for the day, near 0.6760. Higher AU government bond yields are helping, +5/+7bps across the curve. Firmer commodity prices are as well (copper +0.80% CMX basis), although iron ore has moved down from recent highs, last around $111.50/tonne.
- NZD/USD has been dragged higher, back to 0.6320. The AUD/NZD cross is still rising though. The pair got to 1.0700, fresh highs back to the start of the month, before selling interest emerged. The above-mentioned yield momentum is also likely to be biasing AUD higher.
- USD/JPY hit a low of 131.65, but we are now back to 131.80/85. Still 0.50% higher for the yen so far. Yesterday's low in the pair came around the 131.50 region.
- GDP revisions for the UK and US dominate the data calendar later on, with US jobless claims also due.
Fig 1: BBDXY Approaching December Lows
FX OPTIONS: Expiries for Dec22 NY cut 1000ET (Source DTCC)
- EUR/USD: $1.0500(E614mln), $1.0550(E1.5bln), $1.0630(E575mln), $1.0675-80(E496mln)
- USD/JPY: Y130.00($1.9bln), Y132.50($1.9bln), Y134.30-50($750mln), Y137.00($560mln), Y137.50-60($1.0bln)
- AUD/USD: $0.6650-70(A$696mln), $0.6810(A$831mln)
- USD/CAD: C$1.3480-00($965mln), C$1.3660-75($903mln)
- USD/CNY: Cny6.9000($883mln), Cny6.9500($900mln), Cny7.0900($600mln), Cny7.2000($1.5bln), Cny7.2500($1.2bln)
GLOBAL: Tightening Trends Reflect Larger Inflation Problem In OECD Than Asia
MNI (Australia) - OECD countries inflation problem is significantly worse than that for non-Japan Asia, even if China is excluded. This is reflected in the monetary response we have seen in the two regions. The Bank of Korea, one of the more active Asian central banks, has hiked 275bp cumulatively this cycle compared with 425bp for the Fed.
- Inflation had not yet peaked in the advanced nation bloc in October with headline inflation of 10.7% y/y and core of 7.7%. Data from the US and euro area for November suggest that October may have been the high.
- Covid restrictions have been holding down activity and thus inflation in China. But the non-Japan Asia ex China aggregate was 5.4% in November down from a peak of 6.4% in September. Underlying inflation was stable at 4.1%, well below the OECD average. While headline inflation is exceeding many central banks’ targets, a lot of policy tightening in Asia has been to stabilise currencies, as the USD soared in response to aggressive Fed rate hikes.
- Advanced nations have experienced higher inflation than Asia due to their very tight labour markets, higher European energy prices, larger impact from food prices, greater pass through of costs and more Covid-related fiscal stimulus. Many Asian countries also have fuel price subsidies.

Source: MNI - Market News/Refinitiv/IMF
Fig. 2: OECD vs non-Japan Asia underlying CPI y/y%

Source: MNI - Market News/Refinitiv/IMF
ASIA FX: Won Rebound Continues, Muted Gains Elsewhere, BI Decision Later Today
USD/Asia pairs are lower, for the most part, but outside of the won, gains have trailed moves seen in the G10 space today. PHP and IDR have also struggled against the USD. Still to come is the BI decision, where +25bps is expected, although some forecasters see risks of a +50bps move (see our full preview here). Tomorrow the main focus is likely to rest on the November Singapore CPI print.
- USD/CNH continues to track recent ranges. We were last just above 6.9800, down only slightly from opening levels, despite a -0.30% loss in USD FX indices. The CNY fixing bias was close to neutral today.
- The won continues to outperform. The 1 month USD/KRW NDF hit fresh multi-month lows at 1272, before edging back to 1273/74 currently. The firmer yen (+0.50% for the session), coupled with the strong equity tone are supports. The NPS's increased hedging of overseas assets (from 0 to 10%) is also likely to be an exogenous positive.
- USD/INR continues to track recent ranges, albeit down from recent highs above 82.80. The pair was last at 82.70, still underperforming the broader USD pull back. The RBI minutes, released late yesterday, are consistent with the tightening cycle extending into 2023. Given recent inflation downside surprises the case could be made though for a shift back to 25bps moves (compared with the recent 35/50bps moves).
- USD/IDR spot is not drifting too far away from the 15600 level. Today’s BI meeting is the main focus point, with a 50bps surprise hike potentially needed to see firmer rupiah gains. In the cross asset space, net equity outflows were just over $100mn yesterday, while palm oil prices are flatlining.
- USD/PHP is struggling to see fresh downside sub 55.10. The pair was last around 55.11, while the simple 200 day MA comes in at 55.146. Presumably if we can close below this level at the end of this week it will present a positive technical backdrop for the peso.
ASIA: GDP Expected To Slow In 2023 (Ex China), But Growth Differentials With US/EU Forecast To Rise
Consensus expectations, taken from Bloomberg, for EM Asia GDP growth next year are mostly down on projected 2022 outcomes, see the first chart below.
- The export orientated economies are expected to see decent falls, -0.9 to -1.6ppts across South Korea, Taiwan and Singapore. Malaysia sees the largest absolute fall of -4.4ppts, but outright growth is still expected to healthy at +4% for next year.
- South Korea has the lowest absolute growth forecast of 1.7%, with weaker export growth and tighter domestic financial conditions headwinds.
- The more domestically orientated economies in terms India, Indonesia and the Philippines are also expected to see lower growth, albeit still at elevated rates relative to major developed economies.
- China and Thailand are the clear exceptions where the market is forecasting improved growth outcomes in 2023 relative to this year. For China this largely reflects the shift away from CZS, while Thailand is also expected to benefit from a further recovery in tourism inflows.
Fig 1: EM Asia Growth Forecasts, Slower 2023 Expected (ex China/Thailand)
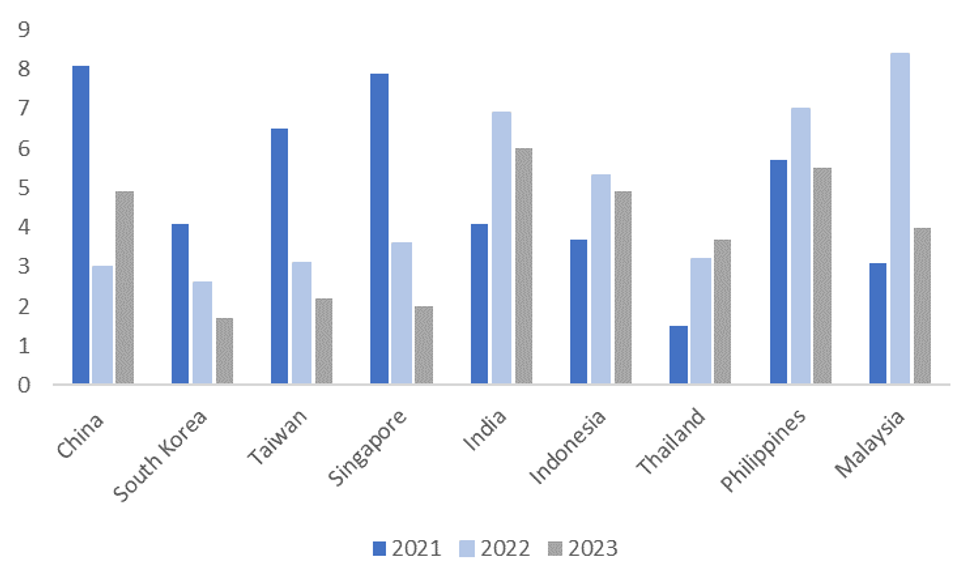
Source: MNI - Market News/Bloomberg
- Despite these downside expectations for most EM Asia economies, the projected growth differential with the US is still forecast to either stay flat in 2023 relative to 2022 or improve for all economies in the region (except Malaysia). The same also applies against the EU area.
- The second chart below plots the y/y change in the J.P. Morgan Asian currency index against the regional growth differential with the US (we project this differential into 2023 using the above consensus forecasts).
- This picture suggests a less adverse backdrop for broader Asian currencies into 2023 compared to this year, assuming these projections are realized. We also accept there will be other important moving parts for the FX backdrop, like Fed policy and commodity prices/terms of trade outlooks.
Fig 2: EM Asia - US GDP Y/Y Differential Versus ADXY Y/Y
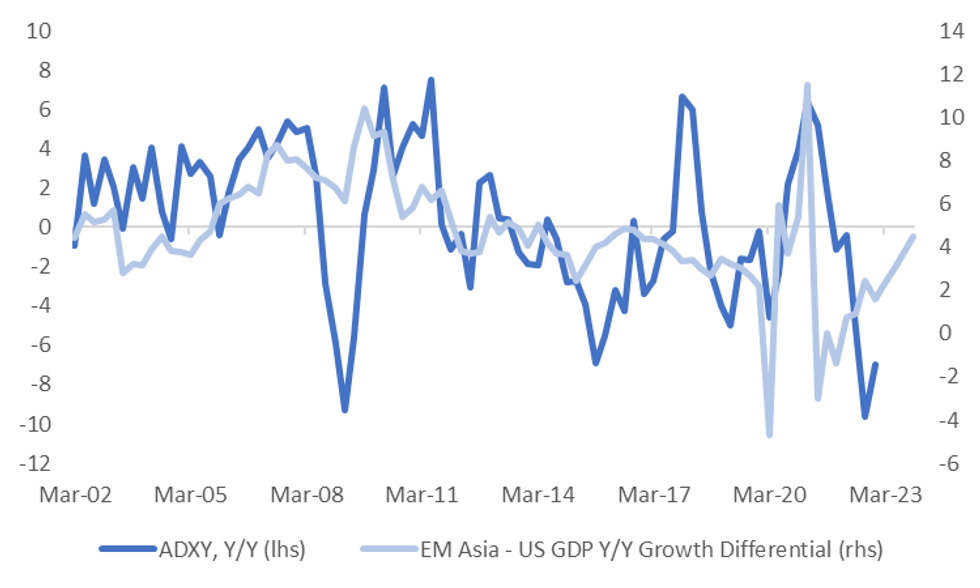
Source: J.P. Morgan/MNI - Market News/Bloomberg
EQUITIES: HSI Leads Regional Move Higher, As China Authorities Pledge More Policy Support
Asia Pac equities are higher across the board (except Indonesia/India). The HSI and China Enterprise Index lead gains, while US/EU futures are also higher (+0.30/+0.40%), providing further support to the regional backdrop.
- The HSI is +2.70%, with the underlying tech index +4.60%. The China Enterprise index is +3.15%. A measure of property developers surged in early trade, amid calls late yesterday from the PBoC Governor for more support for the sector. We are away from best levels though, last around +1.45% for the session.
- Mainland stocks are also higher, the CSI last at +0.76%. State TV reported that the authorities urged the implementation of policies to support the economy and utilize existing policies more effectively, after a state council meeting yesterday. The Shanghai Composite is up a more modest 0.34%.
- Japan stocks are higher, +0.50% for the Nikkei 225, the first gain for the index since last Wednesday. The Kospi (+0.80%) and Taiex (+1.30%) have risen more, supported by major tech index gains during the Wednesday US session.
- Indonesian stocks are down slightly, -0.18%, we do have the BI decision later, +25bps expected. Indian stocks have also opened up weaker, down 0.35% at this stage.
GOLD: Prices Higher As USD Softens
Gold prices are up about 0.3% to around $1819.75/oz after falling 0.2% on Wednesday. It is currently trading just under its intraday high of $1820.15. Bullion has found support from a weaker USD (DXY -0.3%). Fed expectations will shape the 2023 outlook for gold.
- Trend conditions for gold remain bullish and the bull trigger is at $1824.50, the December 13 high. Key short-term support is at $1765.90, the December 5 low, and a break of this would signal a deeper retracement. It’s currently in a pattern of higher highs and higher lows.
- Later today there are US jobless claims and the Chicago and Kansas Fed indices. The focus is on Friday’s personal consumption data which includes the Fed’s preferred measure of inflation for November, the core PCE – price index. There is also Michigan consumer confidence for December and November durable goods data on Friday.
OIL: Prices Continue To Rally But A Lot Of Uncertainty Going Into 2023
Oil prices are up around 0.5% on yesterday’s NY close, as US EIA data showed a drawdown in crude stocks, but have been trading in tight ranges. WTI is trading around $78.70/bbl and during today’s session reached its highest since early December. Brent is around $82.60 just below the intraday high of $82.71. DXY is down 0.3%.
- WTI conditions remain bearish but are in an upward corrective cycle and have traded today above the 20-day EMA of $76.80. The next level to watch on the upside is $79.79, the 50-day EMA. On the downside, the bear trigger is $70.31, the December 9 low. Brent has also broken through its 20-day EMA of $82.03.
- The US EIA reported a 5.89mn bbl drawdown in crude inventories after a 10.23mn build the previous week, which was the lowest at this time of year since 2014.
- There is a lot of uncertainty going into 2023, due to recession fears, the reopening of China, the effect of sanctions on Russian oil supplies and how OPEC will respond to these factors.
- Later today there are US jobless claims and the Chicago and Kansas Fed indices. The focus is on Friday’s personal consumption data which includes the Fed’s preferred measure of inflation for November, the core PCE – price index.
UP TODAY (TIMES GMT/LOCAL)
| Date | GMT/Local | Impact | Flag | Country | Event |
| 22/12/2022 | 0700/0700 | *** |  | UK | GDP Second Estimate |
| 22/12/2022 | 0700/0800 | ** |  | SE | PPI |
| 22/12/2022 | 0700/0800 | ** | | SE | Retail Sales |
| 22/12/2022 | 0720/0220 |  | ID | Indonesia Central Bank Rate Decision | |
| 22/12/2022 | 0745/0845 | * |  | FR | Retail Sales |
| 22/12/2022 | 0900/1000 | * |  | NO | Norway Unemployment Rate |
| 22/12/2022 | 1000/1100 | ** |  | IT | PPI |
| 22/12/2022 | 1100/0600 | * |  | TR | Turkey Benchmark Rate |
| 22/12/2022 | - | | UK | House of Commons Recess Starts | |
| 22/12/2022 | 1330/0830 | * |  | CA | Payroll employment |
| 22/12/2022 | 1330/0830 | ** |  | US | Jobless Claims |
| 22/12/2022 | 1330/0830 | *** | | US | GDP (3rd) |
| 22/12/2022 | 1330/0830 | ** | | US | WASDE Weekly Import/Export |
| 22/12/2022 | 1530/1030 | ** | | US | Natural Gas Stocks |
| 22/12/2022 | 1630/1130 | * | | US | US Bill 08 Week Treasury Auction Result |
| 22/12/2022 | 1630/1130 | ** | | US | US Bill 04 Week Treasury Auction Result |
| 22/12/2022 | 1800/1300 | ** | | US | US Treasury Auction Result for TIPS 5 Year Note |
Why MNI
MNI is the leading provider
of intelligence and analysis on the Global Fixed Income, Foreign Exchange and Energy markets. We use an innovative combination of real-time analysis, deep fundamental research and journalism to provide unique and actionable insights for traders and investors. Our "All signal, no noise" approach drives an intelligence service that is succinct and timely, which is highly regarded by our time constrained client base.Our Head Office is in London with offices in Chicago, Washington and Beijing, as well as an on the ground presence in other major financial centres across the world.