
Why MNI
MNI is the leading provider
of intelligence and analysis on the Global Fixed Income, Foreign Exchange and Energy markets. We use an innovative combination of real-time analysis, deep fundamental research and journalism to provide unique and actionable insights for traders and investors. Our "All signal, no noise" approach drives an intelligence service that is succinct and timely, which is highly regarded by our time constrained client base.Our Head Office is in London with offices in Chicago, Washington and Beijing, as well as an on the ground presence in other major financial centres across the world.
Sterling Strong On Sovereignty Pledge
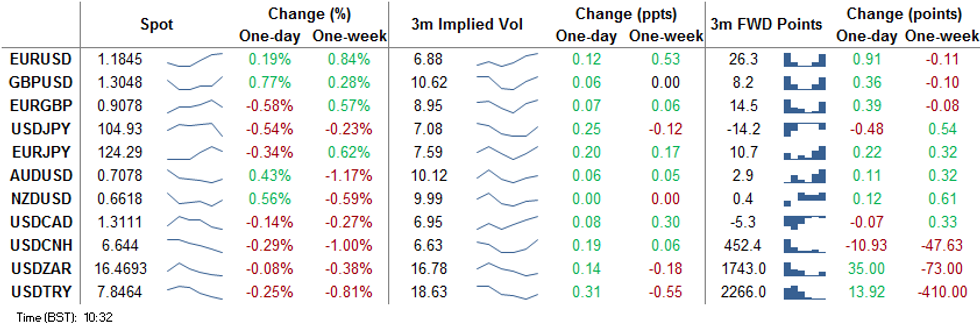
The to-and-fro of Brexit talks continue to exert influence on GBP, which is outperforming all others in G10 early Wednesday. EU negotiator Barnier appeared to formally agree on and assert UK sovereignty, removing a further blockage to the resumption of trade talks between the two parties. While rules surrounding fisheries and a level playing field still need to be agreed on, the market is still erring toward the likelihood of a deal.
GBP/USD rallied convincingly through the $1.3012 50-dma in response, with $1.3083 the next upside target.
The USD is still on the backfoot, prompting another multi-week low in the USD index. The move lower in the greenback comes despite weaker equities today, with US futures indicating a lower open later today.
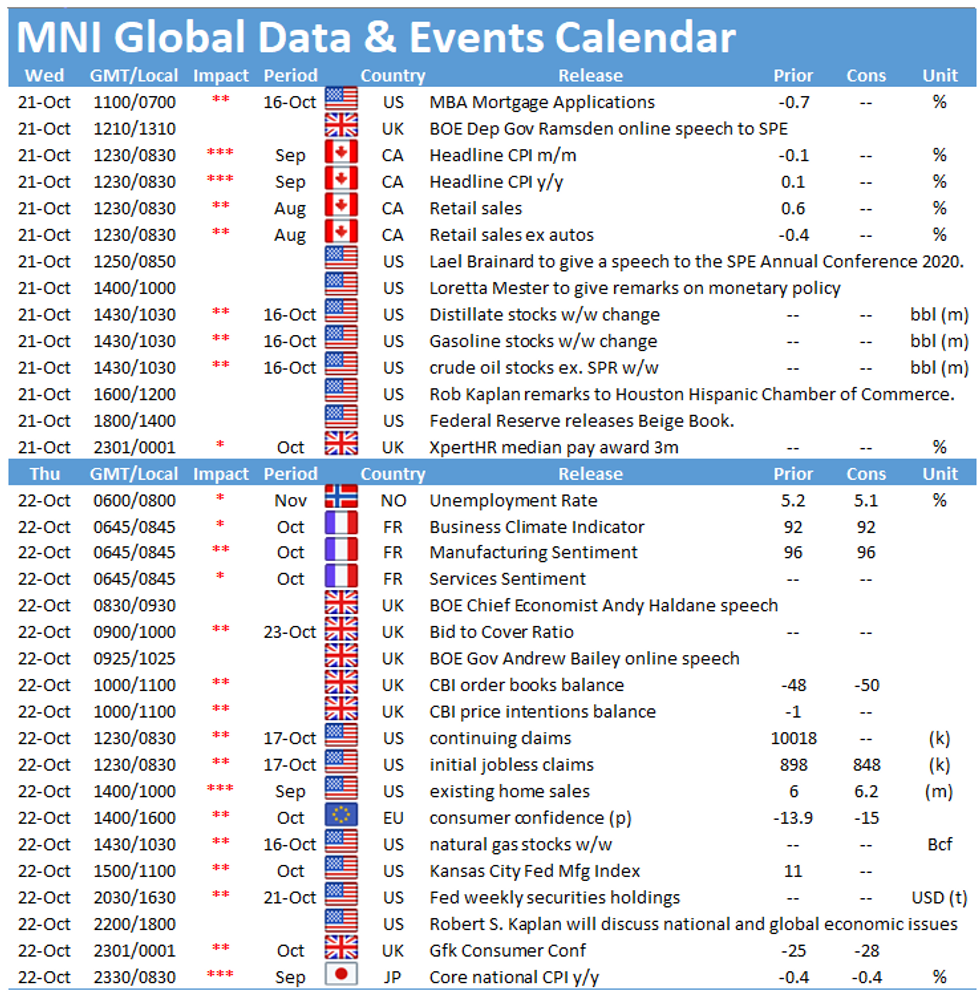
Canadian retail sales and inflation data are the highlights Wednesday. Speaker highlights include BoE's Ramsden, ECB's Lane as well as six further Fed speakers.
EUR/USD TECHS: Heading North
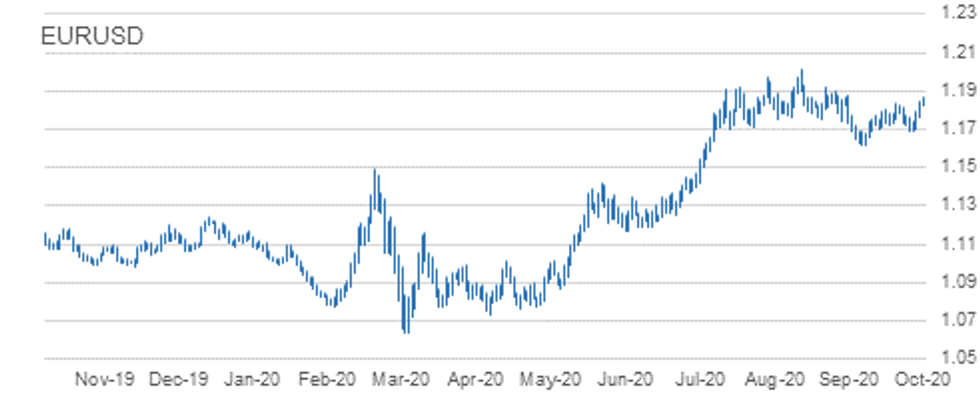
- RES 4: 1.2011 High Sep and key resistance
- RES 3: 1.1917 76.4% retracement of the Sep 1 - 25 sell-off
- RES 2: 1.1885 1.0% 10-dma envelope
- RES 1: 1.1870/72 Intraday high / High Sep 21
- PRICE: 1.1847 @ 10:24 BST Oct 21
- SUP 1: 1.1822 Intraday low
- SUP 2: 1.1760 Low Oct 20
- SUP 3: 1.1734 50-day EMA
- SUP 4: 1.1712 Trendline support drawn off the Sep 28 low
EURUSD is off earlier highs. This week's positive remains intact and yesterday the pair breached the bull trigger at 1.1831, Oct 9 high. The break higher, together with today's earlier gains, suggests scope for an extension towards 1.1917, a Fibonacci retracement level. The major resistance and hurdle for bulls is at 1.2011, Sep 1 high. On the downside, initial firm support lies at 1.1760, yesterday's low.
GBP/USD TECHS: Firmer But Resistance Remains Intact
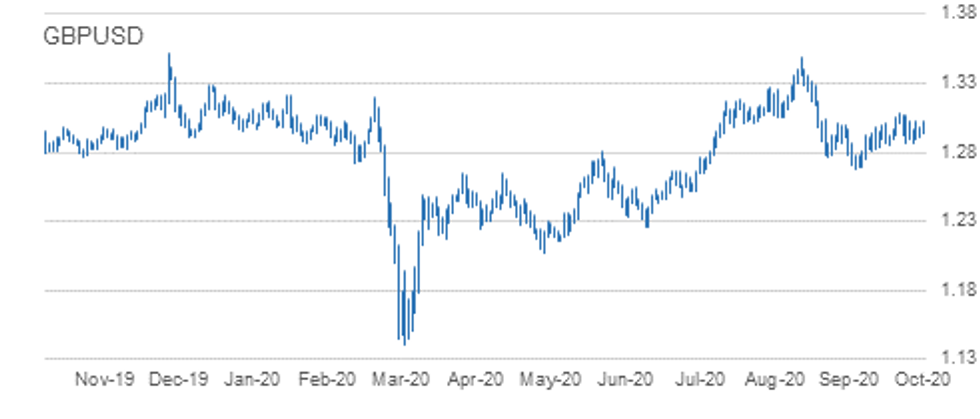
- RES 4: 1.3210 Former trendline support drawn off the Mar 20 low
- RES 3: 1.3174 61.8% retracement of the Sep 1 - 23 sell-off
- RES 2: 1.3083 High Oct 12
- RES 1: 1.3065 Intraday high
- PRICE: 1.3040 @ 10:30 BST Oct 21
- SUP 1: 1.2863 Low Oct 14 and key near-term support
- SUP 2: 1.2846 Low Oct 7
- SUP 3: 1.2806 Low Sep 30
- SUP 4: 1.2745 Low Sep 28
GBPUSD is firmer this but still remains below the Oct 12 high of 1.3083. A break is needed to resume the recent uptrend that would open 1.3000 and 1.3210. The latter is the former trendline support drawn off the Mar 20 low. The trendline was breached on Sep 9 and a return above it is required to strengthen a bullish theme. Firm near-term support lies at 1.2863, Oct 14 low. A breach would signal a resumption of bearish pressure.
Volatile Price Action And The Cross Weakens
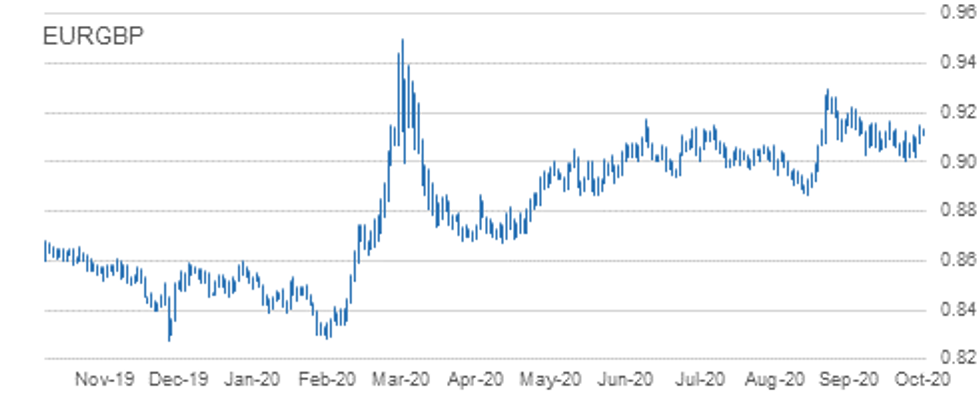
- RES 4: 0.9183 61.8% retracement of the Sep 11 - Oct 14 sell-off
- RES 3: 0.9169 1.0% 10-dma envelope
- RES 2: 0.9162 High Oct 7
- RES 1: 0.9149 Oct 20 high
- PRICE: 0.9078 @ 10:37 BST Oct 21
- SUP 1: 0.9071 50-day EMA
- SUP 2: 0.9007 Low Oct 14
- SUP 3: 0.9000 Round number support
- SUP 4: 0.8967 76.4% retracement of the Sep 3 - 11 rally
EURGBP technical conditions at the start of today's session looked promising for bulls. With volatile price action continuing to dominate and Sterling firming today, the cross has reversed a large portion of its most recent gains. Resistance has been defined at 0.9149, Oct 20 high with key support at 0.9007, Oct 14 low. Bulls will be looking for price to remain above 0.9007. A break though would signal the resumption of bearish pressure.
USD/JPY TECHS: Is Offered
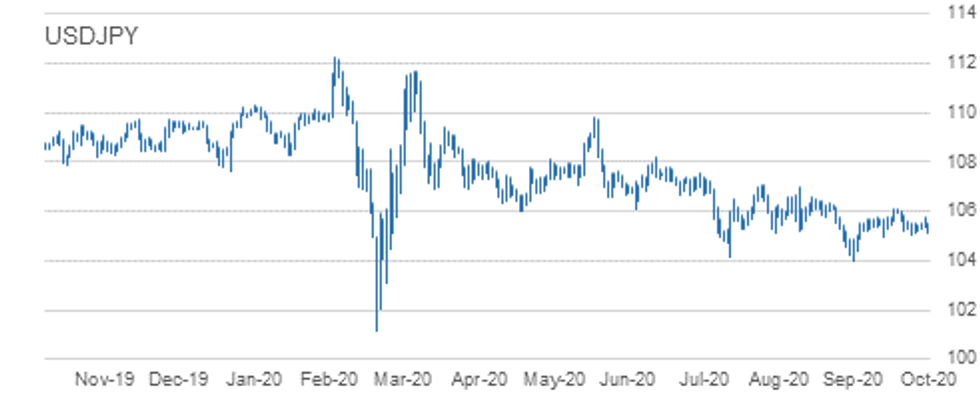
- RES 4: 106.41 Channel resistance drawn off Mar 24 high
- RES 3: 106.11/38 High Oct 7 and the bull trigger / High Sep 8
- RES 2: 105.73/75 50-dma / High Oct 20
- RES 1: 105.04 Low Oct 4 and a recent breakout level
- PRICE: 104.94 @ 10:48 BST Oct 21
- SUP 1: 104.81 61.8% retracement of the Sep 21 - Oct 7 rally
- SUP 2: 104.50 76.4% retracement of the Sep 21 - Oct 7 rally
- SUP 3: 104.00 Low Sep 21 and the bear trigger
- SUP 4: 10309 Low Mar 12
USDJPY is offered. The pair has continued to display a softer tone and today's sell-off reinforces this outlook. Price is testing the key short-term support at 104.94, Oct 2 low where a clear break would signal scope for a deeper sell-off and open 104.50, a retracement level and potentially the key 104.00 handle further out, Sep 21 low. On the upside, firm short-term resistance has been defined at 105.75.
EUR/JPY: Off Recent Highs
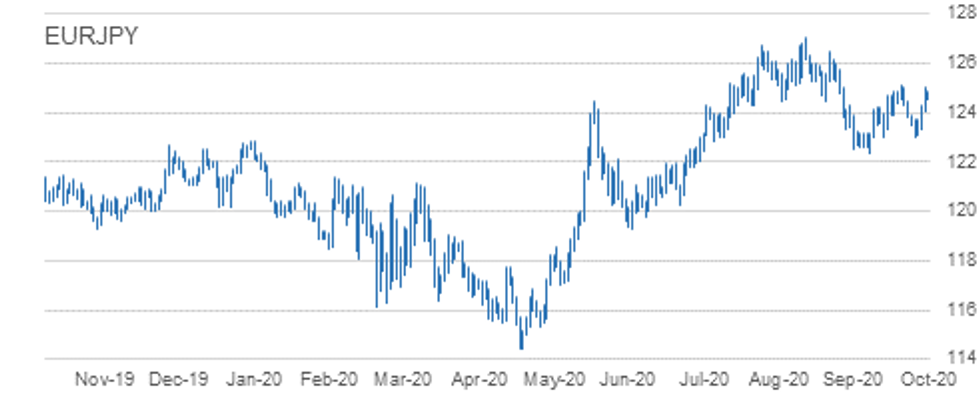
- RES 4: 126.46 High Sep 10
- RES 3: 125.97 76.4% retracement of the Sep 1 - 28 sell-off
- RES 2: 125.77 High Sep 15
- RES 1: 125.09/28 High Oct 9 / 61.8% of the Sep 1 - 28 sell-off
- PRICE: 124.29 @ 10:53 BST Oct 21
- SUP 1: 124.03 Low Oct 20
- SUP 2: 123.03/02 Low Sep 29 and Oct 2 / Low Oct 15
- SUP 3: 122.38/28 Low Sep 28 / 61.8% of the Jun 22 - Sep 1 rally
- SUP 4: 122.25 38.2% retracement of the May - Sep rally
EURJPY is off recent highs. The outlook remains positive though following recent gains that saw the cross pull away from support at 123.03/02, low prints between Sep 29 and Oct 15. The extension through 124.00 opens 125.09, Oct 9 high and the bull trigger. A break of 125.09 would expose 125.28 and 125.97, both retracement levels. On the downside, a 123.03/02 breach is needed to trigger bearish pressure and open 122.38, Sep 28 low.
AUD/USD TECHS: Bearish Theme Intact Despite Bounce
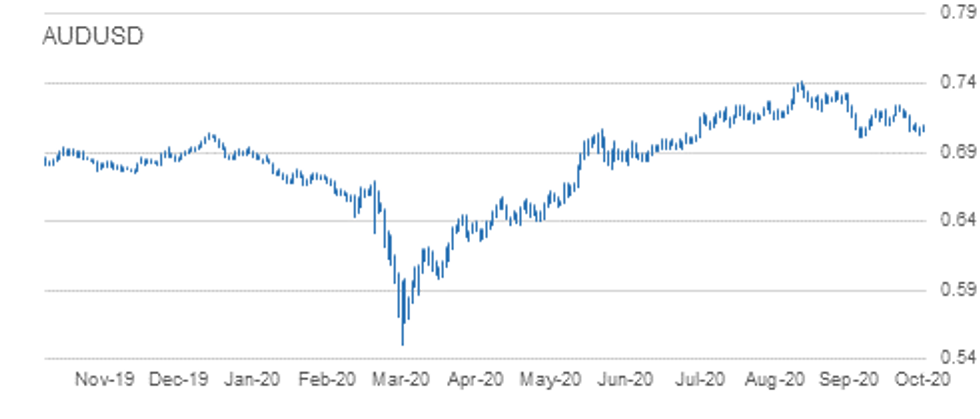
- RES 4: 0.7243 High Oct 10 and the intraday bull trigger
- RES 3: 0.7188 Trendline resistance drawn off the Sep 1 high
- RES 2: 0.7170 High Oct 15
- RES 1: 0.7115 High Oct 19
- PRICE: 0.7083 @ 10:55 BST Oct 21
- SUP 1: 0.7021 Low Oct 20
- SUP 2: 0.7006 Low Sep 25 and the bear trigger
- SUP 3: 0.6965 23.6% retracement of the Mar - Sep rally
- SUP 4: 0.6931 0.764 projection of Sep 1 - 25 sell-off from Oct 9 high
AUDUSD remains vulnerable despite this morning's gains. On Oct 9, the pair cleared resistance at 0.7209, Oct 1 and 6 high resulting in a test of trendline resistance drawn off the Sep 1 high. The line intersects at 0.7188. The failure at the trendline is weighing on the Aussie and the scene is set for a deeper pullback. Attention is on the primary support and bear trigger at 0.7006, Sep 25 low. A trendline resistance break is needed to alter the picture.
USD/CAD TECHS: Trades Through Support
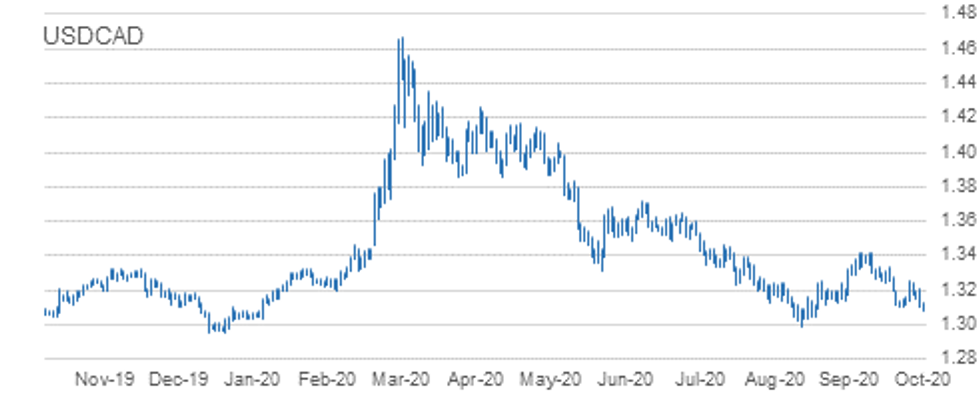
- RES 4: 1.3421 High Sep 30 and primary resistance
- RES 3: 1.3341 High Oct 7 and a reversal trigger
- RES 2: 1.3255/59 50-day EMA / High Oct 15 and the bull trigger
- RES 1: 1. 3210 20-day EMA
- PRICE: 1.3108 @ 10:57 BST Oct 21
- SUP 1: 1.3081 Intraday low
- SUP 2: 1.3047 Low Sep 7
- SUP 3: 1.3038 Low Sep 2
- SUP 4: 1.2994 Low Sep 1 and the major support
USDCAD bearish conditions dominate once again. The pair has today weakened through key support at 1.3099, Oct 13 low. The move lower confirms a resumption of current downtrend that started off the 1.3421 high on Sep 30. Moving average studies are bearish too, reinforcing the current climate. Scope is for a move towards the major support at 1.2994, Sep 1 low. Key resistance has been defined at 1.3259, Oct 15 high.
EUR/USD: MNI KEY LEVELS
- *$1.2130/31 Upper3.0% 10-dma env/Broken Up Trendline from Jan03-2017
- *$1.2084 May01-2018 high
- *$1.2032 May02-2018 high
- *$1.2009/11/12 May03-2018 high/YTD Sep01 high/Upper 2.0% 10-dma env
- *$1.1996 May14-2018 high
- *$1.1938 May15-2018 high
- *$1.1916 Upper Bollinger Band (3%)
- *$1.1894 Upper 1.0% 10-dma envelope
- *$1.1863 Intraday high
- *$1.1857/60 100-mma/Upper Boll Band (2%)
- *$1.1857 ***CURRENT MARKET PRICE 08:42BST WEDNESDAY***
- *$1.1851/48 Jun14-2018 high/Cloud top
- *$1.1822 Intraday low
- *$1.1815 Sep24-2018 high
- *$1.1798/96 50-dma/55-dma
- *$1.1768 200-hma
- *$1.1757/56 Sep27-2018 high/100-hma
- *$1.1743 21-dma
- *$1.1736 Fibo 38.2% 1.3993-1.0341
- *$1.1659 Lower 1.0% 10-dma envelope
- *$1.1651 Sep28-2018 high
GBP/USD: MNI KEY LEVELS
- *$1.3185 May06-2019 high
- *$1.3172 Upper Bollinger Band (3%)
- *$1.3144 Fibo 38.2% 1.4377-1.2382
- *$1.3131/33 May07-2019 high/Apr12-2019 high
- *$1.3109 Fibo 50% 1.1841-1.4377
- *$1.3102 Upper 1.0% 10-dma envelope
- *$1.3089/91 Upper Boll Band (2%)/Cloud top
- *$1.3080 May08-2019 high
- *$1.3041 May13-2019 high
- *$1.3021 Intraday high
- *$1.3019 ***CURRENT MARKET PRICE 08:42BST WEDNESDAY***
- *$1.3017 55-dma
- *$1.3012 50-dma
- *$1.2999 Fibo 61.8% 1.3381-1.2382
- *$1.2991 May10-2019 low
- *$1.2974/70 200-hma/May14-2019 high, Cloud base
- *$1.2952 50-mma
- *$1.2944/41/40 200-wma/100-hma/Intraday low
- *$1.2913 21-dma
- *$1.2904 May14-2019 low
- *$1.2882 Fibo 50% 1.3381-1.2382
EUR/GBP: MNI KEY LEVELS
- *Gbp0.9346/50 Oct15-2009 high/Upper3.0% 10-dma env
- *Gbp0.9307 Aug29-2017 high
- *Gbp0.9260 Upper 2.0% 10-dma envelope
- *Gbp0.9226 Sep04-2017 high
- *Gbp0.9203 Sep08-2017 high
- *Gbp0.9188 Upper Bollinger Band (3%)
- *Gbp0.9169 Upper 1.0% 10-dma envelope
- *Gbp0.9156 Upper Bollinger Band (2%)
- *Gbp0.9134/36 Sep11-2017 high/Intraday high
- *Gbp0.9108 Jan03-2019 high
- *Gbp0.9107 ***CURRENT MARKET PRICE 08:42BST WEDNESDAY***
- *Gbp0.9106 Intraday low
- *Gbp0.9095 21-dma
- *Gbp0.9083/79 100-hma/Cloud top, Cloud base
- *Gbp0.9071/67 200-hma/50-dma
- *Gbp0.9063/62 55-dma/Jan11-2019 high
- *Gbp0.9051/48 Jul17-2019 high/Jul16-2019 high
- *Gbp0.9045 100-dma
- *Gbp0.9039 Jul18-2019 high
- *Gbp0.9026 Lower Bollinger Band (2%)
- *Gbp0.9010 Jul10-2019 high
USD/JPY: MNI KEY LEVELS
- *Y106.20 Upper Bollinger Band (3%)
- *Y106.00 Cloud top
- *Y105.99 Cloud base
- *Y105.97 Upper Bollinger Band (2%)
- *Y105.74 55-dma
- *Y105.70 50-dma
- *Y105.54 Cloud Tenkan Sen
- *Y105.53 Intraday high
- *Y105.51 21-dma
- *Y105.40/43 100-hma/200-hma
- *Y105.12 ***CURRENT MARKET PRICE 08:42BST WEDNESDAY***
- *Y105.11/06 Intraday low/Cloud Kijun Sen, Lower Boll Band (2%)
- *Y104.87 Jan03-2019 low
- *Y104.83 Lower Bollinger Band (3%)
- *Y104.56 Mar26-2018 low
- *Y104.40 Lower 1.0% 10-dma envelope
- *Y103.94 200-mma
- *Y103.34 Lower 2.0% 10-dma envelope
- *Y102.29 Lower 3.0% 10-dma envelope
- *Y102.02 YTD low
- *Y101.20 Nov09-2016 low
EUR/JPY: MNI KEY LEVELS
- *Y125.61 Apr24-2019 high
- *Y125.58 Cloud top
- *Y125.42 Upper 1.0% 10-dma envelope
- *Y125.23 May01-2019 high
- *Y125.21 200-wma, Upper Boll Band (2%)
- *Y125.04 Apr11-2019 low
- *Y124.93 Fibo 38.2% 149.78-109.57
- *Y124.84 Intraday high
- *Y124.80 50-mma
- *Y124.70/74 50-dma/55-dma
- *Y124.64 ***CURRENT MARKET PRICE 08:42BST WEDNESDAY***
- *Y124.53/51 Intraday low/61.8% 126.81-120.78
- *Y124.34 Apr01-2019 low
- *Y124.25 May07-2019 high
- *Y124.22 Fibo 38.2% 133.13-118.71
- *Y124.14 Fibo 38.2% 118.71-127.50
- *Y124.07 200-hma
- *Y124.06 Cloud Tenkan Sen
- *Y123.91 21-dma
- *Y123.90 100-hma
- *Y123.80 Fibo 50% 126.81-120.78
AUD/USD: MNI KEY LEVELS
- *$0.7197/99 55-dma/50-dma
- *$0.7168 Cloud base
- *$0.7153 Apr17-2019 low
- *$0.7140 Apr16-2019 low
- *$0.7131 200-hma
- *$0.7124 21-dma
- *$0.7116 Apr12-2019 low
- *$0.7110 Apr10-2019 low
- *$0.7103 100-dma
- *$0.7088/92 Apr08-2019 low/Intraday high
- *$0.7080 ***CURRENT MARKET PRICE 08:42BST WEDNESDAY***
- *$0.7075/73 100-hma/Mar29-2019 low
- *$0.7069 Apr30-2019 high
- *$0.7060/57 Lower 1.0% 10-dma env/Jul22-2019 high
- *$0.7053 Apr02-2019 low
- *$0.7048/47 Jul04-2019 high, May07-2019 high/Intraday low
- *$0.7044 Jul16-2019 high
- *$0.7008 Lower Bollinger Band (2%)
- *$0.6989/85 Lower 2.0% 10-dma env/Jan03-2019 low
- *$0.6971/67 Jul12-2019 low/Jun11-2019 high
- *$0.6949 Lower Bollinger Band (3%)
USD/CAD: MNI KEY LEVELS
- *C$1.3202 50-dma
- *C$1.3180 100-hma
- *C$1.3174 50-mma
- *C$1.3164 Jul23-2019 high
- *C$1.3158/61/63 200-hma/200-wma/Cloud base, Feb21-2019 low
- *C$1.3150/51 Feb20-2019 low/Jun20-2019 low
- *C$1.3131 Intraday high
- *C$1.3120 Fibo 61.8% 1.2783-1.3665
- *C$1.3113/16 Feb25-2019 low/Jul23-2019 low
- *C$1.3107 Jun26-2019 low
- *C$1.3102 ***CURRENT MARKET PRICE 08:42BST WEDNESDAY***
- *C$1.3081 Intraday low
- *C$1.3066 Fibo 38.2% 1.4690-1.2062
- *C$1.3053 Fibo 38.2% 1.2062-1.3665
- *C$1.3044 Lower Bollinger Band (2%)
- *C$1.3023 Lower 1.0% 10-dma envelope
- *C$1.3015 Oct25-2018 low
- *C$1.2994 YTD low
- *C$1.2970 Oct24-2018 low
- *C$1.2947 Lower Bollinger Band (3%)
- *C$1.2933 Oct17-2018 low
Expiries for Oct21 NY cut 1000ET (Source DTCC)
- EUR/USD: $1.1750-65(E851mln), $1.1800(E947mln), $1.1850-60(E662mln), $1.2000(E506mln)
- USD/JPY: Y105.00-10($1.9bln), Y105.45-50($1.5bln), Y105.90-106.00($2.4bln), Y106.65($1.0bln)
- EUR/GBP: Gbp0.9165-75(E520mln), Gbp0.9350(E578mln-EUR calls)
- AUD/USD: $0.6900(A$847mln), $0.7220(A$598mln), $0.7600(A$1.1bln)
- USD/CAD: C$1.3000($800mln-USD puts)
- USD/CNY: Cny6.7000($500mln)
Larger Option Pipeline
- EUR/USD: Oct22 $1.1600-10(E1.7bln), $1.1644-50(E2.0bln), $1.1665-85(E1.3bln), $1.1795-00(E1.4bln); Oct23 $1.1840-50(E1.3bln), $1.2000(E1.4bln); Oct26 $1.1500(E1.8bln), $1.1650-60(E1.6bln); Oct28 $1.1800-05(E1.4bln), $1.2000-05(E2.1bln); Oct30 $1.1800(E1.1bln), $1.1850-60(E1.2bln), $1.1950(E1.1bln-EUR calls)
- USD/JPY: Oct22 Y104.00-10($1.6bln), Y104.50-55($2.1bln), Y104.95-105.00($1.1bln), Y105.40-50($1.1bln) Y105.80-106.00($2.7bln), Oct23 Y103.00($1.3bln); Oct26 Y103.95-104.00($1.5bln-USD puts), Y105.30-40($1.6bln), Y105.60-75($1.2bln), Y106.95-107.00($1.6bln); Oct27 Y105.00($1.2bln), Y106.00-05($1.2bln); Oct28 Y105.00($1.1bln); Oct29 Y105.55-65($2.1bln), Y106.00($1.2bln); Oct30 Y104.50($1.9bln), Y104.80-85($1.1bln), Y106.00-05($2.2bln)
- EUR/JPY: Oct26 Y122.80(E1.2bln)
- GBP/USD: Oct23 $1.3090-1.3100(Gbp936mln-GBP calls)
- EUR/GBP: Oct26 Gbp0.8900(E880mln), Gbp0.9000(E1.8bln-EUR puts)
- AUD/USD: Nov02 $0.7140-45(A$1.3bln)
- AUD/JPY: Oct22 Y76.44(A$2.1bln); Oct29 Y73.20(A$1.0bln-AUD puts), Y76.35-40(A$2.4bln-AUD calls)
- AUD/NZD: Oct27 N$1.0809-20(A$2.5bln); Oct30 N$1.0750(A$1.2bln)
Why MNI
MNI is the leading provider
of intelligence and analysis on the Global Fixed Income, Foreign Exchange and Energy markets. We use an innovative combination of real-time analysis, deep fundamental research and journalism to provide unique and actionable insights for traders and investors. Our "All signal, no noise" approach drives an intelligence service that is succinct and timely, which is highly regarded by our time constrained client base.Our Head Office is in London with offices in Chicago, Washington and Beijing, as well as an on the ground presence in other major financial centres across the world.