
Why MNI
MNI is the leading provider
of intelligence and analysis on the Global Fixed Income, Foreign Exchange and Energy markets. We use an innovative combination of real-time analysis, deep fundamental research and journalism to provide unique and actionable insights for traders and investors. Our "All signal, no noise" approach drives an intelligence service that is succinct and timely, which is highly regarded by our time constrained client base.Our Head Office is in London with offices in Chicago, Washington and Beijing, as well as an on the ground presence in other major financial centres across the world.
AUD Offered as RBA Sees Room for Further Rate Compression
AUD underperforms, with a speech from RBA Assistant Governor Kent providing some near-term weight. He stated that there is still room for the central bank to "compress" short-term rates, raising the risk of further cuts to the RBA cash rate. AUD/USD slipped on decent volume to fall through 0.7050 support and hit new multi-week lows of $0.7031. Selling pressure in the AUD bled into the NZD, with both currencies at the bottom of the G10 pile this morning.
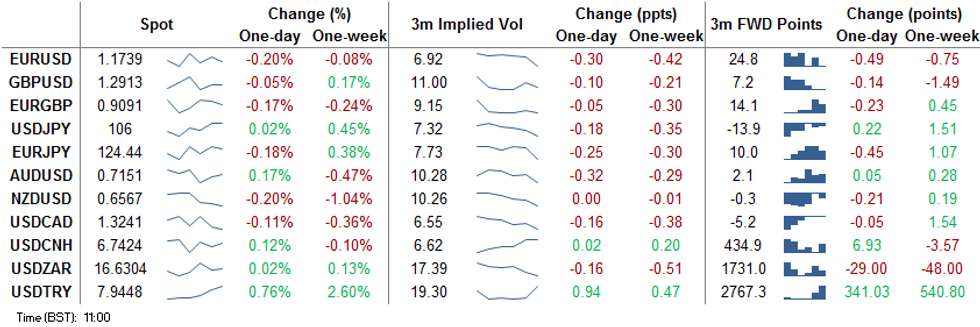
USD's bouncing slightly off the Monday lows, but there's been no meaningful recovery in the greenback. GBP and the EUR are benefiting moderately, but both currencies are yet to top yesterday's highs vs. the USD.
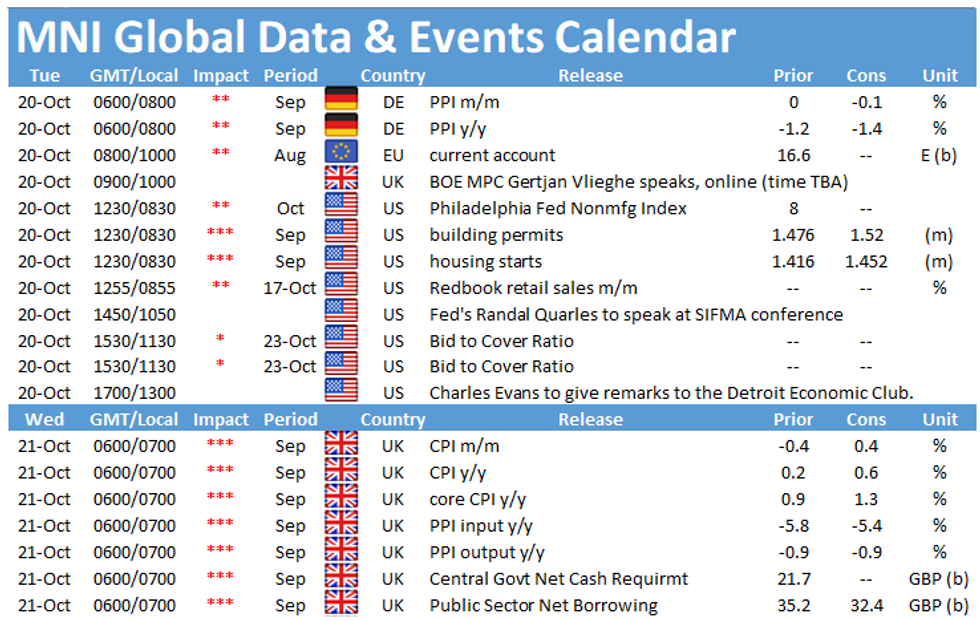
US housing starts are the data highlight Tuesday, with the speaker schedule likely to prove more interesting. ECB's de Cos, Fed's Evans, Quarles, Brainard & Bostic are all due to speak.
EUR/USD TECHS: Rebound Extends
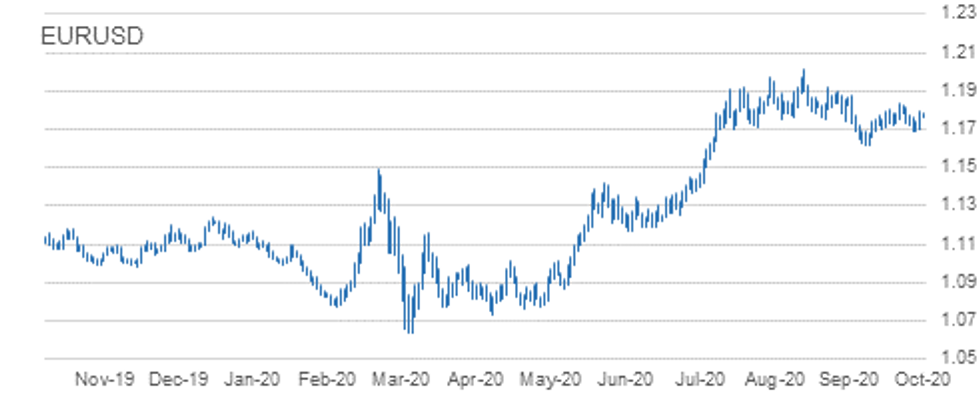
- RES 4: 1.1872 High Sep 21
- RES 3: 1.1859 61.8% retracement of the Sep 1 - 25 sell-off
- RES 2: 1.1831 High Oct 13 / High Oct 9 and the bull trigger
- RES 1: 1.1817 High Oct 13
- PRICE: 1.1797 @ 10:29 BST Oct 20
- SUP 1: 1.1730 50-day EMA
- SUP 2: 1.1685 Low Sep 30
- SUP 3: 1.1612/1581 Low Sep 25 and the bear trigger / Low Jul 24
- SUP 4: 1.1526 0.764 proj of Sep 1 - Sep 25 sell-off from Oct 9 high
EURUSD continues to push higher as the pair recovers off last week's low of 1.1689 on Oct 15. A fairly strong close Monday strengthens the intraday reversal and exposes key near-term resistance at 1.1831, Oct 12 high. This level represents the trigger for a resumption of the bullish reversal that occurred on Sep 25 and would open 1.1859 initially, a retracement level. Sub 1.1684 levels, Sep 30 low, is required to reinstate a bearish threat.
GBP/USD TECHS: Resistance Remains Intact
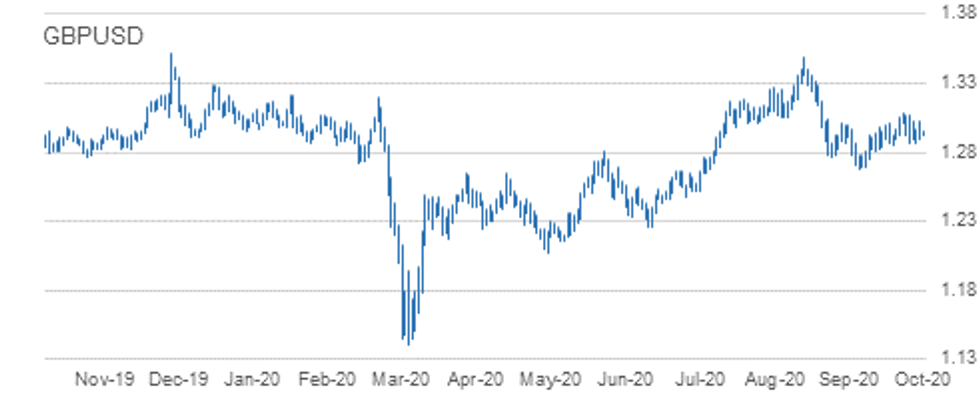
- RES 4: 1.3198 Former trendline support drawn off the Mar 20 low
- RES 3: 1.3174 61.8% retracement of the Sep 1 - 23 sell-off
- RES 2: 1.3083 High Oct 12
- RES 1: 1.3030 High Oct 15
- PRICE: 1.2968 @ 10:31 BST Oct 20
- SUP 1: 1.2863 Low Oct 14
- SUP 2: 1.2846 Low Oct 7 and key near-term support
- SUP 3: 1.2806 Low Sep 30
- SUP 4: 1.2745 Low Sep 28
GBPUSD remains below the Oct 12 high of 1.3083. A break is needed to resume the recent uptrend that would open 1.3000 and 1.3198. The latter is the former trendline support drawn off the Mar 20 low. The trendline was breached on Sep 9. A break of 1.3198 is required to strengthen a bullish theme. Firm near-term support lies at 1.2846. A breach would instead signal scope for a deeper pullback and possibly a bearish resumption.
EUR/GBP TECHS: Bearish Despite Recovery Off Recent Lows
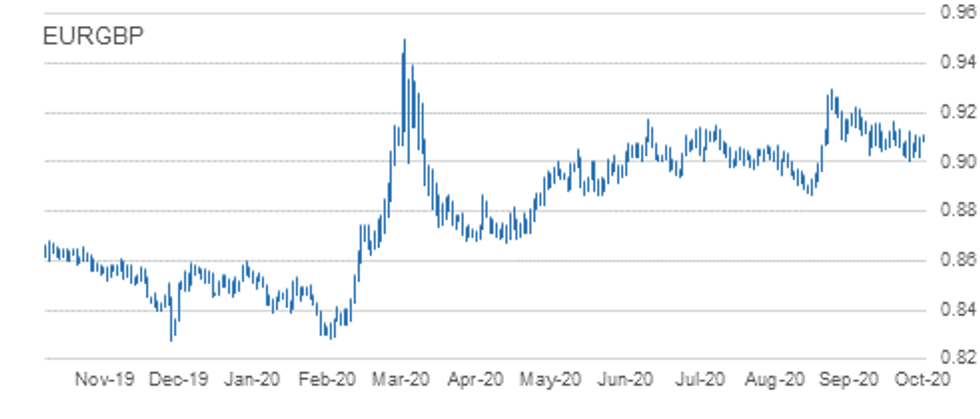
- RES 4: 0.9190 61.8% retracement of the Sep 11 - 28 sell-off
- RES 3: 0.9162 High Oct 7 and the bull trigger
- RES 2: 0.9132 High Oct 10
- RES 1: 0.9122 Oct 14 high
- PRICE: 0.9100 @ 10:32 BST Oct 20
- SUP 1: 0.9007 Low Oct 14
- SUP 2: 0.9000 Round number support
- SUP 3: 0.8967 76.4% retracement of the Sep 3 - 11 rally
- SUP 4: 0.8808 Low May 13
EURGBP maintains a bearish tone despite yesterday's bounce off the day low. The cross is trading above its trendline resistance drawn off the Sep 11 high. However, in order to confirm a clear break of the line, price needs to trade above resistance at 0.9122, Oct 14 high. Until then, a bearish theme dominates and attention is on the bear trigger at 0.9007, Oct 14 low. A break would open 0.9000 and below towards 0.8967, a retracement level.
USD/JPY TECHS: Focus Still On Key Support
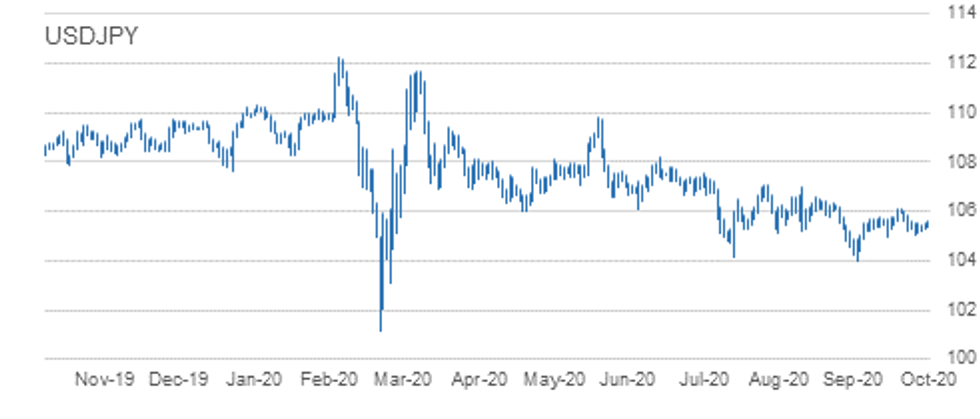
- RES 4: 106.95 High Sep 28
- RES 3: 106.48 Channel resistance drawn off Mar 24 high
- RES 2: 106.11/38 High Oct 7 and the bull trigger / High Sep 8
- RES 1: 105.63 High Oct 13
- PRICE: 105.57 @ 10:48 BST Oct 20
- SUP 1: 105.04 Low Oct 14
- SUP 2: 104.94 Low Oct 2 and key near-term support
- SUP 3: 104.41 Low Sep 22
- SUP 4: 104.00 Low Sep 21 and the bear trigger
USDJPY is trading above recent lows. Despite this, the pair continues to display a softer tone. Intraday momentum studies still point south however to strengthen a bearish theme, price needs to trade below 104.94, Oct 2 low. This would open 104.00, Sep 21 low. The bull trigger is at 106.11, Oct 7 high where a break would instead resume bullish pressure. Initial resistance is at 105.63.
EUR/JPY TECHS: Firmer, With Support Intact

- RES 4: 125.97 76.4% retracement of the Sep 1 - 28 sell-off
- RES 3: 125.77 High Sep 15
- RES 2: 125.09/28 High Oct 9 / 61.8% of the Sep 1 - 28 sell-off
- RES 1: 124.48 High Oct 13
- PRICE: 124.31 @ 06:07 BST Oct 20
- SUP 1: 123.03/02 Low Sep 29 and Oct 2 / Low Oct 15
- SUP 2: 122.38/28 Low Sep 28 / 61.8% of the Jun 22 - Sep 1 rally
- SUP 3: 122.25 38.2% retracement of the May - Sep rally
- SUP 4: 121.82 Low Jul 15 and 16
EURJPY started the week on a firm note with the cross pulling away from support at 123.03/02, low prints between Sep 29 and Oct 15. Stronger gains through the 124.00 handle would signal potential for an extension higher towards 125.09, Oct 9 high and the bull trigger. A break of 125.09 would open 125.28 and 125.97, both retracement levels. On the downside, a 123.03/02 breach is needed to trigger bearish pressure and open 122.38, Sep 28 low.
AUD/USD TECHS: Heavy And Approaching Key Support
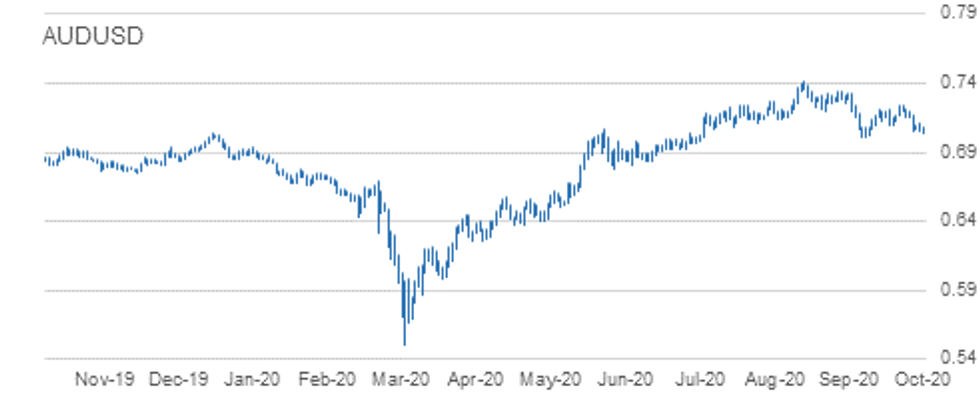
- RES 4: 0.7243 High Oct 10 and the intraday bull trigger
- RES 3: 0.7194 Trendline resistance drawn off the Sep 1 high
- RES 2: 0.7170 High Oct 15
- RES 1: 0.7115 High Oct 19
- PRICE: 0.7044 @ 06:14 BST Oct 20
- SUP 1: 0.7029 Low Sep 28
- SUP 2: 0.7006 Low Sep 25 and the bear trigger
- SUP 3: 0.6965 23.6% retracement of the Mar - Sep rally
- SUP 4: 0.6931 0.764 projection of Sep 1 - 25 sell-off from Oct 9 high
AUDUSD remains vulnerable and has traded lower overnight. On Oct 9, the pair cleared resistance at 0.7209, Oct 1 and 6 high resulting in a test of trendline resistance drawn off the Sep 1 high. The line intersects at 0.7194. The failure at the trendline is weighing on the Aussie and the scene is set for a deeper pullback. Attention is on the primary support and bear trigger at 0.7006, Sep 25 low. A trendline break would alter the picture.
USD/CAD TECHS: Bullish Despite Recent Pullback
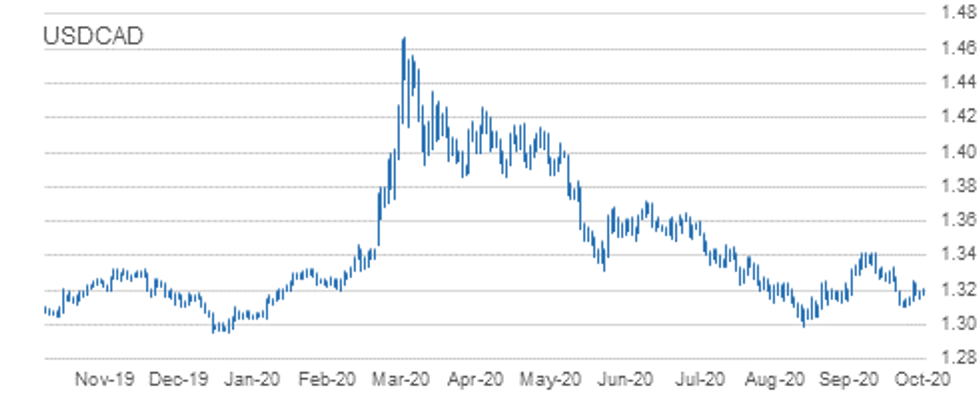
- RES 4: 1.3421 High Sep 30 and primary resistance
- RES 3: 1.3341 High Oct 7 and a reversal trigger
- RES 2: 1.3260/68 50-day EMA / High Oct 7
- RES 1: 1.3259 High Oct 15
- PRICE: 1.3192 @ 06:20 BST Oct 20
- SUP 1: 1.3143 Low Oct 15
- SUP 2: 1.3099 Low Oct 13 and the bear trigger
- SUP 3: 1.3095 76.4% retracement of the Sep 1 - 30 rally
- SUP 4: 1.3038 Low Sep 2
The USDCAD short-term outlook remains bullish with recent gains signalling scope for a stronger corrective bounce. The pair breached the 20-day EMA last week paving the way for move towards the 50-day EMA that intersects at 1.3260. A clear breach of the 50 EMA would strengthen a bullish case. On the downside, initial support lies at 1.3143, Oct 15 low. A move through this level would undermine the recent recovery.
EUR/USD: MNI KEY LEVELS
*$1.2032 May02-2018 high
*$1.2009/11 May03-2018 high/YTD Sep01 high
*$1.1996/97 May14-2018 high/Upper 2.0% 10-dma env
*$1.1938 May15-2018 high
*$1.1880/85 Upper 1.0% 10-dma env/Upper Boll Band (3%)
*$1.1851/56 Cloud top, Jun14-2018 high/100-mma
*$1.1835 Upper Bollinger Band (2%)
*$1.1815 Sep24-2018 high
*$1.1795/96 50-dma/55-dma
*$1.1781 Intraday high
*$1.1771 ***CURRENT MARKET PRICE 08:57BST TUESDAY***
*$1.1760/57 200-hma, Intraday low/Sep27-2018 high
*$1.1736/33 38.2% 1.3993-1.0341, 100-hma/21-dma
*$1.1651 Sep28-2018 high
*$1.1644 Lower 1.0% 10-dma envelope
*$1.1634 Lower Bollinger Band (2%)
*$1.1623/21 Down Trendline from Jul18-2008/Oct16-2018 high
*$1.1616/15/13 100-dma/Cloud base/161.8% swing $1.1497-1.1309
*$1.1584 Lower Bollinger Band (3%)
*$1.1570 Jan10-2019 high
*$1.1540 Jan11-2019 high
GBP/USD: MNI KEY LEVELS
*$1.3089/92 Upper Boll Band (2%)/Upper 1.0% 10-dma env
*$1.3080 May08-2019 high
*$1.3041 May13-2019 high
*$1.3019 55-dma*$1.3012 50-dma
*$1.2999 Fibo 61.8% 1.3381-1.2382
*$1.2991 May10-2019 low
*$1.2970/71 May14-2019 high/200-hma
*$1.2958/60 Intraday high/Cloud base
*$1.2950/52 50-mma/100-hma
*$1.2944 ***CURRENT MARKET PRICE 08:57BST TUESDAY***
*$1.2943 200-wma
*$1.2920 Intraday low
*$1.2904/99 May14-2019 low/21-dma
*$1.2882 Fibo 50% 1.3381-1.2382
*$1.2852 May16-2019 high
*$1.2845 100-dma
*$1.2833/32/31 Feb12-2019 low/Lower 1.0% 10-dma env/Jan21-2019 low
*$1.2825 Jan16-2019 low
*$1.2813/10 May21-2019 high/61.8% 1.1841-1.4377
*$1.2784 Jun25-2019 high
EUR/GBP: MNI KEY LEVELS
*Gbp0.9346/47 Oct15-2009 high/Upper3.0% 10-dma env
*Gbp0.9307 Aug29-2017 high
*Gbp0.9256 Upper 2.0% 10-dma envelope
*Gbp0.9226 Sep04-2017 high
*Gbp0.9203 Sep08-2017 high
*Gbp0.9197 Upper Bollinger Band (3%)
*Gbp0.9162/65 Upper Boll Band (2%)/Upper 1.0% 10-dma env
*Gbp0.9134 Sep11-2017 high
*Gbp0.9106/08 Intraday high/Jan03-2019 high
*Gbp0.9097 21-dma
*Gbp0.9093 ***CURRENT MARKET PRICE 08:57BST TUESDAY***
*Gbp0.9085 Intraday low
*Gbp0.9079 Cloud top, Cloud base
*Gbp0.9067/65/62 200-hma/50-dma/Jan11-2019 high, 55-dma
*Gbp0.9061 100-hma
*Gbp0.9051/48 Jul17-2019 high/Jul16-2019 high
*Gbp0.9043/39 100-dma/Jul18-2019 high
*Gbp0.9022 Lower Bollinger Band (2%)
*Gbp0.9010 Jul10-2019 high
*Gbp0.9005/00 Jul23-2019 high/Jul22-2019 high
*Gbp0.8987/84 Lower Boll Band (3%)/Lower 1.0% 10-dma env
USD/JPY: MNI KEY LEVELS
*Y106.52 Fibo 61.8% 99.02-118.66
*Y106.34 100-dma
*Y106.16 Upper Bollinger Band (3%)
*Y106.06 Cloud top
*Y105.99 Cloud base
*Y105.95 Upper Bollinger Band (2%)
*Y105.75 55-dma
*Y105.74 50-dma
*Y105.62 Intraday high
*Y105.57 Cloud Tenkan Sen
*Y105.55 ***CURRENT MARKET PRICE 08:57BST TUESDAY***
*Y105.50/49 21-dma/200-hma
*Y105.35 100-hma, Intraday low
*Y105.11 Lower Bollinger Band (2%)
*Y105.06 Cloud Kijun Sen
*Y104.90 Lower Bollinger Band (3%)
*Y104.87 Jan03-2019 low
*Y104.56 Mar26-2018 low
*Y104.49 Lower 1.0% 10-dma envelope
*Y103.94 200-mma
*Y103.43 Lower 2.0% 10-dma envelope
EUR/JPY: MNI KEY LEVELS
*Y125.21 200-wma
*Y125.10 Upper Bollinger Band (2%)
*Y125.04 Apr11-2019 low
*Y124.93 Fibo 38.2% 149.78-109.57
*Y124.80 50-mma
*Y124.74 55-dma
*Y124.72 50-dma
*Y124.51 Fibo 61.8% 126.81-120.78
*Y124.34 Intraday high, Apr01-2019 low
*Y124.25 May07-2019 high
*Y124.24 ***CURRENT MARKET PRICE 08:57BST TUESDAY***
*Y124.22 Fibo 38.2% 133.13-118.71
*Y124.14 Fibo 38.2% 118.71-127.50
*Y124.08 Cloud Kijun Sen
*Y124.06 Cloud Tenkan Sen
*Y124.05 200-hma
*Y124.03 Intraday low
*Y123.80 50% 126.81-120.78, 21-dma
*Y123.74 May21-2019 high
*Y123.72 Fibo 61.8% 115.21-137.50
*Y123.68 Cloud base
AUD/USD: MNI KEY LEVELS
*$0.7140/44 Apr16-2019 low/200-hma
*$0.7128 21-dma
*$0.7116 Apr12-2019 low
*$0.7110 Apr10-2019 low
*$0.7098/02 100-hma/100-dma
*$0.7088 Apr08-2019 low
*$0.7073/75 Mar29-2019 low/Intraday high
*$0.7066/69 Lower 1.0% 10-dma env/Apr30-2019 high
*$0.7053/57 Apr02-2019 low/Jul22-2019 high
*$0.7044/48 Jul16-2019 high/May07-2019 high, Jul04-2019 high
*$0.7044 ***CURRENT MARKET PRICE 08:57BST TUESDAY***
*$0.7031 Intraday low
*$0.7006 Lower Bollinger Band (2%)
*$0.6994 Lower 2.0% 10-dma envelope
*$0.6985 Jan03-2019 low
*$0.6971/67 Jul12-2019 low/Jun11-2019 high
*$0.6947 Lower Bollinger Band (3%)
*$0.6923 Lower 3.0% 10-dma envelope
*$0.6909 Jun19-2019 high
*$0.6897 100-wma
*$0.6879 Jun20-2019 low
USD/CAD: MNI KEY LEVELS
*C$1.3345 Jun12-2019 high
*C$1.3328 Fibo 38.2% 1.2783-1.3665
*C$1.3320 Cloud top
*C$1.3308/09 Upper 1.0% 10-dma env/38.2% 1.3565-1.3151
*C$1.3300 Jun13-2019 low
*C$1.3286 Jun20-2019 high
*C$1.3260 21-dma
*C$1.3224/26 50% 1.2783-1.3665/Jun10-2019 low
*C$1.3217 55-dma
*C$1.3204/07 Intraday high/50-dma
*C$1.3189 ***CURRENT MARKET PRICE 08:57BST TUESDAY***
*C$1.3185 100-hma
*C$1.3179/76 Intraday low/50-mma
*C$1.3172/68 Cloud base/200-hma
*C$1.3164/63/61 Jul23-2019 high/Feb21-2019 low/200-wma
*C$1.3151/50 Jun20-2019 low/Feb20-2019 low
*C$1.3120/16 61.8% 1.2783-1.3665/Jul23-2019 low
*C$1.3113 Feb25-2019 low
*C$1.3107 Jun26-2019 low
*C$1.3069/66 Lower Boll Band (2%)/38.2% 1.4690-1.2062
*C$1.3053 Fibo 38.2% 1.2062-1.3665
OPTIONS: Expiries for Oct20 NY cut 1000ET (Source DTCC)
EUR/USD: $1.1650(E664mln), $1.1745(E1.4bln), $1.1790-00(E1.4bln), $1.1865-75(E689mln)
USD/JPY: Y104.00-05($584mln), Y105.00($760mln), Y105.50-60($1.1bln), Y105.90-106.00($934mln), Y106.35-50($2.5bln-USD calls)
AUD/USD: $0.7050(A$643mln), $0.7220-30(A$579mln)
USD/CAD: C$1.3200($515mln)
USD/CNY: Cny6.7500($500mln-USD puts)
-----------------------------
Larger Option Pipeline
EUR/USD: Oct22 $1.1600-10(E1.7bln), $1.1645-50(E1.8bln), $1.1795-00(E1.2bln); Oct23 $1.1840-50(E1.2bln), $1.2000(E1.3bln); Oct26 $1.1500(E1.8bln), $1.1650-60(E1.6bln); Oct28 $1.1800-05(E1.4bln), $1.2000-05(E2.1bln); Oct30 $1.1800(E1.1bln)
USD/JPY: Oct21 Y105.00-10($1.9bln), Y105.50($1.2bln), Y105.90-106.00($2.3bln), Y106.65($1.0bln); Oct22 Y104.00-10($1.6bln), Y104.50-55($2.1bln), Y104.95-105.00($1.1bln), Y105.95-106.00($1.2bln); Oct26 Y103.95-104.00($1.5bln-USD puts), Y106.95-107.00($1.6bln); Oct27 Y105.00($1.2bln); Oct28 Y105.00($1.1bln); Oct29 Y106.00($1.2bln); Oct30 Y104.50($1.9bln), Y104.80-85($1.0bln), Y106.00-05($1.9bln)
EUR/JPY: Oct26 Y122.80(E1.2bln)
EUR/GBP: Oct26 Gbp0.8900(E880mln), Gbp0.9000(E1.7bln-EUR puts)
AUD/USD: Oct21 $0.7600(A$1.1bln); Nov02 $0.7140-45(A$1.3bln)
AUD/JPY: Oct22 Y76.44(A$2.1bln); Oct29 Y73.20(A$1.0bln-AUD puts), Y76.35-40(A$2.4bln-AUD calls)
AUD/NZD: Oct27 N$1.0809-20(A$2.5bln); Oct30 N$1.0750(A$1.2bln)
Why MNI
MNI is the leading provider
of intelligence and analysis on the Global Fixed Income, Foreign Exchange and Energy markets. We use an innovative combination of real-time analysis, deep fundamental research and journalism to provide unique and actionable insights for traders and investors. Our "All signal, no noise" approach drives an intelligence service that is succinct and timely, which is highly regarded by our time constrained client base.Our Head Office is in London with offices in Chicago, Washington and Beijing, as well as an on the ground presence in other major financial centres across the world.