-
Policy
Policy
Exclusive interviews with leading policymakers that convey the true policy message that impacts markets.
LATEST FROM POLICY: -
EM Policy
EM Policy
Exclusive interviews with leading policymakers that convey the true policy message that impacts markets.
LATEST FROM EM POLICY: -
G10 Markets
G10 Markets
Real-time insight on key fixed income and fx markets.
Launch MNI PodcastsFixed IncomeFI Markets AnalysisCentral Bank PreviewsFI PiFixed Income Technical AnalysisUS$ Credit Supply PipelineGilt Week AheadGlobal IssuanceEurozoneUKUSDeep DiveGlobal Issuance CalendarsEZ/UK Bond Auction CalendarEZ/UK T-bill Auction CalendarUS Treasury Auction CalendarPolitical RiskMNI Political Risk AnalysisMNI Political Risk - US Daily BriefMNI Political Risk - The week AheadElection Previews -
Emerging Markets
Emerging Markets
Real-time insight of emerging markets in CEMEA, Asia and LatAm region
-
Commodities
-
Credit
Credit
Real time insight of credit markets
-
Data
-
Global Macro
Global Macro
Actionable insight on monetary policy, balance sheet and inflation with focus on global issuance. Analysis on key political risk impacting the global markets.
Global MacroDM Central Bank PreviewsDM Central Bank ReviewsEM Central Bank PreviewsEM Central Bank ReviewsBalance Sheet AnalysisData AnalysisEurozone DataUK DataUS DataAPAC DataInflation InsightEmployment InsightGlobal IssuanceEurozoneUKUSDeep DiveGlobal Issuance Calendars EZ/UK Bond Auction Calendar EZ/UK T-bill Auction Calendar US Treasury Auction Calendar Global Macro Weekly -
About Us
To read the full story
Sign up now for free trial access to this content.
Please enter your details below.
Why MNI
MNI is the leading provider
of intelligence and analysis on the Global Fixed Income, Foreign Exchange and Energy markets. We use an innovative combination of real-time analysis, deep fundamental research and journalism to provide unique and actionable insights for traders and investors. Our "All signal, no noise" approach drives an intelligence service that is succinct and timely, which is highly regarded by our time constrained client base.Our Head Office is in London with offices in Chicago, Washington and Beijing, as well as an on the ground presence in other major financial centres across the world.
Real-time Actionable Insight
Get the latest on Central Bank Policy and FX & FI Markets to help inform both your strategic and tactical decision-making.
Free AccessMNI ASIA OPEN: Focus on November Jobs Ahead Fed Blackout
MNI ASIA MARKETS ANALYSIS: Consolidation Ahead Nov Jobs Report
MNI US Morning FI Analysis: Election Day
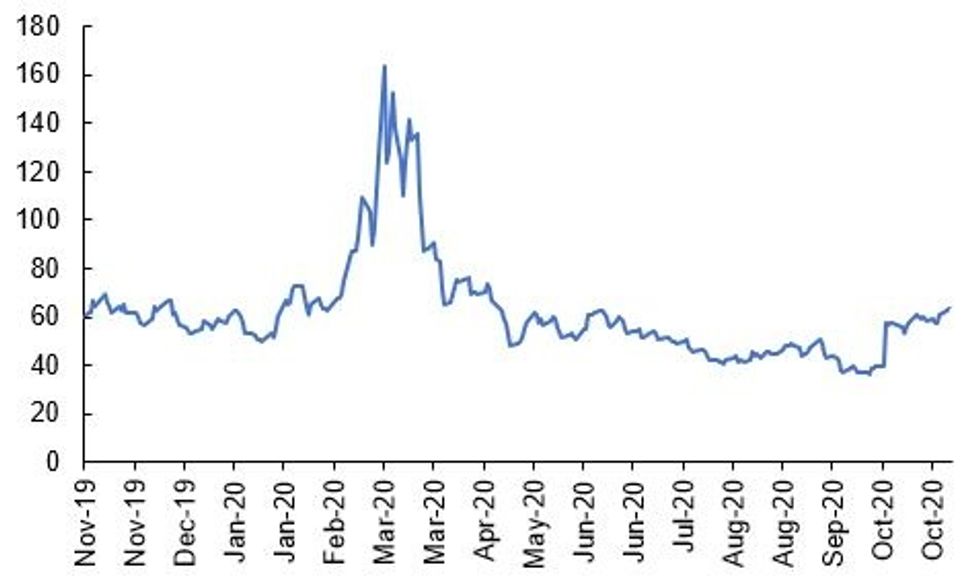
Fig 1. MOVE Index

Source: Bloomberg
US TSYS SUMMARY: Calm Before The Storm?
Treasuries have weakened in orderly fashion in European trading, with middling volumes (TYZ0 ~240k) to begin election day. Curve bear steepening as equities rally.
- The 2-Yr yield is up 0.4bps at 0.1585%, 5-Yr is up 1.1bps at 0.3861%, 10-Yr is up 2.5bps at 0.8688%, and 30-Yr is up 3bps at 1.6467%. Dec 10-Yr futures (TY) down 4.5/32 at 138-5 (L: 138-02.5 / H: 138-11).
- Dollar weaker (DXY -0.6%), equities up (S&P eminis +1.2%) in a risk-on move globally.
- Unclear whether that price action is consistent with a 'blue wave' scenario in the election; UK bookmarkers' odds actually showed Biden dipping to lowest probability in weeks (~60% vs ~40% for Trump) this morning, though perhaps that's profit taking as it's back to about 62%-38%.
- We put out our Fed/Election preview yesterday, as well as an election viewers' guide with timings for poll closings and what to watch on the night - let us know if you want a copy.
- Don't forget, data today too: 1000ET sees Sept Factory orders/final durable goods.
- In supply, $94B split across two auctions and three bills ($60B of 42-/119-day at 1130ET, $34B of 52-Wk at 1300ET).
- NY Fed buys ~$6.025B of 4.5-7Y Tsys before taking a couple of days off for the FOMC 2-day meeting.
BOND SUMMARY: US Election Takes Centre Stage
The US presidential election takes centre stage with markets pivoting to a risk-on position which likely reflects expectation of a Biden victory.
- Gilts have traded lower with the curve bear steepening. The 2s30s spread is 1bp wider. The Dec-20 gilt future trades at 135.80, towards the bottom end of the day's range (L: 135.65 / H: 136.09).
- Bunds trade in line with gilts. Yields at the longer end are 3bp higher on the day.
- The OAT curve has similarly bear steepened. Last yields: 2-year -0.7250%, 5-year -0.695%, 10-year -0.3290%, 30-year 0.3675%.
- BTPs trade close to unch on the day.
- Supply this morning came from UK (Gilts, GBP4.75bn), Germany (iBund, EUR0.38bn), Austria (RAGB, EUR0.69bn), Belgium (TCs, EUR1.21bn), ESM (Bills, EUR2bn).
- There were no significant data releases this morning.
DEBT SUPPLY
GILT AUCTION RESULTS: DMO sells GBP2.00bln nominal of 1.25% Oct-41 gilt
- Avg yld 0.771% (0.750%), bid-to-cover 2.42x (2.12x), tail 0.1bp (0.3bp), price 109.256 (109.731).
- Pre-auction mid-price: 109.162
- An additional GBP500mln will be available through the PAOF to successful bidders until 14:30GMT.
GILT AUCTION RESULTS: DMO sells GBP2.75bln nominal of 0.125% Jan-28 Gilt
- Avg yld 0.116% (0.086%), bid-to-cover 2.67x (3.22x), tail 0.2bps (0.1ps), price 100.063 (100.284).
- Pre-auction mid-price 100.039
- An additional GBP687.5mln will be available through the PAOF to successful bidders until 13:00GMT.
GERMAN AUCTION RESULTS: Germany allots E0.38bn of the 0.50% Apr-30 iBund
- Average yield -1.35% (-1.25%), Buba cover 1.7x (1.51x), bid-to-cover 1.29x (0.86x)
AUSTRIA AUCTION RESULTS: Austria Sells E0.69bn of the 0% Oct-40 RAGB
Average yield -0.059% (-0.09%), bid-to-cover 1.95x
BELGIUM AUCTION RESULTS: Belgium Sells E1.21bn of TCs Vs E1.0-1.4bn Target
- E0.647bn of the Mar 11, 2021 TC: Average yield -0.676%, bid-to-cover 2.6x
- E0.560bn of the May 13, 2021 TC: Average yield -0.672%, bid-to-cover 2.6x
ESM AUCTION RESULTS: The ESM Sells E2bn of 3-Month Bills
- Average yield -0.643%, bid-to-cover 5.2x
OPTIONS
EGB Options: Bund downside
RXZ0 174.50/173.50ps 1x1.5, bought for 18.5 in 1.5k (ref 176.11)
SHORT STERLING OPTIONS: Profit taking
0LX0 99.875/100.00/100.125c fly sold at 7 in 3k.
TECHS
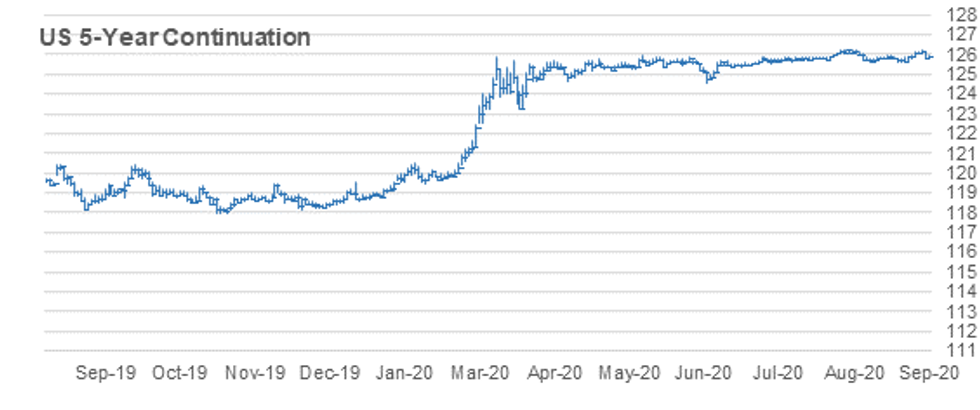
US 5YR FUTURE TECHS: (Z0) Approaching The Bear Trigger

- RES 4: 125-31 High Oct 15 and a key near-term resistance
- RES 3: 125-29 61.8% retracement of the Sep 30 - Oct 23 sell-off
- RES 2: 125-272 High Oct 28 and the bull trigger
- RES 1: 125-242 Trendline resistance drawn off the Sep 30 high
- PRICE: 125-17 @ 11:18 GMT Nov 3
- SUP 1: 125-16+ Low Oct 22 and 23 and the bear trigger
- SUP 2: 125-156 1.00 proj of Aug 4 - 28 sell-off from Sep 3 high
- SUP 3: 125-112 Low Jun 10 (cont)
- SUP 4: 125-10+ 1.236 proj of Aug 4 - 28 sell-off from Sep 3 high
5yr futures weakened following the recent failure at trendline resistance drawn off the Sep 30 high and remain soft. The trendline intersects at 125-242. While the trendline holds, support at 125-16+, Oct 22 and 23 low remains exposed. Clearance of this level would confirm a resumption of bearish activity and open 125-156 initially, a Fibonacci projection. On the upside, clearance of the trendline is required to reverse the trend.
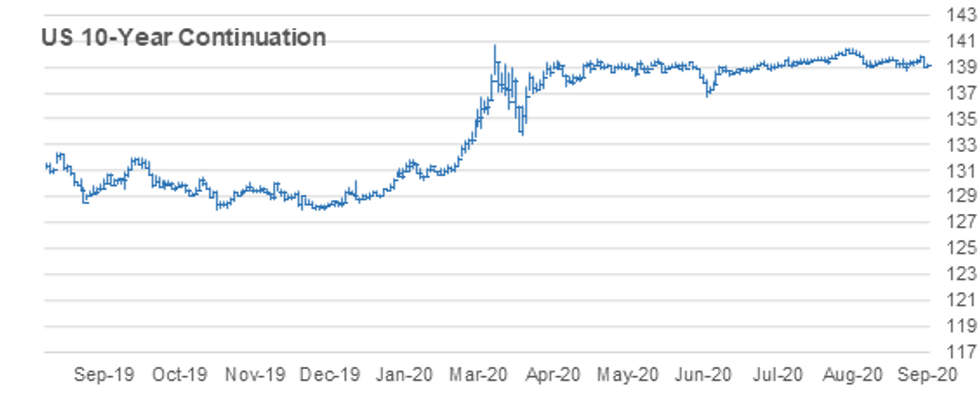
US 10YR FUTURE TECHS: (Z0) Resumes Downtrend

- RES 4: 139-07+ High Oct 16
- RES 3: 139-03 High Oct 28 and the bull trigger
- RES 2: 138-22 20-day EMA
- RES 1: 138-19+ High Oct 30
- PRICE: 138-04 @ 11:29 GMT Nov 3
- SUP 1: 138-02+ Intraday low
- SUP 2: 137-30+ Bear channel base drawn off the Aug 4 high
- SUP 3: 137-23 1.236 proj of Aug 4 - 28 decline from Sep 3 high
- SUP 4: 137-15 1.382 proj of Aug 4 - 28 decline from Sep 3 high
Treasuries maintain a bearish stance following last week's sell-off that followed a failure on Oct 28 at trendline resistance drawn off the Oct 2 high. The trendline intersects at 138-30. Futures have continued lower today and also breached former support at 138-03+, Oct 30 low. This confirms a resumption of the downtrend and opens 137-30+, the base of a bear channel drawn off the Aug 4 high. Initial resistance is seen at 138-19+, Oct 30 high.
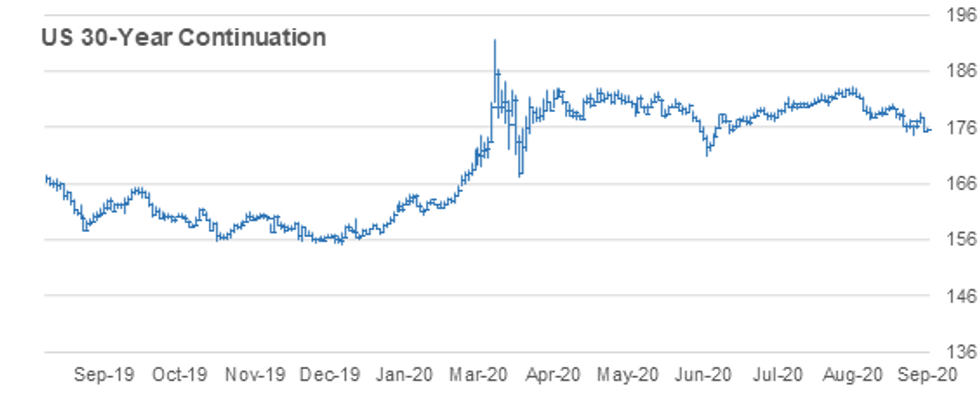
US 30YR FUTURE TECHS: (Z0) Eyeing Key Support

- RES 4: 177-00 High Oct 2
- RES 3: 176-10 High Oct 15 and a key resistance
- RES 2: 175-00 50-day EMA
- RES 1: 174-18/29 Trendline drawn off the Aug 6 high / High Oct 28
- PRICE: 172-05 @ 11:38 GMT Nov 3
- SUP 1: 171-29 Intraday low
- SUP 2: 171-22 Low Oct 23 and the bear trigger
- SUP 3: 171-00 Round number support
- SUP 4: 170-16 1.00 proj of Aug 6 - 28 sell-off from Sep 3 high
30yr futures are softer following last week's second half sell-off. The recent pullback follows an inability to clear trendline resistance drawn off the Aug 6 high. The trendline intersects at 174-18. A break, reinforced by a move above 174-29, Oct 28 high would confirm a reversal of the recent downleg and open 176-10, Oct 15 high. While price remains below the trendline, support at 171-22, Oct 23 stays exposed. A break would resume the downtrend.
To read the full story
Sign up now for free trial access to this content.
Please enter your details below.
Why MNI
MNI is the leading provider
of intelligence and analysis on the Global Fixed Income, Foreign Exchange and Energy markets. We use an innovative combination of real-time analysis, deep fundamental research and journalism to provide unique and actionable insights for traders and investors. Our "All signal, no noise" approach drives an intelligence service that is succinct and timely, which is highly regarded by our time constrained client base.Our Head Office is in London with offices in Chicago, Washington and Beijing, as well as an on the ground presence in other major financial centres across the world.
