
Why MNI
MNI is the leading provider
of intelligence and analysis on the Global Fixed Income, Foreign Exchange and Energy markets. We use an innovative combination of real-time analysis, deep fundamental research and journalism to provide unique and actionable insights for traders and investors. Our "All signal, no noise" approach drives an intelligence service that is succinct and timely, which is highly regarded by our time constrained client base.Our Head Office is in London with offices in Chicago, Washington and Beijing, as well as an on the ground presence in other major financial centres across the world.
- MNI ISRAEL: Netanyahu: Israel Will Not Agree To A Ceasefire
- BOJ TO CONSIDER LETTING 10-YEAR YIELDS EXCEED 1%, NIKKEI SAYS
- GM Reaches Tentative Agreement With UAW, Ending Six-Week Strike
cropfilter_vintageloyaltyshopping_cartdelete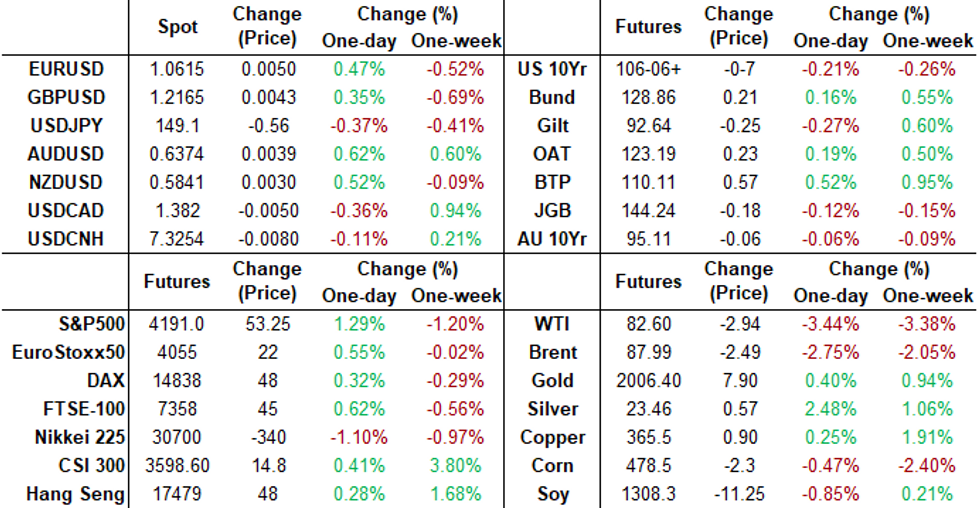
US TSYS Inside Lower, Narrow Range, Tsy Borrow Ests Lower Than Expected
- Treasury futures holding modestly, see-sawing near the middle of the session range by the bell. Several exogenous factors at play.
- Tsy futures had been climbing off morning lows after lower than expected German CPI spurred shorts to unwind. That was until midmorning Nikkei headlines posited the Bank of Japan will consider tweaking yield curve control framework at tomorrow's policy meeting.
- Stocks regained positive momentum by midmorning as some desks suggest (unconfirmed) month-end asset allocation from FI into stocks may be at play.
- The pendulum swung higher on the bell after the US Tsy announced borrowing estimates for Q4 and Q1'24.
- Treasury expects to borrow USD776 billion in the fourth quarter and an an additional USD816 billion in the first quarter of next year. Both estimates would represent records for each respective quarter. The fourth quarter estimate is USD76 billion less than previously announced in July, due to projections of higher receipts. The U.S. agency is assuming an end-of-December and end-of-March cash balance of USD750 billion.
- Tuesday focus turns to ECI, Chicago PMI and Consumer Confidence data ahead ADP and TBAC refunding Wednesday morning followed by the FOMC policy announcement Wednesday afternoon.
SHORT TERM RATES
SOFR Benchmark Settlements:
- 1M -0.00404 to 5.32008 (-0.00274 total last wk)
- 3M -0.00609 to 5.37712 (-0.00677 total last wk)
- 6M -0.00614 to 5.43449 (-0.01628 total last wk)
- 12M -0.01373 to 5.35922 (-0.03054 total last wk)
- Daily Effective Fed Funds Rate: 5.33% volume: $94B
- Daily Overnight Bank Funding Rate: 5.32% volume: $238B
- Secured Overnight Financing Rate (SOFR): 5.31%, $1.496T
- Broad General Collateral Rate (BGCR): 5.30%, $564B
- Tri-Party General Collateral Rate (TGCR): 5.30%, $556B
- (rate, volume levels reflect prior session)
FED REVERSE REPO OPERATION
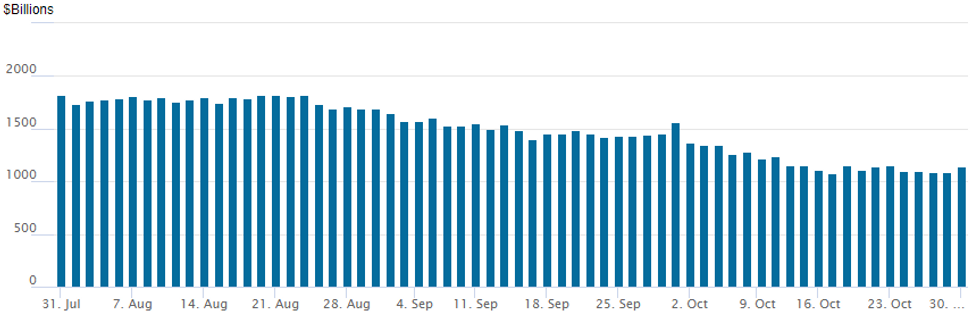
NY Federal Reserve/MNI
The NY Fed Reverse Repo operation usage inches up to $1,138.035B w/101 counterparties vs. $1,091.858B in the prior session -- just above October 17 level of $1,082.399B - the lowest level since mid-September 2021. The high for 2023 stands at $2,375.171B on Friday March 31, 2023; all-time record high of $2,553.716B reached December 30, 2022.
SOFR/TREASURY OPTION SUMMARY
Option desks reported better Treasury put trade on net Monday, while SOFR options leaned toward calls on lighter volumes as traders plied the sidelines to await Wednesday's FOMC policy annc, NFP employment data on Friday. Underlying futures weaker, but off lows after US Tsy borrowing estimates came out appr $75B less than estimated ($776B vs. $852B). Meanwhile, projected rate hikes into early 2024 gain slightly: November steady at 0% to 5.325%, December cumulative of 5.8bp at 5.387%, January 2024 cumulative 8.4bp at 5.413%, March 2024 at 4.3bp at 5.371%. Fed terminal at 5.415% in Feb'24.- SOFR Options:
- 2,000 2QH4 96.75/97.00/94.75 call flys ref 95.85
- +7,500 0QM4/2QM4 96.00 call spds, 1.5 net short Jun over
- 9,000 0QZ3 95.68/96.37 call spds ref 95.375
- 1,000 2QZ3 96.00/96.25/96.50/96.75 call condors ref 95.865
- 1,000 0QF4 95.12 puts vs. 2,000 2QF4 95.00/95.25 put spds
- 2,000 0QX3 94.87/95.18/95.37 broken put fly ref 95.42
- 1,250 SFRF4 94.75 straddles, 37.75 ref 94.67
- Treasury Options:
- +12,000 wk2 10Y 104.5 puts, 12 to 11 ref 106-02.5
- 2,500 TYZ3 109 calls, 11
- 5,300 FVZ3 104/104.25 put spds ref 104-13.5
- +15,000 TYZ3 104.75/105/106 put trees, 2 cr ref 106-08.5
- 1,500 TYZ3 103/104.5 3x1 put spds vs. TYZ3 108/109 1x3 call spds ref 106-00
- over 52,400 TYZ3 105 puts, 33-35 ref 106-02
- over 8,900 weekly 10Y 107 calls, 9-10 ref 106-11.5 to -12.5
- 2,500 FVZ3 103/103.5 put spds ref 104-18.75
- 3,500 TYZ3 105/106 put spds 4 over TYZ3 108 calls ref 106-08.5
EGBs-GILTS CASH CLOSE: Soft Inflation Data Sees Bunds Outperform
Bunds handily outperformed Gilts Monday as softer-than-expected German and Spanish inflation data cemented the likelihood that the ECB is done hiking.
- The German short-end/belly outperformed 10s as state-level data and then the national print confirmed a slowdown in both headline and core pressures, while Spanish HICP was also below expectations.
- MNI's Nowcast for Tuesday's Eurozone HICP figure points to a sub 3% Y/Y reading.
- Periphery spreads fell as ECB cut pricing mounted (over 80bp in reductions priced in 2024, vs under 60bp a couple of weeks ago) on the back of the soft inflation data, with BTPs outperforming.
- EGB gains faded however. A Nikkei sources story pointing to the Bank of Japan potentially adjusting its yield curve control regime in a hawkish direction at its meeting overnight tonight saw global bonds pull back in European afternoon trade.
- Gilts traded relatively soft ahead of Thursday's BOE decision.
- Attention overnight will be on the BOJ decision, followed by French / Italian / Eurozone inflation data Tuesday morning.
Closing Yields / 10-Yr Periphery EGB Spreads To Germany
- Germany: The 2-Yr yield is down 2.4bps at 3.013%, 5-Yr is down 1.5bps at 2.668%, 10-Yr is down 1bps at 2.822%, and 30-Yr is down 2bps at 3.104%.
- UK: The 2-Yr yield is up 0.6bps at 4.783%, 5-Yr is up 3.1bps at 4.506%, 10-Yr is up 1.7bps at 4.561%, and 30-Yr is up 0.6bps at 5.031%.
- Italian BTP spread down 5.6bps at 191.6bps / Spanish down 2.3bps at 107.2bps
EGB Options: Upside Unwinds To Start The Week
Monday's Europe rates / bond options flow included:
- DUZ3 105.30/105.50cs, bought for 5 in 3k
- 0RZ3 97.00/97.25/97.50 c ladder Bot for 3.25 in +5k (Bot the 1 leg)
- 2RH4 97.25/97.62/98.00c fly vs 96.50p, bought the fly for 1.5 in 6k
- ERM4 96.25/96.37 cs vs 96.12/96.00 ps, ppr sells the cs in -5k from 2 down to 1.75 (-cs/+ps) (unwind)
- SFIH4 93.80/94.30/94.80 c fly Sold at 10.5 in -5k (traded vs 94.74)
FOREX USD Loses Ground As Equities Rally To Start The Week
- Firmer price action for major equity benchmarks have kept the greenback on the backfoot on Monday, with a very busy week of data and event risk ahead. The USD index slides 0.4% to start the week, with the associated gains broadly spread out among other G10 currencies.
- The most notable move on the session came for USDJPY as Nikkei headlines surfaced ahead of the Bank of Japan decision overnight. Reports the BOJ may allow further flexibility in yield movements bolstered the Japanese Yen and saw USDJPY fall from around 149.75 all the way down to fresh lows of 148.81 amid the broader greenback offer. The 20-day EMA has been breached, exposing the 50-day EMA as next support, at 147.98.
- The very early dip for EURUSD was associated with some lower-than-expected state level inflation data in Germany. However, as the session progressed, the more benign inflation data and the positive equity backdrop filtered through to a consistent grind higher for the pair. While EURUSD remains below 1.0694, technical conditions remain in bearish territory.
- AUD and NZD are among the session's best performers, rising over 0.5%. Market moves were underpinned by Australia's September retail sales, which topped expectations at 0.9% vs. Exp. 0.3%. Resultingly, AUD/USD trades back above 0.6350 and is narrowing in on the 50-dma resistance of 0.6395. Clearance here could be one of the first signs of a bullish reversal off the 0.6270 bottom, however the medium-term downtrend remains intact.
- China manufacturing and non-manufacturing PMIs kick off the docket overnight before the aforementioned BOJ policy decision. Eurozone inflation then takes focus before Canada GDP and US employment cost index figures. Later in the session, the MNI Chicago PMI and consumer confidence for the US are scheduled.
FX Expiries for Oct31 NY cut 1000ET (Source DTCC)
- EUR/USD: $1.0450(E1.2bln), $1.0500(E1.1bln), $1.0525-33(E1.2bln), $1.0575-80(E688mln), $1.0600-20(E1.6bln), $1.0640-50(E835mln), $1.0700-10(E770mln)
- USD/JPY: Y148.45-65($1.1bln), Y150.00-15($1.3bln)
- GBP/USD: $1.2160-80(Gbp536mln)
- NZD/USD: $0.5850(N$641mln)
Late Equity Roundup: Back to Thursday Levels
- Stocks are extending late session highs at the moment, no obvious headline driver as indexes recover from Friday's pre-weekend selling back to late Thursday prices.
- Currently, DJIA is currently up 533.35 points (1.65%) at 32953.37, S&P E-Mini Future up 50.75 points (1.23%) at 4188.75, Nasdaq up 157.6 points (1.2%) at 12801.36.
- Some desks suggest (unconfirmed) month-end asset allocation from FI into stocks may be at play, while others opt to focus on this morning's lower than expected German CPI instead of earlier Nikkei story regarding the Bank of Japan to consider tweaking yield curve control framework at tomorrow's policy meeting.
- Current leaders: Communication Services and Financial sectors continue to outperform, telecom and media/entertainment shares buoying the former: Charter Communications +4.82%, Verizon +3.9%, Netflix +3.43% and AT&T +3.34%. Meanwhile, bank and insurance names buoyed the Financial sector: Goldman Sachs +3.78%, M&T Bank +3.46%, Blackstone +3.41%, Hartford +3.07%.
- Laggers: Energy and Real Estate sectors underperformed, oil and gas servicer shares weighed on the former: EQT Corp -2.24%, Coterra -1.95%, Kinder Morgan -1.8%. Real estate investment trusts, particularly for retail and healthcare lagging: Realty Income Corp -5.8%, Healthpeak Properties -4.08%.
E-MINI S&P TECHS: (Z3) Southbound
- RES 4: 4462.50 Trendline resistance drawn from the Jul 27 high
- RES 3: 4430.50 High Oct 12
- RES 2: 4372.76 50-day EMA
- RES 1: 4295.88/4312.52 Low Oct 4 / 20-day EMA
- PRICE: 4189.25 @ 1510 ET Oct 30
- SUP 1: 4122.25 Low Oct 27
- SUP 2: 4100.00 Round number support 4124.19
- SUP 3: 4090.35 1.764 proj of the Jul 27 - Aug 18 - Sep 1 price swing
- SUP 4: 4049.00 Low Mar 28
S&P e-minis maintain a softer tone. The contract traded to a fresh cycle low Friday and bears remain in the driver’s seat. Last week’s breach of support at 4235.50, Oct 4 low and bear trigger, confirms a resumption of the downtrend and maintains the bearish price sequence of lower lows and lower highs. Moving average studies are in a bear-mode position too. The focus is on 4100.00. Initial firm resistance is at 4295.88, the 20-day EMA.
COMMODITIES Crude Slides Whilst Gold Also Fades Netanyahu No Ceasefire Headlines
- Crude futures have extended losses on the day, with WTI reaching an intraday low of $81.82/b, the lowest level since Aug 31.
- The market weighs the risks to Iranian supplies from the Israel conflict. Weak fuel demand is also weighing on oil market ahead of the latest US Fed and BOE central bank meetings later this week.
- One surprising factor has been the lack of support to prices from Israeli PM Netanyahu saying Israel will not agree to any ceasefire with Hamas.
- Portfolio Investors have restarted sales of petroleum contracts last week as fears over the conflict in the Middle East are swapped for concerns over high interest rates and a sluggish global economy, according to Reuters.
- Saudi’s defense Minister Khalid bin Salman is set to visit Washington Monday to meet with senior Biden officials – as the Israel/Hamas war threatens to spill over into a wider conflict, a key factor driving oil in October.
- WTI is -3.4% at $82.62 in a step closer to a key support at $80.20 (Oct 6 low).
- Brent is -2.7% at $88.01 in a step closer to $85.18 (Oct 12 low) after which sits a bear trigger at $83.44 (Oct 6 low).
- Gold is -0.4% at $1997.67 but last week’s strength sees it far above support at $1937.6 (20-day EMA) and with technicals biased to further gains.
TUESDAY DATA CALENDAR
| Date | GMT/Local | Impact | Flag | Country | Event |
| 31/10/2023 | 2330/0830 | * |  | JP | Labor Force Survey |
| 31/10/2023 | 2350/0850 | ** | | JP | Industrial production |
| 31/10/2023 | 0001/0001 | * |  | UK | BRC Monthly Shop Price Index |
| 31/10/2023 | 0130/0930 | *** |  | CN | CFLP Manufacturing PMI |
| 31/10/2023 | 0130/0930 | ** | | CN | CFLP Non-Manufacturing PMI |
| 31/10/2023 | 0300/1200 | *** | | JP | BOJ policy announcement |
| 31/10/2023 | 0630/0730 | *** |  | FR | GDP (p) |
| 31/10/2023 | 0630/0730 | ** | | FR | Consumer Spending |
| 31/10/2023 | 0700/0800 | ** |  | DE | Retail Sales |
| 31/10/2023 | 0700/0800 | ** | | DE | Import/Export Prices |
| 31/10/2023 | 0730/0830 | ** |  | CH | Retail Sales |
| 31/10/2023 | 0745/0845 | *** | | FR | HICP (p) |
| 31/10/2023 | 0745/0845 | ** | | FR | PPI |
| 31/10/2023 | 0900/1000 | *** |  | IT | GDP (p) |
| 31/10/2023 | 0900/1000 | *** | | DE | GDP (p) |
| 31/10/2023 | 1000/1100 | *** |  | EU | HICP (p) |
| 31/10/2023 | 1000/1100 | *** | | EU | EMU Preliminary Flash GDP Q/Q |
| 31/10/2023 | 1000/1100 | *** | | EU | EMU Preliminary Flash GDP Y/Y |
| 31/10/2023 | 1000/1100 | *** | | IT | HICP (p) |
| 31/10/2023 | 1100/1200 | ** | | IT | PPI |
| 31/10/2023 | 1230/0830 | *** |  | CA | Gross Domestic Product by Industry |
| 31/10/2023 | 1230/0830 | ** |  | US | Employment Cost Index |
| 31/10/2023 | 1255/0855 | ** | | US | Redbook Retail Sales Index |
| 31/10/2023 | 1300/0900 | ** | | US | S&P Case-Shiller Home Price Index |
| 31/10/2023 | 1300/0900 | ** | | US | FHFA Home Price Index |
| 31/10/2023 | 1300/0900 | ** | | US | FHFA Home Price Index |
| 31/10/2023 | 1300/0900 | ** | | US | MNI Chicago Report |
| 31/10/2023 | 1400/1000 | *** | | US | Conference Board Consumer Confidence |
| 31/10/2023 | 1400/1000 | ** | | US | Housing Vacancies |
| 31/10/2023 | 1430/1030 | ** | | US | Dallas Fed Services Survey |
| 31/10/2023 | 1530/1130 | ** | | US | US Treasury Auction Result for 52 Week Bill |
Why MNI
MNI is the leading provider
of intelligence and analysis on the Global Fixed Income, Foreign Exchange and Energy markets. We use an innovative combination of real-time analysis, deep fundamental research and journalism to provide unique and actionable insights for traders and investors. Our "All signal, no noise" approach drives an intelligence service that is succinct and timely, which is highly regarded by our time constrained client base.Our Head Office is in London with offices in Chicago, Washington and Beijing, as well as an on the ground presence in other major financial centres across the world.