
Why MNI
MNI is the leading provider
of intelligence and analysis on the Global Fixed Income, Foreign Exchange and Energy markets. We use an innovative combination of real-time analysis, deep fundamental research and journalism to provide unique and actionable insights for traders and investors. Our "All signal, no noise" approach drives an intelligence service that is succinct and timely, which is highly regarded by our time constrained client base.Our Head Office is in London with offices in Chicago, Washington and Beijing, as well as an on the ground presence in other major financial centres across the world.
HIGHLIGHTS
- US Yields reverse higher, rising between 8-11bps on the day ahead of ISM Manufacturing PMI and Chair Powell on Friday.
- In similar vein, the USD index has extended the bounce from the prior day's lows to 1.07%, rising back above 103.50. EURUSD also slides back below the 1.0900 mark as market participants fully digest a weaker set of Eurozone inflation data.
- Crude futures are set for an intra-day decline of roughly 2.3%, as the market met OPEC’s announced output cuts of 2.2m b/d with scepticism.

US TSYS: Bear Steeper With Powell In Focus Tomorrow Before FOMC Blackout
- Cash Tsys sit 7-11bp cheaper on the day, led by 10s but with the very long end lately extending session lows. It’s a move that reverses yesterday’s rally after yesterday's month-to-date (and for 2s, multi-month) lows in yields.
- There has been a deluge of data today, none of it providing enough of a catalyst to promote an extension of the recent large rally. For instance, core PCE was close to expected at 0.16% M/M but the distribution of known Q3 downward revisions were about as hawkish as they could have been and continuing claims appeared to have a significant seasonal adjustment skew that makes the underlying data less worrisome than headlines suggest. It was then followed by a much stronger than expected MNI Chicago PMI.
- Long positioning, both in terms of recent biases on the SOFR strip and in Tsys had narrowed the scope for fresh capital to be put to work and Williams (permanent voter) and Daly (’24 voter) offered some pushback against rate cut excitement after Waller’s dovish musings on Tuesday.
- TYH4 at 109-22+ sits at the day’s lows, for a sizeable retracement off yesterday’s high of 110-15+ to dent the extension of the bullish theme. It’s doesn’t yet trouble support at 109-05+ (Nov 28 low).
- Near-term FOMC pricing is similar to pre-data levels, with a first cut priced for the May FOMC and close to 50/50 it comes in March instead. After that it builds to a cumulative 112bp of cuts through 2024 vs 121bp shortly ahead of the data as implied rates slipped pre-release.
- Tomorrow sees initial data focus on ISM manufacturing, of added note after today’s Chicago PMI strength and other manufacturing surveys also pointing to some upside risk, before Fed Chair Powell headlines the docket in a fireside chat at 1100ET including text. The FOMC media blackout begins Friday midnight ET.
EGBs-GILTS CASH CLOSE: Fading Recent Gains Despite Soft EZ Inflation
Core European FI lost some ground Thursday despite continued downside surprises in Eurozone inflation data, with Gilts underperforming.
- The Netherlands and then France continued the trend of below-expected Euro November flash inflation readings (after Germany and Spain Wednesday), with the Eurozone-wide figure coming below every analyst expectation on both headline and core coming into the week.
- By late morning though, this week's impressive rally appeared to lose steam, and both Bunds and Gilts faded over the rest of the session, cheapening alongside Treasuries as some Fed speakers appeared to push back against rate cuts, and US data was too mixed to generate another leg to the bond rally (including a very strong MNI Chicago PMI).
- The drop in Gilts was particularly pronounced, despite apparent UK-specific drivers.
- Periphery spreads widened despite the increasingly dovish outlook for ECB rates.
- Final PMIs are the early highlight Friday.
Closing Yields / 10-Yr Periphery EGB Spreads To Germany
- Germany: The 2-Yr yield is down 2bps at 2.816%, 5-Yr is up 0.8bps at 2.374%, 10-Yr is up 1.5bps at 2.447%, and 30-Yr is up 0.6bps at 2.687%.
- UK: The 2-Yr yield is up 4bps at 4.608%, 5-Yr is up 7.5bps at 4.175%, 10-Yr is up 8bps at 4.176%, and 30-Yr is up 9.3bps at 4.691%.
- Italian BTP spread up 4.2bps at 178.4bps / Spanish up 2.3bps at 102.5bps
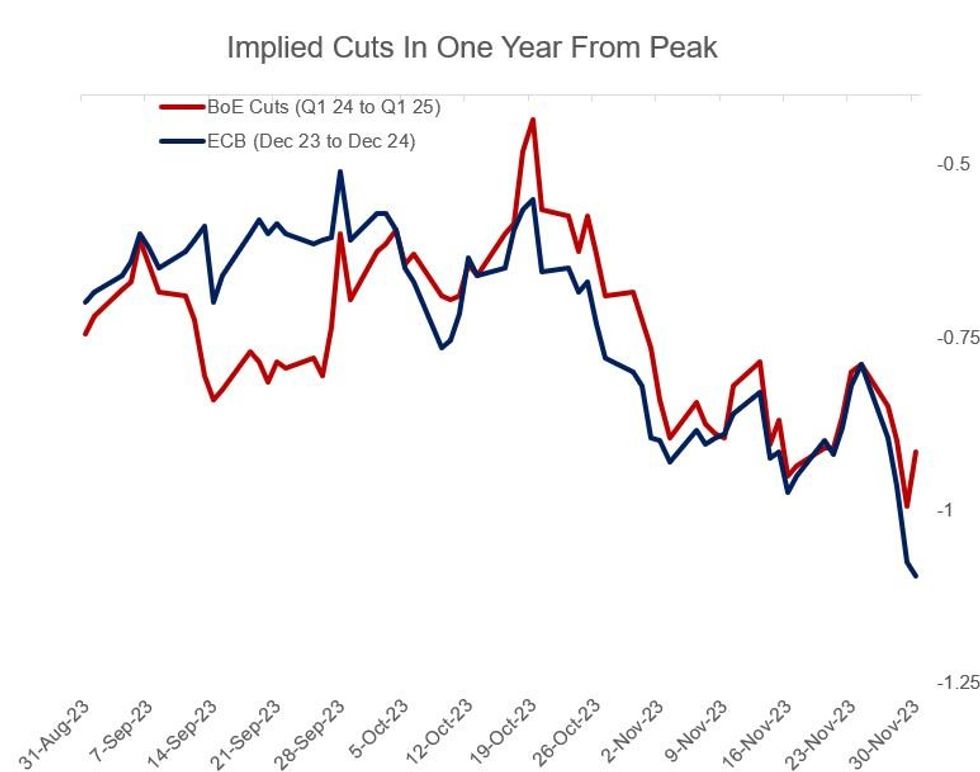
EU STIR: ECB Cut Pricing Deepens But Off Day's Extremes, BoE Implied Cuts Retrace
Implied ECB rate cuts deepened further Thursday on a second day of below-expected Eurozone inflation prints, but finished off dovish extremes. BoE rate cut expectations were pared slightly.
- Market-implied 2024 rate cuts reached 114bp in early trade, a new cycle high, but faded to 108bp by the close.
- The anticipated path includes a fully-priced rate cut by April 2024, with a second by July (and a high probability of a June reduction).
- In contrast, BoE rate cut expectations for the year following the Feb / Mar 2024 peak were pared by 6bp to 93bp, with the first cut seen at the August MPC (was briefly seen at the April meeting) and a second by November.
FOREX: EURUSD Slides Back below 1.0900 Amid Soft CPI & Recovering Greenback
- Higher US yields have contributed to a rebound for the USD index on Thursday. Softer headline US data was brushed aside with some firmer underlying details supporting the greenback. An additional bout of USD weakness around the month-end fix also proved short lived with the DXY close to session highs approaching the APAC crossover, up 0.75% on the session.
- EURUSD hovers right at session lows as the single currency continues to be one of the worst performers in G10. The euro was initially undermined this morning by a series of lower-than-expected CPI prints from France and the Netherlands - releases which spelled downside risks vs consensus for the Eurozone CPI Estimate, which also came in below surveyed median forecasts.
- The trend outlook in EURUSD remains bullish and the pullback from yesterday’s high is likely a correction. Note that the trend condition is overbought and a corrective pullback would allow this set-up to unwind. Initial support to watch is 1.0852, the Nov 22 low.
- USDJPY had a volatile session with an impressive 166-pip range. An initial blip lower on the US data could only take the pair down to 147.24, well shy of the overnight lows and the powerful turnaround saw the recovery extend to as high as 148.51. The aforementioned greenback weakness around the WMR fix saw another dip to 147.72 before the pair recaptured the 148 handle approaching the close.
- Elsewhere, the Swiss Franc extended on Wednesday’s advance, with another sizeable slide in EUR/CHF through the WMR fix, with no headlines or data to trigger the move in CHF specifically, leaving the move likely a result of month-end flow - nonetheless the EUR/CHF slippage puts the cross further through support of the 50- and 100-dmas of 0.9599 and 0.9592 and is narrowing the gap with key support and the bear trigger of 0.9417.
- Worth noting CHF implied vols are bid, with spot volatility likely feeding into the gauges. The 2w implied EUR/CHF contract is particularly firm, with the contract capturing both the ECB and SNB decisions on December 14th.
- Final Eurozone manufacturing PMI data are unlikely to move the dial, and greater focused will be placed on the US ISM Manufacturing PMI to round off the week. Worth noting ECB’s Lagarde is also due to speak at the ECB Forum on Banking Supervision, in Frankfurt.
FX: Expiries for Dec01 NY cut 1000ET (Source DTCC)
- EUR/USD: $1.0875-80(E719mln), $1.0900-15(E2.3bln), $1.0995-00(E2.2bln)
- USD/JPY: Y147.00($1.0bln), Y147.50-70($860mln), Y148.00($802mln), Y148.50($734mln), Y148.85-00($1.0bln)
- GBP/USD: $1.2680-00(Gbp1.0bln)
- AUD/USD: $0.6610-25(A$1.3bln)
- USD/CAD: C$1.3600-20($1.8bln)
Larger FX Option Pipeline
* EUR/USD: Dec04 $1.0820-35(E1.6bln), $1.0860-65(E1.1bln), $1.0925-30(E1.4bln), $1.1025-30(E1.1bln)
* USD/JPY: Dec04 Y147.00($1.1bln), Y148.00($1.5bln); Dec05 Y147.50($1.0bln), Y148.00($1.5bln)
* NZD/USD: Dec06 $0.6100-10(N$1.6bln)
US FI OPTIONS: Mixed Trade Thursday
Thursday's US rates / bond options flow included:
- SFRH4 94.87/94.68/94.62/94.18p condor, sold at 8 in 5k
- SFRH4 94.81/95.00/95.18c fly vs 94.56p, bought the fly for 0.25 in 5k total
- SFRZ3 94.68c, traded half in 2.5k
- SFRF4 94.75/94.68/94.62p fly traded for 1.25 in 1k
- SFRJ4 92.25/95.75/96.25c fly, traded 7.5 in 1k
- SFRM4 95.12/94.75 put spread 5K lots blocked at 18, market sources suggest a buyer.
- SFRM4 95.12/94.75ps, traded 18 in 5k (Block).
- SFRU4 96.00/96.50cs, sold at 10 in 10k
- SFRZ5 96.50/97.50cs sold at 36.5 in 5k.
- 0QZ3 97.50/97.75/98.50c fly traded flat in 1.5k
- 0QZ3 96.00/96.12/96.50 traded -1 in 2k
- 0QZ3 95.37/95.25/95.12/95.00p condor traded half in 3.5k
- 0QG4 96.00/96.37/96.75c fly vs 95.25/94.62ps, traded 3.5 in 2k
- FVF4 108.25 calls ~14K given at 0-14, delta +24%
- TYG4 104.50 puts saw paper pay 0-05 on ~3K, delta -5%
EU FI OPTIONS: Euro Rate Call Condors Follow SFR/SFI's Lead
Thursday's Europe rates / bond options flow included:
- ERH4 96.00/96.12/96.25/96.37c condor, bought for 5.5 in 15k
- ERM4 96.375/96.25/96.00p ladder sold at 1.5 in 14.5k.
- ERM4 96.37/96.25ps sold at 4.75 in 20k
- DUH4 106.50/107.00/107.20c fly bought for 5.5 in 5k
- 0RF4 97.25/97.00/96.75p fly vs 0RH4 97.00/96.62/96.00p fly, bought the Marchfor -0.5 (receives) in 6k.
US STOCKS: Megacaps Weigh Heavily But Nasdaq Still Gains ~10% In Nov
- The S&P e-mini was lifted slightly off lows of 4544.75 but remains underwater today, with a headwind from higher Treasury yields following US data and Fedspeak from Daly and Williams.
- The day’s earlier gains to 4578.25 struggled to get close to yesterday’s high of 4597-00 that stopped fractionally short of key resistance at 4597.50 (Sep 1 high).
- The S&P e-mini tracking at -0.1% heavily outperforms the Nasdaq 100 (-0.8%), whilst underperforming the Dow (+0.9%) and Russel (+0.3%). Nasdaq monthly gains are trimmed to just under 10% vs 8% for the S&P 500.
- In cash space, multiple major names are under pressure today, with Nvidia (-3.2%), Alphabet (-2.7%), Meta (-2.7%), Tesla (-2.1%), Amazon (-1.3%) and Microsoft (-0.8%) all seeing heavy declines.
- Within the S&P 500, those names see communication services lag heavily (-1.6%), followed by consumer discretionary (-0.8%) and tech (-0.6%), whilst health care, industrials and materials all lead (+0.8%).
COMMODITIES: Crude Futures Reverse Lower Following OPEC+ Meeting Announcements
- Crude is set for an intra-day decline, as the market met OPEC’s announced output cuts of 2.2m b/d with scepticism. Crude regained some ground after further details of the cuts were revealed, but it remains lower on the day. The resumption of loadings from Black Sea Ports have added some further downside.
- WTI futures are down 2.2% at 76.14$/bbl with the trend outlook unchanged and remaining bearish. On the downside, the bear trigger lies at $72.37, the Nov 16 low. Clearance of this level would resume the downtrend.
- For NatGas, Henry Hub down marginally on the day, as a larger than expected US inventory build has added further downside. However, prices have regained ground from their intraday low of $2.767/MMBtu.
- In precious metals, the firmer greenback weighed on spot gold, which has fallen 0.44%. However, spot silver continues its impressive run higher, continuing to trade at the best levels since May.
FIXES AND PRIOR SESSION REFERENCE RATES
SOFR FIX
REPO REFERENCE RATES (rate, change from prev. day, volume):
* Secured Overnight Financing Rate (SOFR): 5.31%, -0.01%, $1578B
* Broad General Collateral Rate (BGCR): 5.30%, no change, $600B
* Tri-Party General Collateral Rate (TGCR): 5.30%, no change, $585B
SOFR dipped back 1bp to 5.31% yesterday, where it ran through Nov 20-22 for the lowest since Oct 30. SOFR volumes are still confined to recent ranges.
New York Fed EFFR for prior session (rate, chg from prev day):
* Daily Effective Fed Funds Rate: 5.33%, no change, volume: $96B
* Daily Overnight Bank Funding Rate: 5.32%, no change, volume: $253B
Yesterday saw a second session of near unchanged Fed Funds volumes.
FED: RRP Usage Falls Despite Month End
- RRP usage fell back to $888B (-$26B) after the $44B rise off the recent lows of $866-873B seen Fri-Tue for lows since July 2021.
- It’s a particularly low figure considering month-end usually sees temporary inflows.
- Indeed, the number of counterparties increased from 91 to 95, but that compares with the 100 counterparties for $1,138B for October month-end.

US DATA: Core PCE and Supercore Trends Resume Moderation
- Core PCE was slightly softer than expected in October at 0.16% M/M (cons 0.2) after an upward revised 0.315% M/M (initial 0.30%).
- Notably, yesterday’s downward revision to Q3 turned out to be backloaded in the quarter, largest in Jul and then also in Aug.
- The three-month run rate inched a tenth down to 2.4% annualized, still above the 1.9% from Aug, although the six-month rate at 2.5% slowed to its lowest since Feb'21.
- PCE core services ex-housing 0.148% M/M after an upward revised 0.447% M/M (initial 0.42).
- The three-month run rate eased back to 2.8% annualized, below the 2.9% in Aug for its lowest since Dec’20.

US DATA: Some Wild Seasonal Adjustment Processes At Play In Continuing Claims, Biasing Higher
- Initial jobless claims increased to a seasonally adjusted 218k (cons 218k) in the week to Nov 25 after a slightly upward revised 211k (initial 209k).
- Continuing claims were far more notable, rising to a seasonally adjusted 1927k (cons 1865k) in the week to Nov 18, a payrolls reference period, from 1841k (initial 1840k).
- At face value it's an ominous figure, the highest since Nov'21 and suggestive of slower hiring.
- However, this 86k increase in the SA figure came despite a 98k decrease in the NSA data. That’s notable as the average for the same week in ‘normal’ years (which we define as 2016-19 and 2022) was a 1k increase.
- We’ve previously published the below chart and last week mentioned how the surprising decline in continuing claims had been helped by the most favorable adjustment (i.e. pushing claims lower) of the year. This week, the same process has seen us having to double the scale for the most unfavorable adjustment – see below.

US DATA: Consumption Boost From Savings Rate Decline Fading
- Personal spending and income growth was as expected in nominal terms in October, with spending rising 0.22% M/M (cons 0.2) and incomes 0.25% M/M (cons 0.2).
- Goods spending (-0.2%) mirrored the weakness seen in retail sales, with services (+0.4%) more resilient.
- Real spending was more mixed relative to consensus, rising 0.17% M/M (cons 0.1) but after a downward revised 0.34% M/M (prior rounded to 0.4). There was a less clear cut split between goods and services here, goods rising 0.1% vs services 0.2% M/M.
- It leaves overall real consumption running at a still strong 3.0% annualized on a 3M/3M basis (following 3.6% in Q3), although the latest trend is softer at 2.1% annualized on a three-month basis.
- Back in nominal terms, disposable income increased 0.3% M/M after 0.4% M/M. It’s helped see a stabilization in the saving ratio at 3.9% (from 3.8% in Sep) after a sharp run down in Q3 helped fuel strong consumption growth, which in turn had reversed the build in savings rates in Q2 that came along with the consumption soft patch (when it increased 0.8% annualized).

Chicago Business Barometer™ - Surges to 55.8 in November
 Photo by Neal Kharawala on Unsplash
The Chicago Business Barometer™, produced with MNI surged +11.8 points to 55.8 from 44.0 in October. This represents the first expansionary reading since August 2022, the highest level since May 2022, and the biggest monthly rise since September 2020.

Source: MNI / ISM Chicago
PRODUCTION RE-ENTERS EXPANSIONARY TERRITORY; ORDER BACKLOGS AND SUPPLIER DELIVERIES ALSO RISE
Production improved +15.9 points to 62.4 – the highest level since December 2021, and re-enters expansion after last months contraction.
Order backlogs rose +7.4 points higher.
Supplier deliveries extended +9.7 points.
NEW ORDERS, INVENTORIES AND EMPLOYMENT RISE NOTABLY; PRICES PAID FALLS SLIGHTLY
New Orders rose +12.5 points, the second consecutive month-on-month rise, and is now only -0.9 points below August’s recent high. The change was driven by an increase in demand by respondents.
Employment advanced +3.7 points to 53.9, the highest level since July 2022.
Prices paid remained largely unchanged at -0.2 points to 59.9 and remains below levels seen for the majority of the last three calendar years.
Inventories expanded by +9.9 points, as businesses scaled up for higher production.
The survey ran from 1 November to 13 November
CANADA DATA: GDP Surprises Softer In Q3 Amidst Particularly Mixed Report
- Real GDP was softer than expected in Q3, slowing to -1.1% annualized (cons 0.1) for worse than any analyst expected and far below the +0.8% the BoC had forecast in its October MPR.
- However, the impact was offset by a large upward revision to Q2, now seen at 1.4% vs the prior -0.2%.
- There’s a lot to unpack within the details. Contrary to the swing in GDP growth rates, final domestic demand has been very consistent for the past two quarters, printing 1.3% after 1.2% and probably exactly the sort of below-trend pace the BoC would want to see to dampen inflationary pressures in a controllable manner.
- What’s changed from a GDP perspective is that net exports have swung from a 0.0pps non-annualized contribution to -0.3pp (mainly on export weakness, with a 5% annualized contraction the largest since 2Q21) and the change in inventories switching from 0.0pp to a -0.2pp non-annualized drag.
- That said, the latest steady domestic demand growth belies an oversized contribution from the public sector. Government consumption surged 7.3% annualized in Q3 for its strongest since 2H20 and before that 2008.
- Private sector demand was much weaker: household consumption increased 0.1% annualized after -0.1% whilst business investment fell 2% after a rare 4.5% increase back in Q2.
- As for the strong Q2 upward revision, it was led by business investment (4.5% annualized vs initial 1.6%) and changes in inventories (0.0pp non-annualized vs -0.2pp). Net exports also helped (0.0pp non-annualized vs -0.1pp) as stronger export growth (5.1% vs 0.4%) was in large part offset by stronger import growth (4.4% vs 1.9%).

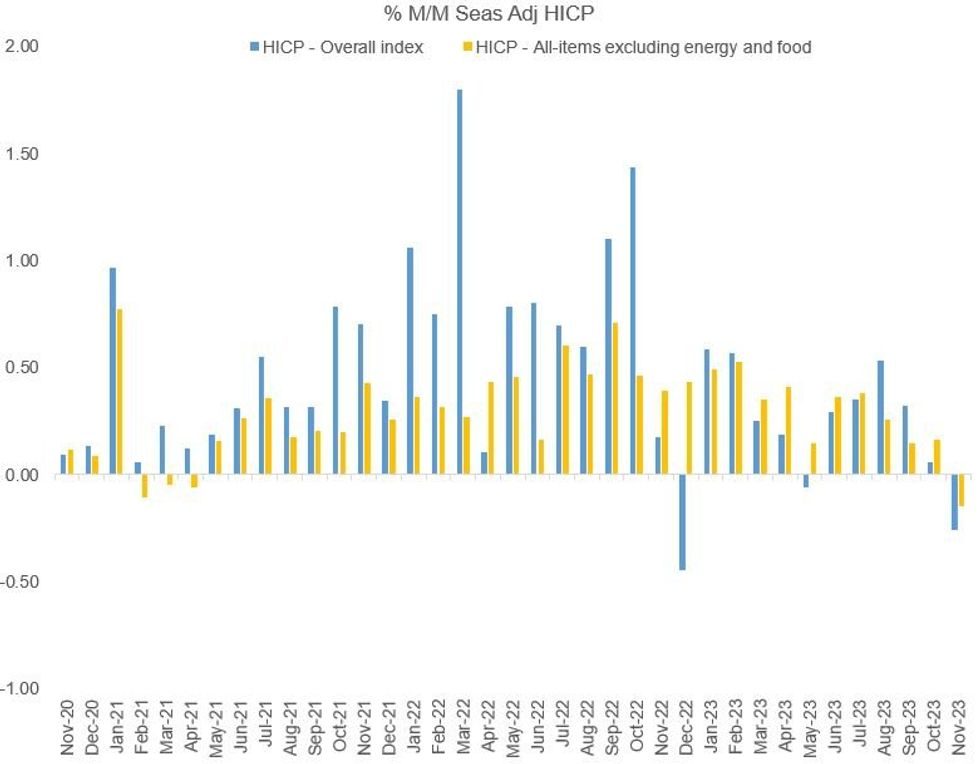
EUROZONE DATA: M/M SA Core HICP Turns -ve For First Time Since Apr 2021 (1/2)
MNI's calculations indicate broad-based further moderation in Eurozone core, services, non-energy industrial goods and food price momentum in November, based on the ECB's seasonally-adjusted monthly figures released this afternoon.
- On a monthly sequential basis, headline HICP came in at -0.26% M/M, vs +0.06% prior - marking the first decline since May and the lowest reading since December 2022.
- Core (ex-energy/food) HICP printed at -0.15% M/M (vs +0.16% prior), the first negative value since April 2021 and below the ECB's 2% target on an annualised basis for a third month in a row.
- Services also declined to -0.10% M/M (vs +0.31% prior) - the first decline since June 2022 - while non-energy industrial goods fell to -0.10% M/M (vs -0.03% prior), for the 3rd consecutive decline (first time that's happened since Apr-May-Jun 2020).
- While the November flash M/M figures were released this morning by Eurostat (-0.5% headline, the lowest since Jan 2020, vs -0.2% expected, +0.1% prior), the SA figures provide a better guide to actual inflation trends vs both those non-seasonally adjusted numbers, and vs the previous year's base effect impact on Y/Y readings.
 Source: ECB, MNI
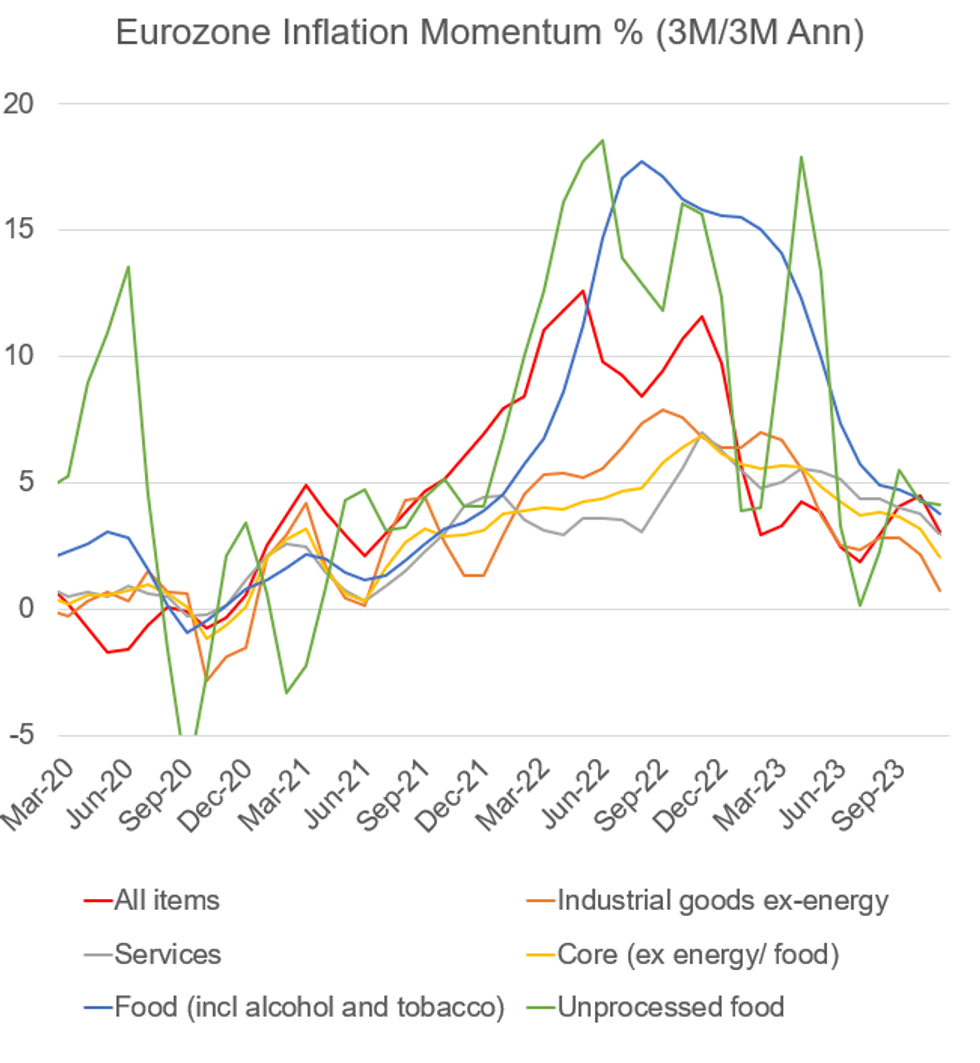
EUROZONE DATA: Momentum In Services, Core Goods HICP Decelerating Sharply (2/2)
Looking at 3M/3M inflation momentum based on the seasonally-adjusted HICP series, there was likewise disinflationary progress evident across the board:
- Headline Eurozone HICP momentum as calculated by MNI declined to a three-month low 3.03% 3M/3M SAAR (vs 4.49% prior) after an uptick in October.
- Core (ex-energy/food) momentum printed at 2.03% (down from 3.18% in September and the lowest since July 2021).
- Services inflation momentum saw a sizeable deceleration to 2.92% (vs 3.77% prior), alongside non-energy industrial goods which decelerated markedly to a 29-month low 0.75% (vs 2.15% prior).
- Further detail into the deceleration in sequential prices will be available upon the final November inflation report on December 19.
- But as the major expected headline upside drivers for December are primarily non-core or due to seasonal effects, core momentum seems on track for further underlying easing next month as well.
 Source: ECB, MNI Calculations
Why MNI
MNI is the leading provider
of intelligence and analysis on the Global Fixed Income, Foreign Exchange and Energy markets. We use an innovative combination of real-time analysis, deep fundamental research and journalism to provide unique and actionable insights for traders and investors. Our "All signal, no noise" approach drives an intelligence service that is succinct and timely, which is highly regarded by our time constrained client base.Our Head Office is in London with offices in Chicago, Washington and Beijing, as well as an on the ground presence in other major financial centres across the world.