
Free Trial
Why MNI
MNI is the leading provider
of intelligence and analysis on the Global Fixed Income, Foreign Exchange and Energy markets. We use an innovative combination of real-time analysis, deep fundamental research and journalism to provide unique and actionable insights for traders and investors. Our "All signal, no noise" approach drives an intelligence service that is succinct and timely, which is highly regarded by our time constrained client base.Our Head Office is in London with offices in Chicago, Washington and Beijing, as well as an on the ground presence in other major financial centres across the world.
- Treasury yields broadly consolidate yesterday's sizeable rally
- But further declines in real yields and USD weakness support risk assets
- With oil performing strongly ahead of expected large OPEC+ production cuts

US TSYS: Ultimately Broad Consolidation Of Yesterday's Sizeable Rally
- Cash Tsys sit with a 2.5-4.5bp rally across 2-10Y tenors and a smaller cheapening in the very long end, broadly consolidate yesterday’s significant belly-led rally albeit after some volatility.
- JOLTS openings implied a faster than expected decline in labor demand but the move lower in Fed hike pricing was short-lived. There were few catalysts for the move higher in yields with Jefferson and Daly broadly keeping in line with other member commentary although breakevens bounced further after their September slide and with oil up strongly ahead of expected OPEC+ cuts tomorrow.
- That drove a range for 2YY of 3.99-4.11%, currently nudging the top of that, with 2s10s now little changed from yesterday’s close at -48bp (-1bp) after flattening through the US session.
- TYZ2 at 113-14+ has pulled back off highs of 113-30, with the corrective bounce next opening resistance at 114-31+ (38.2% retrace of the Aug 2 – Sep 28 bear leg).
- Tomorrow’s session likely sees focus on ISM services after the mfg miss along with final PMIs, ADP and lone Fedspeak from Bostic (’24 voter).
EGBs-GILTS CASH CLOSE: Long-End UK Sticks Out Again Amid Broader Rally
The Gilt long-end stuck out once again in an otherwise very positive session for European FI Tuesday, as Monday's rally extended.
- 30Y Gilt yields jumped over 4% for the first time since last Thursday, rising 18bp after today's BoE's long-dated Gilt purchase operation had zero takeup.
- Yields came off session lows set in the morning (Schatz finished 11bp higher vs the lows) but were down overall. The key driver was a continued downward repricing of central bank tightening expectations, with the latest catalyst the RBA's surprisingly small 25bp hike overnight.
- MNI's Europe Pi positioning indicator suggested significant short covering in bond futures Monday, and Tuesday may have seen more of the same.
- Risk assets rallied with the US dollar under pressure; helping periphery EGB spreads tighten.
Closing Yields / 10-Yr Periphery EGB Spreads To Germany:
- Germany: The 2-Yr yield is down 5bps at 1.57%, 5-Yr is down 6bps at 1.707%, 10-Yr is down 4.6bps at 1.871%, and 30-Yr is down 1.5bps at 1.907%.
- UK: The 2-Yr yield is down 13.3bps at 3.92%, 5-Yr is down 11.5bps at 4.111%, 10-Yr is down 8.9bps at 3.875%, and 30-Yr is up 15bps at 4.038%.
- Italian BTP spread down 2.2bps at 230.7bps / Greek down 6.9bps at 277.2bps
FOREX: Dollar Slide Extends as Rate Hike Pricing Fades
- The dollar slide extended Tuesday, putting the USD Index lower for the fifth consecutive session as rate hike expectations in the US faded. The moves follow further signs of weakness in the domestic labour market, as JOLTS data showed characteristics of a looser jobs market - supporting theories that the Fed could be approaching a pivot point.
- The main beneficiary of dollar weakness was the single currency, putting EUR/USD on course to erase the entirety of the late-September downtick. The real test for the pair will be the 1.0020 50-dma which, if pace is maintained, will be tested in the coming sessions.
- AUD remained among the poorest performers for the day, following the smaller-than-expected RBA rate hike overnight. EUR/AUD printed multi-month highs at 1.5359, narrowing the gap with key resistance at the early July highs of 1.5398.
- Focus Wednesday turns to the final services and composite PMI data from across Europe and North America.
- The US ISM Services index is also on the docket, with markets watching carefully for any repeat performance of Monday's manufacturing number, which belied particular weakness in the employment sub-component. ADP Employment Change data is also on the docket.
US: Job Market Slack Could Look Much Less "Unhealthy" By Early 2023
The August ratio of openings to unemployed (1.67) compares with 1.97 in July and the 1.99 peak in March, when the Fed started raising rates, and when Chair Powell remarked that the ratio marked an "unhealthy" job market.
- The one-month 0.3pp drop in the ratio is the biggest in the series history with the exceptions of March and April 2020. Whether the speed decline can continue is doubtful, but at this pace, the ratio would be back to pre-COVID levels (1.2) by October.
- Even declines at one-third of August's rate, by 0.1pp per month, would be enough to get the ratio closer to the 1.2 area by early 2023, and give the FOMC one less reason to tighten beyond what it's already signalled.

- The latest drop in the ratio wasn't without an increase in unemployment though, up 340k with the u/e rate up 0.2pts to 3.65% in August, but it still might be seen as a first step towards the Fed’s hope of being able to trim vacancies without unduly weighing on unemployment.
- The fact it’s only a first step is evidenced further by the private sector quits rate holding at 3.0%, down from highs of 3.3% but still notably higher than the 2.5% averaged in prior labour market peaks.
MARKET INSIGHT: CAD, Antipodean FX Underperformance & Household Indebtedness
- AUD, NZD and CAD underperform most other majors today, making relatively little inroad into broader USD weakness despite oil gaining strongly in the case of CAD and AUD.
- AUD weakness in particular stems from the dovish surprise from the RBA hiking 25bp vs the 50bp largely expected/priced, triggering a sizeable re-pricing lower of 2023 rate expectations, but that could start to be a sign of household indebtedness beginning to weigh on hiking expectations.
- It’s notable that these three countries see some of the highest household debt levels in the G10, with Canada and NZ ~100% GDP and Australia closer to 120% GDP [chart 1], which as fixes from post-pandemic purchases begin to come up for refinancing could increasingly weigh on households.
- Should a pivot away from the recent highs of terminal rates drive a wedge lower to Fed pricing, which is yet to be seen in 2Y2Y OIS [chart 2], it could increasingly weigh on these crosses.

STOCKS: S&P E-minis Sit Shy Of Next Resistance As Real Yield Decline Pauses
- ESZ2 hit session highs of 3802.5 following softer than expected JOLTS openings and has held close to it ever since with real yields moving off session lows.
- It hovers further below next resistance at the 20-day EMA of 3816.53 following an extension of the important short-term reversal after yesterday’s candle pattern was a bullish engulfing line.
- As has been the case for some time, US real yields continue to dominate, with the 10Y real is -7bps for -30bp over two days in a sharp reversal of a similarly sized climb late last week.
- SPX is up 2.7%, led by energy (+4.0%), financials (+3.5%) and materials (+3.5%) with consumer staples (+1.1%) and real estate (+1.4%) lagging. NASDAQ sees modest outperformance with +3.1%.
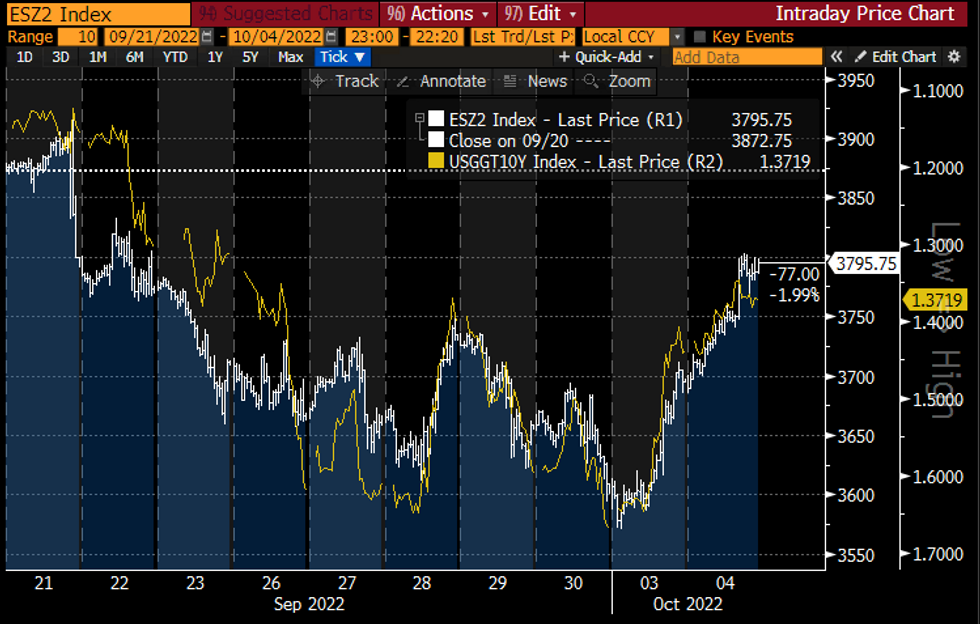 ESZ2 (white) and inverted US 10Y real yield (yellow)Source: Bloomberg
COMMODITIES: Crude Oil Surges With OPEC+ Cuts Eyed, Supportive Backdrop
- Further USD weakness and modestly lower Tsy yields again provide a supportive backdrop for commodities, further boosted in the case of oil by OPEC+ delegates reporting consideration of a production cut as much as 2mbpd at tomorrow’s meeting.
- At the margin, the Biden administration says there is no consideration of new SPR releases whilst the WSJ reports that the EU is likely to approve a G-7 cap on Russia oil in two steps with final approval holding off until the rest of the G-7 is ready.
- WTI settles +3.5% at $86.52 for a three-week high and +8.8% over two sessions for the largest two day gain since Apr 13. It moves close to testing resistance at the 50-day EMA after which would lie $92.26 (Aug 30 high).
- Brent is +3.3% at $91.79, having earlier probed above resistance at the 50-day EMA of $92.11.
- Gold is +1.5% at $1725.2, through resistance at the 50-day EMA of $1713.8 and establishing a short-term bull cycle having earlier first traded above trendline resistance. Next resistance is eyed at the key level of $1735.1 (Sep 12).
Expiries for Oct5 NY cut 1000ET (Source DTCC)
- EUR/USD: $0.9800(E2.0bln), $0.9930-36(E1.2bln)
- USD/JPY: Y143.85-05($798mln)
- EUR/JPY: Y142.20(E809mln)
- AUD/USD: $0.6650(A$629mln)
- USD/CAD: C$1.3800($585mln)
| Date | GMT/Local | Impact | Flag | Country | Event |
| 05/10/2022 | 0030/0930 | ** |  | JP | IHS Markit Final Japan Services PMI |
| 05/10/2022 | 0100/1400 | *** |  | NZ | RBNZ official cash rate decision |
| 05/10/2022 | 0600/0800 | ** |  | DE | Trade Balance |
| 05/10/2022 | 0645/0845 | * |  | FR | Industrial Production |
| 05/10/2022 | 0715/0915 | ** |  | ES | IHS Markit Services PMI (f) |
| 05/10/2022 | 0745/0945 | ** |  | IT | IHS Markit Services PMI (f) |
| 05/10/2022 | 0750/0950 | ** | | FR | IHS Markit Services PMI (f) |
| 05/10/2022 | 0755/0955 | ** | | DE | IHS Markit Services PMI (f) |
| 05/10/2022 | 0800/1000 | ** |  | EU | IHS Markit Services PMI (f) |
| 05/10/2022 | 0830/0930 | ** |  | UK | IHS Markit/CIPS Services PMI (Final) |
| 05/10/2022 | 0900/1000 | ** | | UK | Gilt Outright Auction Result |
| 05/10/2022 | 1100/0700 | ** |  | US | MBA Weekly Applications Index |
| 05/10/2022 | 1215/0815 | *** | | US | ADP Employment Report |
| 05/10/2022 | 1230/0830 | * |  | CA | Building Permits |
| 05/10/2022 | 1230/0830 | ** | | US | Trade Balance |
| 05/10/2022 | 1345/0945 | *** | | US | IHS Markit Services Index (final) |
| 05/10/2022 | 1400/1000 | *** | | US | ISM Non-Manufacturing Index |
| 05/10/2022 | 1430/1030 | ** | | US | DOE weekly crude oil stocks |
| 05/10/2022 | 2000/1600 | | US | Atlanta Fed's Raphael Bostic |
Why MNI
MNI is the leading provider
of intelligence and analysis on the Global Fixed Income, Foreign Exchange and Energy markets. We use an innovative combination of real-time analysis, deep fundamental research and journalism to provide unique and actionable insights for traders and investors. Our "All signal, no noise" approach drives an intelligence service that is succinct and timely, which is highly regarded by our time constrained client base.Our Head Office is in London with offices in Chicago, Washington and Beijing, as well as an on the ground presence in other major financial centres across the world.
We are facing technical issues, please contact our team.
ok
Your request was sent sucessfully! Our team will contact you soon.
ok