
Why MNI
MNI is the leading provider
of intelligence and analysis on the Global Fixed Income, Foreign Exchange and Energy markets. We use an innovative combination of real-time analysis, deep fundamental research and journalism to provide unique and actionable insights for traders and investors. Our "All signal, no noise" approach drives an intelligence service that is succinct and timely, which is highly regarded by our time constrained client base.Our Head Office is in London with offices in Chicago, Washington and Beijing, as well as an on the ground presence in other major financial centres across the world.
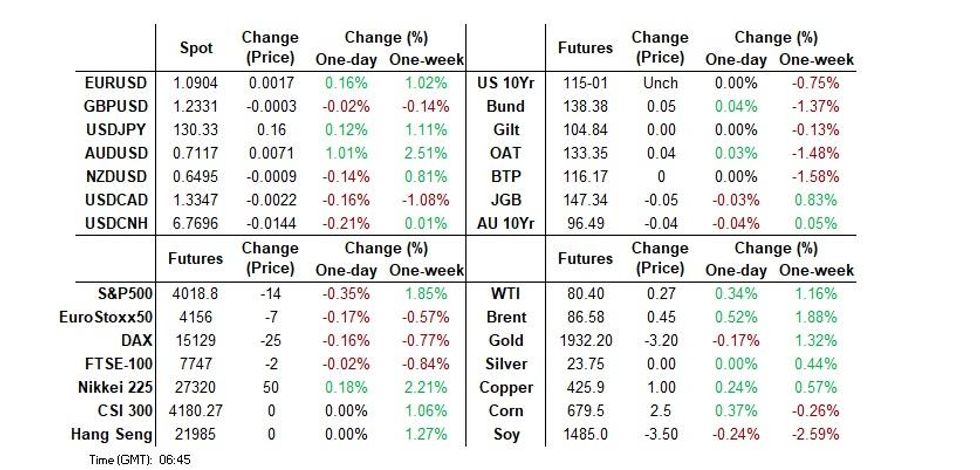
- Conflicting fortunes for the Antipodean currencies as NZ CPI misses RBNZ expectations, while Australian CPI provides notable beats vs. wider expectations. Subsequent repricing of central bank rate paths leaves those currenices at opposite ends of the G10 FX perfromance table.
- Wider headline flow remains limited in Asia, owing to the LNY holiday in Hong Kong & China.
- Looking ahead, the BoC decision is due, while the London morning will see the latest UK PPI data & German IFO survey cross.
US TSYS: Marginally Cheaper, Cross-Market Flows Dominate
TYH3 deals at 115-00, -0-01, a touch off the base of its 0-06+ range on volume of ~79K.
- Cash Tsys sit 0.5-1.5bp cheaper across the major benchmarks.
- An early richening was driven by a bid in Antipodean rates, as New Zealand CPI was softer than RBNZ projections, in both headline and non-tradeable terms. An early, modest bid in JGBs also assisted.
- Cheapening in ACGBs, in lieu of stronger than expected Australia CPI data then weighed on Tsys, unwinding the early bid.
- Liquidity remained impaired by the ongoing LNY holidays in Asia, with little follow through in Tsys when compared to Antipodean rates.
- UK PPI data & the German IFO survey headline the European docket. Further out matters north of the border will garner attention with the latest Bank of Canada monetary policy decision due today. On the supply side we have the latest 5-Year Tsy auction.
JGBS: Futures Essentially Flat, 7- To 20-Year Zone Weakest Area On Curve
JGBs lacked anything in the way of meaningful direction during Wednesday’s Tokyo session. The major cash JGB benchmarks are 2bp cheaper to 2bp richer across the curve, with the 7- to 20-Year zone providing the weakest point on the curve throughout the session.
- Meanwhile, JGB futures held to a relatively confined range, particularly by recent standards, last dealing -1 ahead of the close.
- The swap curve twist flattened, with 30+-Year rates nudging lower, while the 7- to 20-Year zone once again saw the biggest move higher, akin to yields on the JGB curve.
- Domestic headline flow was particularly light, with PM Kishida reaffirming recent rhetoric re: the BoJ, stressing its independence, while remaining non-committal re: the potential for a tweak to the government-BoJ accord on inflation.
- Elsewhere, ministerial rhetoric touched on fiscal matters re: childcare provisions, but there was little there for markets to latch onto.
- Offer/cover ratios remained in check across the latest round of BoJ Rinban operations (covering 1- to 25-Year JGBs), sitting at 1.5-2.6x.
- The lack of domestic catalysts left swings in wider core global FI markets at the fore.
- Looking ahead, 40-Year JGB supply headlines tomorrow’s domestic docket.
AUSSIE BONDS: Two-Way On Regional CPI, RBA Dated OIS Pushes Firmer In Lieu Of Local Prints
Early Sydney trade was two-way, with the early richening inspired by an overnight bid in core global FI markets and NZ CPI data that was a little softer than the RBNZ expected.
- Firmer than expected (vs. newswire surveys) domestic CPI data then applied notable pressure, leaving YM -9.0 & XM -4.0 at the close, a touch above their respective session lows. The major cash ACGBs finished 2-10bp cheaper as the wider curve bear flattened. ACGB widened vs. global peers post-CPI.
- The headline CPI metric was a touch below the RBA’s forecast +8% Y/Y, although the trimmed mean metric topped the Bank’s +6.5% Y/Y forecast. Inflation continues to run at particularly elevated levels for this stage in the RBA hiking cycle.
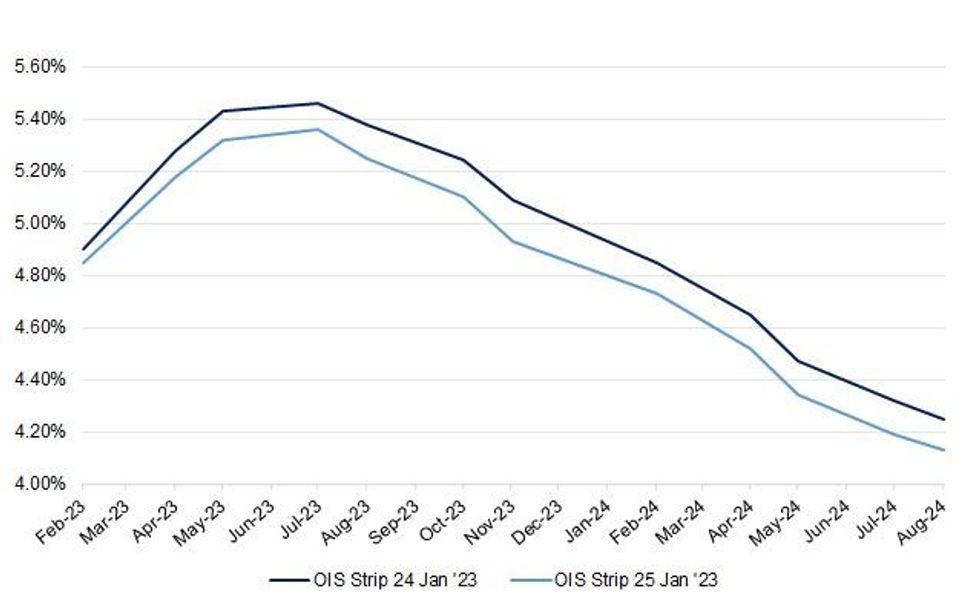
- Bills finished 13-19bp cheaper through the reds, in what was a volatile day for Aussie STIRs. RBA dated OIS now shows ~23bp of tightening for next month’s meeting, almost fully pricing a 25bp hike post-CPI. Meanwhile, terminal cash rate pricing is showing just above 3.75% late in the day after printing below 3.50% in the wake of the NZ CPI release (see chart below for a visual on intraday swings). There hasn’t been any meaningful RBA call changes from the sell-side post CPI.
- Australian markets are closed on Thursday as the country observes the Australia Day holiday.
Fig. 1: Intraday Moves In RBA Dated OIS
Source: MNI - Market News/Bloomberg
AUSTRALIA: CPI Data Signal Growing Domestic Price Pressures, RBA To Hike
Australia’s Q4 and December CPI data printed significantly stronger than expected and showed that while Q4 was under the RBA’s 8% forecast, the final month of the year was higher. The details show growing domestically-driven inflation with the more global components stabilising. This data is concerning and has all but confirmed a February rate hike and probably a March one too (the February 22 WPI will be key here).
- Q4 CPI rose 1.9% q/q and 7.8% y/y, the highest since 1990, after 1.8% and 7.3% in Q3 driven by holiday travel and electricity (+8.6%). The ABS noted that this was the fourth consecutive quarter to record an increase higher than any seen since the GST was introduced in 2000. December CPI surged to 8.4% from 7.3% driven by housing, food and recreation. Inflation was still rising going into the new year.
- The trimmed mean rose at a slightly slower quarterly pace of 1.7% q/q but increased to 6.9% y/y from 6.1%, a new series high and above the RBA’s forecast. The monthly series has been suspended but the CPI ex volatile items surged to 8.1% y/y in December from 6.7%.
- Services inflation rose 5.5% y/y from 4.1%, the highest since 2008. This is an indicator of domestic-price pressures, which appear to have gathered momentum. Non-tradeables, another domestic measure, rose 2.1% q/q and 7.4% y/y from 6.5% in Q3. Non-tradeables was steady at 8.7% y/y.
- Discretionary inflation reached a new high of 7.1%, while non-discretionary was steady at 8.4%, which is likely to weigh on consumption going forward.

Source: MNI - Market News/Refinitiv/ABS

Source: MNI - Market News/Refinitiv/ABS
AUSTRALIA: Underlying Price Pressures Up Sharply – No Matter How Measured
Today’s CPI data showed that not only is headline inflation continuing to rise but that domestically-driven price pressures are increasing. There are a number of different ways to measure underlying inflation – trimmed mean, excluding volatile items such as food and energy, the median. We have calculated another version using principal components analysis (PCA) (based on Bank of Canada research).
- PCA is useful for a large number of variables, as it finds common patterns that explain most of the variance in the data. In this case, it extracts the common movement in prices and thus creates a measure that reflects underlying developments in inflation and not sector-specific shocks.
- The chart below shows PCA CPI against other inflation measures. It is less volatile, with a standard deviation below that of the trimmed mean. After running ahead of the trimmed mean from 2019 until mid-2021, it is now well below at 4.6% compared to 6.9% y/y. While this may be suggesting that underlying inflation is not as high as other indicators suggest, the PCA CPI is also indicating that pressures are rising sharply.

Source: MNI - Market News/Refinitiv/ABS
AUSTRALIA: MNI Insight: Australian Macro Chart Pack- RBA To Tighten Further, AUD Still Undervalued
- Model estimates suggest the RBA still has more work to do, but market pricing indicates the RBA cash rate is close to a peak (Slides 4-5). Markets expect the Fed rate to remain above the RBA cash rate for sometime (Slide 6) but the Fed is likely to be a bigger driver of this trend in 2023.
- Inflation & wage dynamics (Slides 7-10) will determine how much further the RBA tightens. The labour market remains tight (Slides 11-13) but employment growth is expected to cool in 2023. Housing & the flow on effect to consumer spending (14-18) are other key watch points for the RBA, particularly in terms of the cumulative impact of tightening through 2022. The RBA and consensus (Slides 19-21) expect weaker growth and inflation trends through 2023.
- The outlook for trade and the terms of trade is mixed in 2023 (Slides 22-24). China’s pivot away from CZS should be supportive (Slide 25), but expected weaker conditions in the rest of the world are a headwind (Slide 26). A Fed pivot should weigh on the USD all else equal and be a A$ positive (Slide 27), while simple valuation metrics continue to suggest the currency is undervalued (Slide 28).
- Global recession risks (Slide 29) can’t be discounted though, historically a meaningful AUD headwind. Correlations for AUD/USD remain strongest with commodity prices (particularly metals) and global equity trends (Slide 30).
- See the full chart pack here:
NZGBS: Firmer Post-CPI, Although Curve Steepens As Day Wears On
Q4 CPI (in both headline and the underlying non-tradables form) undershot RBNZ expectations, allowing NZGBs to add to the early richening that was derived from moves in wider core global FI markets. The RBNZ’s own sectoral factor model inflation print ticked higher.
- All 3 of the Y/Y metrics outlined above remain comfortably above the RBNZ’s inflation target.
- Firmer than expected Australian inflation crossed in the time between the domestic inflation prints, which introduced some trans-Tasman impetus and meant that it wasn’t a one-way session, with a steepening bias developing on the curve.
- The major cash NZGB benchmarks finished. Little changed to 7bp richer, with the longer end finishing over 10bp off richest levels.
- Swap rates were 2-13bp lower, also steepening, with 2-Year swap rates hovering just above YtD lows.
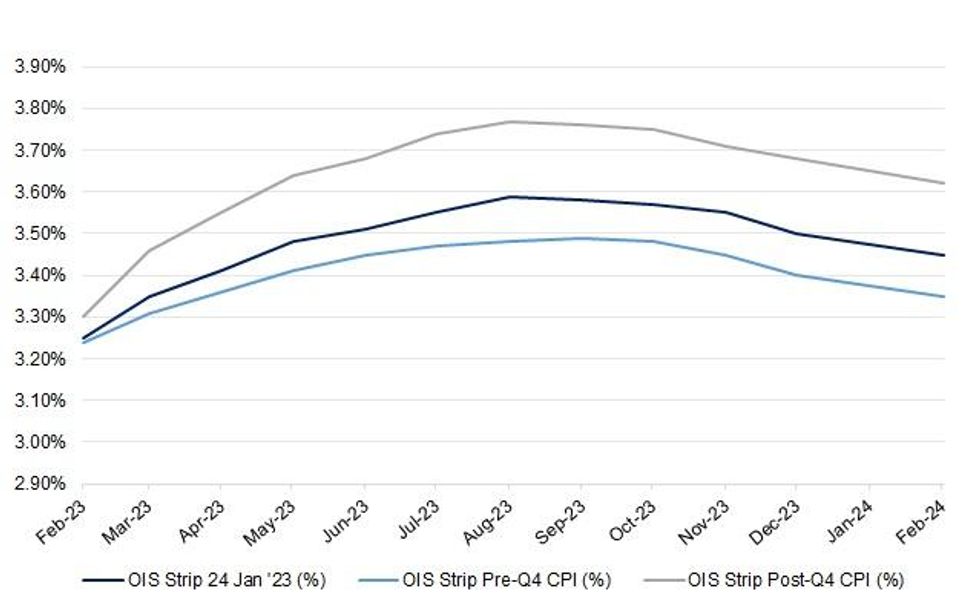
- RBNZ dated OIS initially shifted lower on NZ CPI data, before pulling off session lows in the wake of the Australian data (see the chart below for the intraday change observed on the strip).
- When it comes to the “Big 4,” ANZ & Westpac now look for a 50bp OCR hike next month (from 75bp prev.), while ASB & BNZ still look for a 75bp step (they acknowledge the chance of a 50bp move). The OIS strip prices in 60bp of tightening for next month’s meeting.
- Looking ahead, tomorrow’s local docket is headlined by the weekly NZGB auctions, covering NZGB-27, -33 & -51.
Fig. 1: Change In RBNZ Dated OIS Strip Around NZ Q4 CPI Data
Source: MNI - Market News/Bloomberg
NEW ZEALAND: Price Pressures Peaking, Smaller RBNZ Hike In February?
The good news in the NZ Q4 CPI report was the lower-than-expected rise in the domestically-driven non-tradeables component. It looks like inflation, including the domestic component, is rolling over. This is likely to drive a discussion for slowing the pace of RBNZ tightening and may even be enough to result in a 50bp move rather than 75bp at the February 22 meeting. An easing of wage and labour market pressures in the data published on February 1 will be key for an RBNZ pivot.
- Headline CPI moderated to 1.4% q/q from 2% but was stable at 7.2% y/y, slightly higher than expected, and appears to have peaked. Housing and household utilities were the largest contributor to headline inflation in Q4 with the price for building a new house up 14% y/y. Food was the next largest contributor followed by transport.
- The non-tradeable CPI surprised to the downside rising 1.5% q/q after 2% in Q3 and was stable at 6.6% y/y. Higher building costs are driving inflation in this domestic component.
- Tradeable CPI rose a higher-than-expected 1.4% q/q, due to international airfares, but down from Q3’s 2.2% leaving it up 8.2% y/y from 8.1%.
- Goods prices rose 1.1% q/q and 7.9% y/y down from 8.4% last quarter. Services prices rose 2% q/q and 6% y/y, up from Q3’s 5.1%. The 30% trimmed mean rose 1.2% q/q after a peak of 1.7% in Q2.

Source: MNI - Market News/Refinitiv
FOREX: A$ Dominates Post CPI Beat
USD indices are slightly lower, but the main story today has been the AUD surge, with AUD/USD breaching 0.7100 (+0.80% for the session), and strongly outperforming on crosses. This came after the stronger than expected domestic inflation data.
- The stronger inflation data, which was uniformly above market expectations, has pushed market pricing to a 25bps hike for the February meeting. One sell-side house reportedly sees risks of a 50bps move. Yield differentials have swung back in AUD's favor, the 2yr spread to -1.07bp, +15bps for the session. A$ bulls will eye August 11 2022 highs at 0.7137.
- AUD/NZD is up around 1%, last near 1.0940, meeting resistance close to the simple 100-day MA (1.0956).
- NZ inflation came in below RBNZ expectations, which has worked against the NZD and yield momentum for the currency. NZD/USD fell to 0.6467, but dips have been supported, last around 0.6485/90.
- US equity futures are lower, led by weakness in the tech space, but this hasn't impact sentiment a great deal today. USD/JPY is slightly higher, last around 130.50. Kishida came across the wires with a number of headlines related to the BoJ but this hasn't impact sentiment. The PM stated specific monetary tools are for the BoJ to decide.
- EUR/USD is around 1.0900 currently, slightly up on NY closing levels.
- Looking ahead, the BoC decision is due, while in Germany the IFO prints.
MNI BOC Preview - January 2023: Watching Guidance For An Expected Final Hike
EXECUTIVE SUMMARY
- The BoC is expected to opt for a final 25bp hike to 4.5%. The 25bp hike is almost fully priced but the Bank had form last year at surprising markets, and five analysts expect no change.
- A recent easing in financial conditions could see statement language err on the moderately hawkish side.
- Core inflation and labour data have come in stronger than expected and near-term inflation expectations pushed higher but medium- and longer-term expectations have cooled somewhat and a majority of both firms and consumers expect a recession this year.
- PLEASE FIND THE FULL REPORT HERE:BOCPreviewJan2023.pdf

FX OPTIONS: Expiries for Jan25 NY cut 1000ET (Source DTCC)
- EUR/USD: $1.1975(E556mln), $1.2000(E563mln), $1.2050-70(E658mln), $1.2090-1.2100(E519mln), $1.2230-40(E1.2bln-EUR puts), $1.2245-55(E936mln)
- USD/JPY: Y103.25-35($601mln-USD puts)
- GBP/USD: $1.3370-80(Gbp689mln)
- AUD/USD: $0.7550(A$2.8bln), $0.7650(A$1.4bln), $0.7690-0.7700(A$700mln), $0.7750(A$768mln), $0.7800(A$711mln)
- USD/CAD: C$1.2700($603mln-USD puts), C$1.2900($536mln-USD puts)
- USD/CNY: Cny6.5700($1bln)
- USD/MXN: Mxn19.50($550mln), Mxn20.00-01($543mln)
ASIA FX: SGD Outperforms On Sticky Core Inflation, BoT Still To Come
USD/Asia pairs are mixed, with China and HK holidays still likely impacting liquidity to a degree. SGD has outperformed post domestic inflation data. Still to come is the BoT decision, with +25bps expected. Tomorrow, South Korea Q4 GDP prints, along with consumer confidence. Philippines Q4 GDP is also out, along with Singapore IP figures.
- USD/SGD has tracked lower, back to 1.3155, -0.30% for the session. We sit slightly higher now. SGD FX outperformed and saw fresh downside post the CPI prints for Dec. Headline was 6.5% y/y, below 6.6% expected, but core remained unchanged at 5.1% y/y (5.0% expected). The SGD NEER, per Goldman Sachs estimates, got close to Nov highs from last year, around 136.00, but has drifted a little lower since.
- 1 month USD/KRW hasn't drifted too far from the 1231/33 region. Onshore equities are higher, while net equity flows have surged close to $500mn. However, this largely reflects catch up from the previous few days where onshore markets were closed.
- USD/THB has firmed slightly, last around 32.82, with an early move towards 32.70 finding USD support. We may continue to consolidate ahead of the BoT decision later, where +25bps is expected (see our full preview here). In terms of ranges, the Monday YTD low came in around 32.57, while moves above 33.00 drew selling interest through mid-January.
- USD/PHP spiked higher at the open, getting close to 54.78, but has drifted lower since. The pair was last around 54.64, still +0.35% above yesterday's closing level. The pair remains very much within recent ranges, with breaks sub 54.50 unable to be sustained in recent weeks, but moves up to 55.00 should still draw selling interest. Q4 GDP prints tomorrow, the consensus looks for a slowdown to 6.6% y/y from 7.6%, but Finance Secretary Diokno said at the start of the week that the economy likely grew more than 7.5% in Q4 from a year earlier.
- USD/IDR has rebounded, last near 14965, +0.50% for the session. Technical factors could be in play, given the sharp correction lower in recent days flashed oversold conditions on some indicators. USD/INR was lower in the first of trade, but a move sub 81.50 generated USD demand, the pair last at 81.65.
MNI Bank Of Thailand Preview - January 2023: Gradual Normalisation To Continue
EXECUTIVE SUMMARY
- The Bank of Thailand (BoT) is widely expected to hike rates 25bp to 1.5% at its January 25 meeting bringing the cumulative tightening this cycle to 100bp, well below most other Asian central banks.
- The January move is likely to be driven by inflation rising further in December and remaining above the upper end of the 1-3% target band, significantly negative real rates and the growth and tourism recovery. It will also stabilise the rate differential with the US, assuming the Fed hikes 25bp on February 1, thus supporting the THB. These reasons are likely to result in a further hike at the March BoT meeting.
- Expected tourist arrivals have been revised up sharply following the reopening of China and the resultant increase in consumption poses an upside risk to Thai inflation.
- For the full piece, see here:BoT Preview - January 2023.pdf
EQUITIES: Negative US Tech Lead Doesn't Deter Asia Sentiment
Regional equities are mostly higher, despite an indifferent lead from US markets on Tuesday and negative trends in futures during today's session. Markets re-opening from the LNY break, like South Korea and Singapore have rallied, playing catch up with the firmer trend through Friday/Monday in offshore markets.
- US futures are down close to 0.4% for the S&P, near -0.7% for the Nasdaq, although we are away from worst levels. A weak revenue update from Microsoft, particularly in its could business, has weighed today.
- Still, the Nikkei 225 is +0.40% at this stage, moving above levels that prevailed pre BoJ in mid December last year.
- The Kospi is +1.33%, with offshore investors adding $490.1mn to local equities, in the first session of trading since last Friday. The Straits Times in Singapore is +1.80% at this stage.
- The ASX 200 is down slightly at this stage, while Indian indices have fallen 0.60/0.70% in the first part of trade, as weakness in the Adani Group weighs.
GOLD: Prices Lower On Higher US Yields But Trend Bullish
Bullion fell during Tuesday’s NY session on the better-than-expected PMIs but then bounced back after the weak Richmond Fed Index. It ended the day up 0.3% but during the APAC session it has taken a step down to $1931.45/oz (-0.3%) on the back of higher Treasury yields. Today it reached a high of $1937.35 and a low of $1929.03. The USD is trading sideways.
- Gold reached a new cycle high of $1942.54 on Tuesday and moving average studies are bullish. Firm resistance is now at $1963.70 (76.4% retracement of Mar-Sep 2022 bear leg).
- Bullion is currently up 5.9% so far this month on growing US recession fears and expected slowing of Fed tightening.
- Later the Bank of Canada is expected to announce a 25bp rate hike. With the Fed media blackout currently in place and no data on the calendar, it is a quiet schedule in the US.
OIL: Crude Consolidates After Sharp Fall
After a sharp fall on Tuesday, oil prices are slightly higher during the APAC session. WTI is up 0.2% to $80.30/bbl after reaching a low of $80.08 and a high of $80.66. Brent is flat to around $86.40 after a high of $86.81 and low of $86.27. Again recession fears are being balanced by an expected increase in Chinese demand. The USD is flat.
- On the upside, Brent failed to break through resistance at $89.18 on Tuesday, the December 1 high.
- Representatives from OPEC members have said that they expect the advisory committee to recommend that output quotas are unchanged at next week’s meeting. (bbg)
- API data showed another build in US crude stocks. They rose 3.4mn barrels in the latest week and gasoline inventories rose 0.6mn but distillate fell 1.9mn. The EIA data is out later today.
- Today the Bank of Canada is expected to announce a 25bp rate hike. With the Fed media blackout currently in place and no data on the calendar, it is a quiet schedule in the US. The German IFO survey for January prints.
UP TODAY (TIMES GMT/LOCAL)
| Date | GMT/Local | Impact | Flag | Country | Event |
| 25/01/2023 | 0700/0700 | *** |  | UK | Producer Prices |
| 25/01/2023 | 0700/0800 | ** |  | SE | PPI |
| 25/01/2023 | 0700/1500 | ** |  | CN | MNI China Liquidity Suvey |
| 25/01/2023 | 0800/0900 | ** |  | ES | PPI |
| 25/01/2023 | 0900/1000 | *** |  | DE | IFO Business Climate Index |
| 25/01/2023 | 1200/0700 | ** |  | US | MBA Weekly Applications Index |
| 25/01/2023 | 1400/1500 | ** |  | BE | BNB Business Sentiment |
| 25/01/2023 | 1500/1000 | *** |  | CA | Bank of Canada Policy Decision |
| 25/01/2023 | 1500/1000 | | CA | Bank of Canada Monetary Policy Report | |
| 25/01/2023 | 1530/1030 | ** | | US | DOE weekly crude oil stocks |
| 25/01/2023 | 1600/1100 | | CA | Bank of Canada Governor press conference | |
| 25/01/2023 | 1630/1130 | ** | | US | US Treasury Auction Result for 2 Year Floating Rate Note |
| 25/01/2023 | 1800/1300 | * | | US | US Treasury Auction Result for 5 Year Note |
Why MNI
MNI is the leading provider
of intelligence and analysis on the Global Fixed Income, Foreign Exchange and Energy markets. We use an innovative combination of real-time analysis, deep fundamental research and journalism to provide unique and actionable insights for traders and investors. Our "All signal, no noise" approach drives an intelligence service that is succinct and timely, which is highly regarded by our time constrained client base.Our Head Office is in London with offices in Chicago, Washington and Beijing, as well as an on the ground presence in other major financial centres across the world.