
Why MNI
MNI is the leading provider
of intelligence and analysis on the Global Fixed Income, Foreign Exchange and Energy markets. We use an innovative combination of real-time analysis, deep fundamental research and journalism to provide unique and actionable insights for traders and investors. Our "All signal, no noise" approach drives an intelligence service that is succinct and timely, which is highly regarded by our time constrained client base.Our Head Office is in London with offices in Chicago, Washington and Beijing, as well as an on the ground presence in other major financial centres across the world.
Highlights:
- PBOC rate cut countered by sour economic data
- US Dollar continues to chew through post-CPI losses
- Empire manufacturing takes focus going forward

US TSYS SUMMARY: Mild Twist Flattening As Digest Weak China Data, PBOC Easing
- Cash Tsys have seen a modest twist flattening with the pivot beyond, 7s with the long end rallying in what could be carry over from softer than expected China data this morning, compounding Friday’s aggregate financing miss and prompting PBOC easing.
- Little impact from weekend headlines that 5 U.S. lawmakers travelling to Taiwan less than 2 weeks after Pelosi’s visit, whilst front end yields meanwhile track last week’s recovery in the Fed’s terminal rate to pre-US CPI levels whilst also leaning marginally closer towards a 75bp than 50bp hike in Sept.
- 2YY +0.7bps at 3.249%, 5YY +0.2bps at 2.958%, 10YY -0.4bps at 2.828%, 30YY -0.5bps at 3.102%.
- TYU2 trades 4+ ticks higher at 119-13 with relatively tight ranges and towards the mid-to-lower end of last week’s wide ranges. It’s amidst typically low seasonal volumes, exacerbated by widespread observance of the Assumption Day holiday in Europe.
- Data: The Empire Mfg (0830ET) and NAHB (1000ET) indexes headline a light US docket, although also see TIC flows at 1600ET.
- Bill issuance: US Tsy $54B 13w, $42B 26W bill auctions
STIR FUTURES: Fed Path Looks Through PBOC Easing/Weak Data
- Fed Funds implied hikes so far sit almost unchanged from late Fri levels despite PBOC easing and weak China data, if anything firming for immediate meetings.
- There is 64bp priced for Sep 21 on the way to a cumulative 120bp to 3.52% by year-end and 133bp to a peak of 3.66% at Mar’23. Inversion was trimmed to circa 45bp of cuts to end’23.
- Despite last week’s CPI miss, the payrolls beat still sets the tone when it comes to the terminal, with Fedspeak of potential higher for longer helping lift 2H23 rate expectations further – see chart.
- No Fedspeak scheduled today.

EUROPE OPTION FLOW SUMMARY:
Eurozone:
OEV2 126/125.5ps vs 128/128.75cs, bought the ps for flat in 2k
ERU2 99.12/98.87ps, bought for 1.75 for 5k
0RU2 98.25/97.875/97.75 broken p fly, bought for 8 in 10k
SX5E (fri) 3800/3900cs trades 15.00 in 1k
SX5E (fri) 3400p traded 0.70 and 0.90 in 8.1k
SX5E (fri) 3800/3700ps traded 33.5in 1k
SX5E (fri) 3800^ trades 59.00 in 7k vs 7k at 3800
Dax (fri) 13,850^ traded 211.5 in 1k
CHINA: Disappointing China Data May Weigh On Broader Risk Rebound
Today's disappointing China activity data, which was weaker across the board, casts somewhat of a shadow over the broader risk outlook, at least if 2022 correlations continue to hold firm.
- The first chart below plots the Citi China EASI against global equities. The correlation has been stronger between the two series in 2022. This is likely to reflect the concern around the broader global growth backdrop, particularly as monetary policy started to normalize in major developed economies.
- Today's data outcomes in China are likely to weigh on the EASI levels, which has generally been on an uptrend in recent months. On-going covid related restrictions, with current case numbers at multi-month highs, which may continue to weigh on the domestic demand recovery.
Fig 1: Citi China EASI & Global Equities
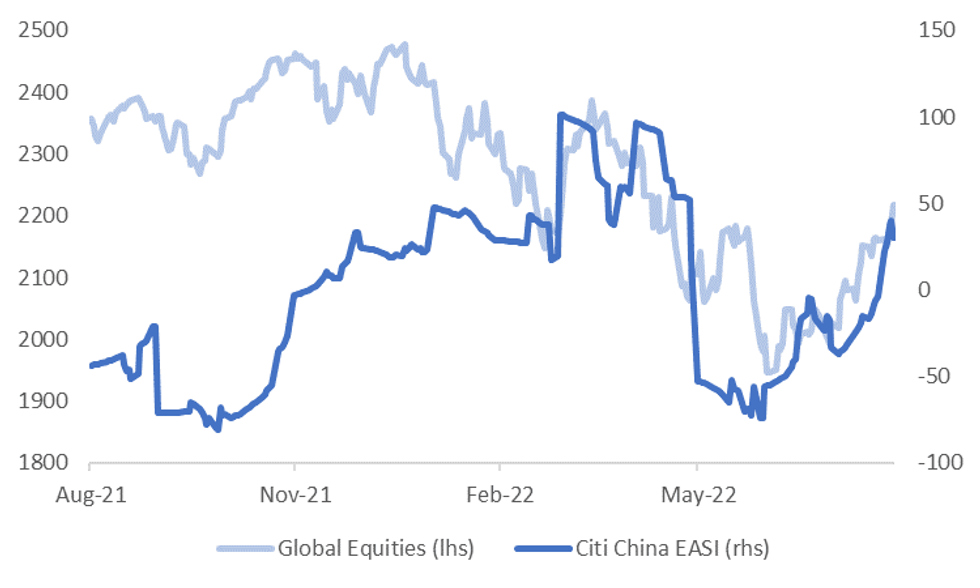 Source: Citi, MNI/Market News/Bloomberg
- The table below presents the correlations for Citi China EASI against global equities and other key macro variables for 2022. For comparison’s sake with have included the equivalent correlations with the US and EU EASIs.
- The China EASI correlation is the same as the US EASI with respect to global equities and slightly higher compared to the EU EASI. Note in 2021 the China EASI correlation with global equities was -35%.
- In terms of other macro variables, the China EASI has had a flat correlation with global commodities, which perhaps owes to supply issues being a greater driver than the demand backdrop.
- The correlation with base metals is firmer though and not surprisingly inversely related with the USD. Interestingly though, the same applies for the US EASI. The EU EASI has the largest negative correlation with broader USD FX performance.
- In any event, renewed concerns around the China growth backdrop are something to be mindful of in terms of expecting a continuation of the risk rally that has unfolded in recent months.
Table 1: Citi EASI Correlations With Major Macro Variables
| Country EASI | |||
| Macro Indicator | China | US | EU |
| Global Equities | 0.65 | 0.64 | 0.54 |
| Global Commodities | -0.04 | 0.27 | 0.16 |
| Base Metals | 0.61 | 0.61 | 0.74 |
| DXY | -0.51 | -0.58 | -0.78 |
| USD NEER | -0.55 | -0.64 | -0.78 |
Source: Citi, MNI/Market News/Bloomberg
CHINA: Will The Rebound In China ‘Liquidity’ Matter For Asset Prices This Year?
Executive summary:
- Even though aggregate financing rose less than expected in July, China ‘liquidity’ metric, computed as the annual change in China Total Social Financing (TSF), continues to rise, now up 3tr USD in the past year.
- Hence, Investors have been questioning if the rise China ‘liquidity’ this time will be enough to stimulate both domestic and international asset prices.
Link to full publication:
MNI MARKETS ANALYSIS - China Liquidity.pdf
The PBoC reported this morning that aggregate financing rose by 756bn CNY in June (figure 1, left frame), significantly below expectations of 1.35tr CNY with new yuan loans rising by 679bn CNY (1.125tr CNY exp.). However, China ‘liquidity’ metric, computed as the annual change in China Total Social Financing (TSF), continues to rise, now up 3tr USD in the past year (figure 1, right frame).
Figure 1
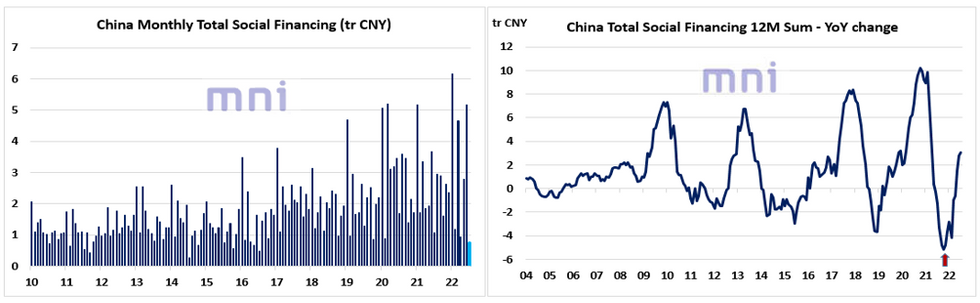
Source: Bloomberg/MNI.
FOREX: Sour China Data Undermines Commodity-Tied Currencies
- The greenback continues to bounce off the post-CPI lows, with the USD Index close to 1.5% off last week's lows. A sour set of economic data from China has prompted a wave of risk-off across currency markets. The price action has favoured the USD, JPY and CHF, with AUD and NZD the biggest losers in G10.
- Both industrial production and retail sales data from China fell below expectations for June, with retail sales now in negative territory on a YTD basis. In response, the Chinese central bank cut both the 7-day reverse repo and the 1-year MLF rate by 10bps apiece, looking to arrest the slowing economy.
- In response, the CNH is sliding, putting USD/CNH north of 6.78 and within range of next resistance at the 6.7954 August high. A clean break above here would be the highest level for the pair since early May.
- Commodity- and high-beta currencies are sliding alongside the weakness in Chinese economic data, putting AUD/USD below 0.7050 and within range of 0.7030 support (23.6% retracement for the Jul - Aug upleg). CAD is exhibiting similar price action, with USD/CAD now just shy of the 1.2888 50-dma.
- US Empire manufacturing crosses later today, with the index expected to slow to 5.0 from 11.1 prior. Canadian manufacturing sales also crosses as well as the NAHB housing market index. There are no notable central bank speakers due.
FX OPTIONS: Expiries for Aug15 NY cut 1000ET (Source DTCC)
- USD/JPY: Y133.80-00($950mln), Y135.35($660mln)
- EUR/GBP: Gbp0.8535-50(E1.2bln)
- USD/CAD: C$1.2950($655mln)
- USD/CNY: Cny6.75($656mln)
Price Signal Summary – Equities reinforce bullish S/T condition
- S&P E-Minis traded higher once again Friday. The climb reinforces short-term bullish conditions and the extension maintains the positive price sequence of higher highs and higher lows. EUROSTOXX 50 traded higher Friday to confirm a resumption of the current uptrend. The move higher maintains the bullish price sequence of higher highs and higher lows and attention is on resistance at 3840.00, the Jun 6 high.
- EURUSD remains below last week’s 1.0368 high. The pullback highlights - for now - a failure to deliver a clear break of the bear channel resistance, currently at 1.0326. AUDUSD is holding on to the bulk of its recent gains. Last week’s break of 0.7047, Aug 1 high, confirmed a resumption of the uptrend that started Jul 14 and sets the scene for an extension. EURJPY remains below last Wednesday’s high of 138.40 and below the 50-day EMA. The recovery from 133.40, Aug 2 low, is likely a correction.
- Gold maintains a firmer tone following last week’s climb above trendline resistance at $1794.6. The trendline is drawn from the Mar 8 high and the break represents an important technical breach plus highlights a stronger reversal of the 5-month downtrend. WTI futures traded higher late last week and cleared $92.65, the Aug 9 high. The 20-day EMA has also been pierced and this does suggest scope for a stronger near-term bounce, potentially towards the 50-day EMA, at $97.74.
- Bund futures traded lower again Friday. The current retracement is still considered corrective and the short-term trend direction remains up. Moving average studies are in a bull mode condition and the bullish price sequence of higher highs and higher lows is intact. Gilt futures traded lower again Friday. Last week’s extension lower has resulted in a break of trendline support drawn from the Jun 16 low. The current pullback is still considered corrective and the trend outlook remains bullish.
EQUITIES: Defensives Outperform In Holiday-Thinned European Trade
- Japan's NIKKEI closed up 324.8 pts or +1.14% at 28871.78 and the TOPIX ended 11.78 pts higher or +0.6% at 1984.96. China's SHANGHAI closed down 0.801 pts or -0.02% at 3276.087 and the HANG SENG ended 134.76 pts lower or -0.67% at 20040.86.
- European equities are near session lows, though with holidays throughout Europe today, trading is unusually thin: defensives are leading (utilities, healthcare, consumer staples) with the German Dax up 18.39 pts or +0.13% at 13810.49, FTSE 100 up 14.41 pts or +0.19% at 7514.56, CAC 40 up 19.81 pts or +0.3% at 6570.59 and Euro Stoxx 50 up 8.75 pts or +0.23% at 3784.95.
- U.S. futures are a little softer, with the Dow Jones mini down 116 pts or -0.34% at 33602, S&P 500 mini down 17.25 pts or -0.4% at 4263.75, NASDAQ mini down 53.75 pts or -0.4% at 13524.
COMMODITIES: Copper Drops On Weak China Data
- WTI Crude down $1.95 or -2.12% at $90.13
- Natural Gas down $0.15 or -1.75% at $8.639
- Gold spot down $16.74 or -0.93% at $1787.1
- Copper down $7.35 or -2% at $358.9
- Silver down $0.32 or -1.54% at $20.5372
- Platinum down $18.8 or -1.95% at $950.27
| Date | GMT/Local | Impact | Flag | Country | Event |
| 15/08/2022 | 1230/0830 | ** |  | CA | Monthly Survey of Manufacturing |
| 15/08/2022 | 1230/0830 | ** | | CA | Wholesale Trade |
| 15/08/2022 | 1230/0830 | ** |  | US | Empire State Manufacturing Survey |
| 15/08/2022 | 1300/0900 | * | | CA | Home Sales – CREA (Canadian real estate association) |
| 15/08/2022 | 1400/1000 | ** | | US | NAHB Home Builder Index |
| 15/08/2022 | 1530/1130 | * | | US | US Treasury Auction Result for 13 Week Bill |
| 15/08/2022 | 1530/1130 | * | | US | US Treasury Auction Result for 26 Week Bill |
| 15/08/2022 | 2000/1600 | ** | | US | TICS |
| 16/08/2022 | 0600/0700 | *** |  | UK | Labour Market Survey |
| 16/08/2022 | 0900/1100 | *** |  | DE | ZEW Current Conditions Index |
| 16/08/2022 | 0900/1100 | *** | | DE | ZEW Current Expectations Index |
| 16/08/2022 | 0900/1000 | ** | | UK | Gilt Outright Auction Result |
| 16/08/2022 | 0900/1100 | * |  | EU | Trade Balance |
| 16/08/2022 | 1215/0815 | ** | | CA | CMHC Housing Starts |
| 16/08/2022 | 1230/0830 | *** | | CA | CPI |
| 16/08/2022 | 1230/0830 | *** | | US | Housing Starts |
| 16/08/2022 | 1255/0855 | ** | | US | Redbook Retail Sales Index |
| 16/08/2022 | 1315/0915 | *** | | US | Industrial Production |
Why MNI
MNI is the leading provider
of intelligence and analysis on the Global Fixed Income, Foreign Exchange and Energy markets. We use an innovative combination of real-time analysis, deep fundamental research and journalism to provide unique and actionable insights for traders and investors. Our "All signal, no noise" approach drives an intelligence service that is succinct and timely, which is highly regarded by our time constrained client base.Our Head Office is in London with offices in Chicago, Washington and Beijing, as well as an on the ground presence in other major financial centres across the world.