
Why MNI
MNI is the leading provider
of intelligence and analysis on the Global Fixed Income, Foreign Exchange and Energy markets. We use an innovative combination of real-time analysis, deep fundamental research and journalism to provide unique and actionable insights for traders and investors. Our "All signal, no noise" approach drives an intelligence service that is succinct and timely, which is highly regarded by our time constrained client base.Our Head Office is in London with offices in Chicago, Washington and Beijing, as well as an on the ground presence in other major financial centres across the world.
- US cash tsys sit 2-5bps cheaper across the major benchmarks, the 5s are leading the cheaps. The recent bear steepening impetus extended a touch in Asia. ACGBs (YM -6.0 & XM -12.0) sit with a bear-steepening of the futures curve. Pricing is slightly weaker after the employment data for September showed mixed results.
- The September data was impacted by some volatility in the labour force but Q3 averages are pointing to a gradual slowing in a consistently tight labour market, see below for more details. In the FX space, antipodeans are lower in today's Asian session, AUD extended losses after slowing Australian job growth with lower US Equity Futures and regional equities also weighing on sentiment.
- In Asia FX, USD/MYR hit fresh highs back to 1998, USD/IDR also broke higher ahead of the upcoming BI meeting.
- Later there are more Fed speakers including Chairman Powell but also Jefferson, Goolsbee, Barr, Bostic, Harker and Logan. On the data front there are US jobless claims, October Philly Fed and September existing home sales.
MARKETS
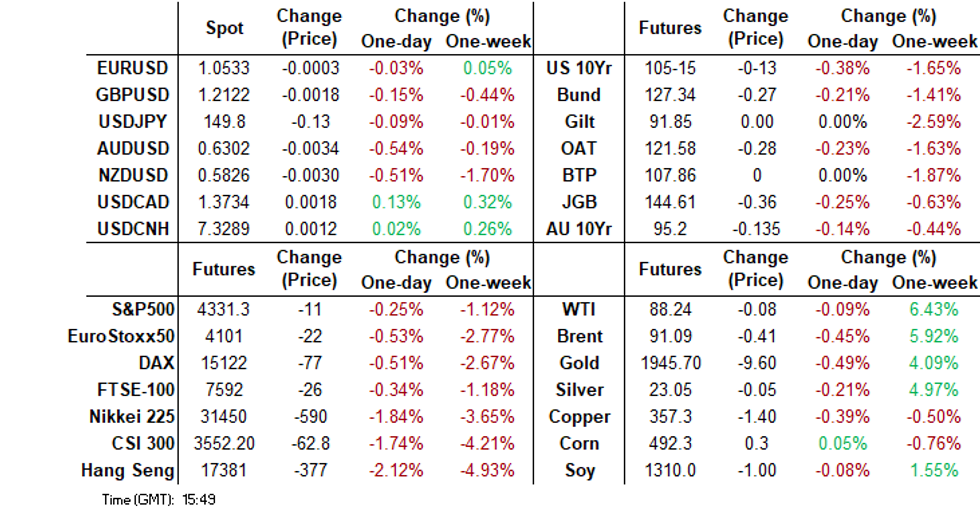
US TSYS: Cheaper On Thursday In Asia
TYZ3 deals at 105-15, -0-13, a 0-13 range has been observed on volume of ~163k.
- Cash tsys sit 2-5bps cheaper across the major benchmarks, the 5s are leading the cheaps.
- TY has continued to tick lower through the session, downside support 105-05+ the 2% DMA Envelope.
- The recent bear steepening impetus extended a touch in Asia. Tsys ticked lower through the session alongside lower US Equity Futures and the USD moving higher.
- The space looked through the Australian Employment Report, and little meaningful macro news flow crossed in the second half of the session.
- In Europe today the docket is thin, further out Fedpseak from Chair Powell headlines we also have Initial Jobless Claims and the Philadelphia Fed Business Outlook.
JGBS: Futures At Session Cheaps, Fresh Cycle High For 10Y Yield, CPI Data Tomorrow
JGB futures push to a fresh session low of 144.56, -41 compared to the settlement levels, in the Tokyo afternoon session.
- According to MNI's technical team, recent weakness has confirmed a resumption of the medium-term downtrend and paved the way for weakness towards 144.15, the Jan 13 low and major support. On the upside, clearance of 146.41, the Sep 4 high would instead highlight a base and a possible short-term reversal.
- There hasn’t been much in the way of domestic drivers to flag, outside of the previously outlined trade balance and international investment flow data.
- Accordingly, local participants have likely sought guidance from US tsys. So far in Asia-Pac dealings, US tsys have extended weakness in yesterday’s NY session. Cash US tsys are 2 to 5bps cheaper.
- Cash JGBs are cheaper, with the belly of the curve showing a relatively weaker performance led by the futures-linked 7-year (3.8bps cheaper). The benchmark 10-year yield is 3.4bps higher at 0.843%, just shy of the cycle high of 0.848% set earlier today.
- Swap rates are higher, with the belly also underperforming. Swap spreads are mixed across maturities.
- Tomorrow the local calendar sees National CPI data for September.
JAPAN DATA: Exports Surprise On The Upside, Led By Resilient US Demand
Japan September trade data was better than expected from an export standpoint. Export growth came in at 4.3% y/y (3.0% forecast and -0.8% prior). Imports were -16.3% y/y (forecast -12.7%, prior -17.7%). The trade balance printed a surplus ¥62.4bn, versus -¥451.5bn forecast and -¥937.8bn prior. In seasonally adjusted terms, the trade position was closer to expectations, -¥434.1bn, versus -¥553.7bn expected and -¥553bn prior.
- The better export picture was driven by firm y/y growth to both the US (+13.0%) and the EU (+12.9%). Car exports were a source of strength. Exports to China remained depressed (-6.2%y/y) and to the rest of Asia as well (-4.3%y/y). China's ban on food and fish related exports weighed on this segment (-58% y/y) per the MOF (RTRS)
- Broader export trends have more positive in North East Asia economies in September. Resilient export growth to the US also fits with the soft landing thesis.
JAPAN DATA: Offshore Appetite For Local Stocks & Bonds Recovers Further
Offshore appetite for Japan local equities and bonds recovered further last week. Offshore investors bought ¥1259.9bn of local stocks, only down slightly on the previous week's inflow pace. This follows outflow trends through much of August and September. Inflows into local bounds also rebounded, up ¥947.8bn, more than reversing the previous week's outflow.
- In terms of Japan outbound flows, local investors bought ¥794bn of offshore bonds. The pick-up in buying of overseas equities was more modest, up ¥178.6bn.
Table 1: Japan Weekly Investment Flows
| Billion Yen | Week ending October 13 | Prior Week |
| Foreign Buying Japan Stocks | 1259.9 | 1437.5 |
| Foreign Buying Japan Bonds | 947.8 | -643.7 |
| Japan Buying Foreign Bonds | 794.0 | 185.4 |
| Japan Buying Foreign Stocks | 178.6 | 45.2 |
Source: MNI - Market News/Bloomberg
AUSSIE BONDS: Cheaper, Employment Data Mixed, Curve Bear Steepens
ACGBs (YM -6.0 & XM -12.0) sit with a bear-steepening of the futures curve. Pricing is slightly weaker after the employment data for September showed mixed results. Employment growth printed lower than expected, while the unemployment rate was better than expected. In trend terms, average new jobs in Q3 were lower than Q2. The trend of slower full-time employment growth and higher part-time continued. Overall, the labour market remains tight but it is showing signs of easing.
- NAB quarterly business confidence next 3-mths printed -1 in Q3 from -4 in Q2, while business conditions next 3-mths showed 16 versus +17 in Q2.
- Local participants have also likely monitored ongoing weakness in US tsys, which has extended into today’s Asia-Pac session. Cash US tsys are 2 to 4bps cheaper.
- Cash ACGBs are 6-12bps cheaper, with the 3/10 curve steeper and the AU-US 10-year yield differential is 1bp lower at -19bps.
- Swap rates are 5-11bps higher, with EFPs tighter.
- The bills strip shows a bear-steepening, with pricing flat to -4.
- RBA-dated OIS pricing is little changed across meetings. A 43% chance of a 25bp hike at the November meeting is priced.
- Tomorrow, the local calendar is empty, with the next release being Judo Bank PMIs on Tuesday.
AUSSIE BONDS: 10Y Benchmark Yield At Its Highest Since 2011
The 10-year futures contract breached support today and is trading at a near-cycle low of 95.21.
- According to MNI’s technical team, the broader trend direction in the Aussie 10-year futures contract is down. The key support and the bear trigger at 95.660, the Aug 17 low, was breached. The break of this level reinforced a bearish theme and also confirmed the breach of major support at 95.670, the Jun 17 2022 low, marking a resumption of the medium-term downtrend.
- The cash ACGB 10-year yield has pushed to a high of 4.769% today, its highest level since 2011.
Figure 1: ACGB 10-Year Yield (%)

Source: MNI – Market News / Bloomberg
RBA: Signs Beyond Unemployment That Labour Market Has Turned
In June Governor Bullock spoke about the labour market and mentioned the key labour market variables that the central bank is monitoring which include the unemployment and underemployment rates and vacancies-to-unemployment ratio. The September data was impacted by some volatility in the labour force but Q3 averages are pointing to a gradual slowing in a consistently tight labour market. This data on its own is likely to mean that the RBA is on hold in September. Q3 CPI due on October 25 and updated staff forecasts will be key to the decision.
- In September, the unemployment rate fell 0.1pp to 3.6% due to unemployed people leaving the labour force. Unrounded the rate was 3.557%, so close to 3.5%. Looking through the volatility though it rose to an average of 3.7% in Q3 up marginally from 3.6% in Q2 but only 0.2pp higher than the October 2022 trough. Thus through the volatility the unemployment rate has been fairly stable since May 2022. (see MNI Look Through Volatility, Jobs Market Tight But Easing)
- The RBA has cited the underemployment rate as a sign that the labour market has turned. September was impacted by the labour force drop but is still 0.5pp lower than the February trough. The Q3 average was 0.1pp higher than Q2 but still low at 6.4%.

Source: MNI - Market News/ABS
- Q3 job vacancies fell 8.9% q/q resulting in the vacancies-to-unemployment ratio falling over 5pp to 73.1%, its lowest since Q4 2021 – another signal of an easing labour market.

Source: MNI - Market News/Refinitiv
AUSTRALIAN DATA: Look Through Volatility, Jobs Market Tight But Easing
Employment growth printed lower than expected while the unemployment rate was better than expected due to unemployed people leaving the labour force, according to the ABS. The data has been volatile and this development may be reversed next month and so best to look at the trends. Average new jobs in Q3 were lower than Q2 and the slower full-time employment growth and higher part-time trend continued. The labour market remains tight but it is showing signs of gradual easing and so this data points to the RBA on hold in November.
- Average new jobs in Q3 were 23.1k m/m down from Q2’s 29.9k and September employment growth remains robust though at 2.9% y/y but hours worked are now in line. The breakdown between full-time (FT) and part-time (PT) is showing some cracks. In Q3 there was a shift towards PT (+122.k) from FT (-53.2k) signalling slower labour demand but also less confidence in the activity outlook. FT hours fell on average 0.5% m/m in Q3 after +0.4% in Q2 while PT rose 1.1% after -0.1%. Total hours fell an average 0.3% m/m after +0.3%.

Source: MNI - Market News/ABS
- The unemployment rate almost printed at 3.5% in September as was 3.557% but the Q3 average was 3.7% up from 3.6%. The RBA forecast 3.9% for Q4 in August, which still looks feasible but may be slightly lower. The number of unemployed fell 19.8k in September but for Q3 it rose 16.7k after falling 5.7k and is up slightly this year.
- The ABS pointed to unemployed people leaving the labour force and this is reflected in the 0.1% m/m drop in the labour force, the first since the Covid-impacted September 2021. School holidays have created volatility this year and this data may have also been impacted. Labour force growth moderated to 2.8% y/y from 3.2% but the working age population continued to grow at 2.8% y/y. This resulted in the participation rate falling 0.2pp to 66.7% but Q3 was in line with Q2 overall.

Source: MNI - Market News/ABS
- The underemployment/underutilisation rates were also impacted by the drop in the labour force falling 0.2pp and 0.3pp respectively in September but Q3 rose 0.1pp and 0.2pp compared with Q2, also consistent with a slight easing in labour market conditions.
NZGBS: Curve Twist Steepens As Long End US Tsy Yields Push Higher
NZGBs experienced a noteworthy 12bp twist-steepening of the yield curve. Specifically, the 2-year benchmark closed 1bp richer, contrasting with the 11bp cheapening in the 10-year.
- With no significant domestic events today, the local market's primary focus was the continuation of the overnight weakness in US tsys during the Asia-Pacific session. During yesterday’s NY session, US tsys finished with yields 1 to 8bps higher, with the belly of the yield curve displaying weaker performance. In the ongoing Asia-Pacific session, cash US tsys are 1 to 4bps cheaper, contributing to a steeper yield curve.
- Technical issues within the YieldBroker tendering system prompted the NZ Debt Management to postpone today's bond auction. This development also helped direct focus to international markets. The rescheduled auction is now set to occur between 2:00 p.m. and 2:30 p.m. local time tomorrow.
- Swap rates closed 4-12bps higher, with the 2s10s curve steeper and implied swap spreads sharply wider.
- RBNZ dated OIS pricing closed unchanged across meetings out to Apr’24 and 1-2bps firmer beyond. Nevertheless, pricing remains 4-7bps softer than pre-CPI levels seen earlier in the week. Terminal OCR expectations were steady at 5.65%.
- Tomorrow, the local calendar will see the release of Trade Balance data for September.
NZ DATA: SEEK NZ Shows Significant Labour Market Easing, Wages Still High
SEEK NZ is reporting that job ads fell 2.3% m/m in September after rising 2.1% to be only 1.2% above January 2020. They are now down 25.2% y/y. This along with the applicants-to-ads ratio returning to the pandemic highs signals a significant easing in the labour market helped by the migration-driven increase in the labour supply. But this is yet to feed through to advertised salaries which were stronger in Q3 at 5.2% y/y. NZ Q3 labour market data are published on November 1.
- Applicants per job ad in August declined 4.4% m/m but are still up 156% y/y indicating a significant loosening in the labour market. SEEK NZ notes that the “balance of power” has moved away from workers to employers but this shift may have stabilised now.
- The decline in advertised vacancies was broad-based across regions with Auckland and Wellington now below pre-Covid levels. The decline was focused in the IT and admin sectors but demand for people in community services remains very strong.

Source: MNI - Market News/SEEK NZ
SEEK NZ advertised salary index y/y%

Source: MNI - Market News/SEEK NZ
FOREX: Antipodeans Pressured In Asia
The Antipodeans are lower in today's Asian session, AUD extended losses after slowing Australian job growth with lower US Equity Futures and regional equities also weighing on sentiment. The US Tsy curve has bear steepened. BBDXY is up ~0.1%.
- AUD/USD is down ~0.6% and sits a touch above the $0.63 handle. Technically the trend outlook is bearish, the pair is supported at $0.6286 low from Oct 3. Resistance is at $0.6445, high from Oct 11.
- Kiwi is also pressured, NZD/USD is ~0.5% and is sitting at a fresh cycle low at $0.5825/36. AUD/NZD ticked away from its 200-Day EMA and now sits marginally above the $1.08 handle.
- Yen is a touch firmer and is the strongest performer in G-10 this morning. USD/JPY is ~0.1% and has ticked away from the ¥150 handle. Resistance in USD/JPY remains at ¥150.16, Oct 3 high and bull trigger. Support is at the 20-Day EMA (¥148.74).
- Elsewhere in G-10 EUR and GBP are lower however ranges are narrow. NOK is down ~0.3% however liquidity is generally poor in Asia.
- The docket is light in Europe today, Fedpseak from Chair Powell headlines on Thursday.
EQUITIES: Asia Pac Equities Slump, China's CSI 300 Close To 2022 Lows
There are few positives in Asia Pac in Thursday trade to date. The major markets are down close to 2%. The combination of carry over from negative US/EU equity moves on Wednesday, coupled with higher US yields, continues to weigh on broader sentiment. US futures have dipped as the session progressed, Eminis now off around 0.20%, last near 4335. Nasdaq futures are off by -0.15%.
- Fresh highs in US yields, with the curve continuing to steepen is aiding USD sentiment and weighing on equity risk appetite. This comes ahead of a Powell speech in NY later on Thursday, which will be closely watched.
- The weakness continues in China equities. The CSI 300 sits off by a further 1.6% at the break, down near 3550 in index terms. Late October 2022 lows just under 3500 are within sight. September house prices fell -0.30% m/m, the same pace as August, although we saw a slightly larger number of cities record falls versus August (54 compared to 52 prior). The HSI is off nearly 2% at the break.
- Japan and South Korean stocks are down sharply. The Kospi -1.80%, slightly away from session lows. Broader tech related headwinds are weighing (offshore investors have sold $201.2mn of local equities so far today). As expected, the BoK held rates steady at 3.50%.
- Taiwan's Taiex is down modestly (-0.15%), outperforming regional trends.
- All markets in SEA are weaker, although losses are less than 1% for the most part (Singapore the exception).
OIL: Crude Lower As Sanctions Lifted On Venezuela, Biden Speaks Later
Oil prices are down slightly but are off their intraday lows. WTI is down 0.3% to $86.99/bbl (Dec contract) after a low of $86.60. Brent is 0.5% lower at $91.05 following a trough of $90.63. Risk appetite deteriorated further today over significant uncertainties in the Middle East. The USD index is 0.1% higher.
- The US has suspended some sanctions on Venezuelan oil but also gas and gold and issued 6-month licenses. They will only be renewed if the country meets its election commitments and releases political prisoners. This should result in an increase of around 25% to over 200kbd but there is uncertainty over how quickly Venezuela can boost production, according to Bloomberg. In 2019, exports to the US were almost 365kbd double what they were last month. The timing is important given rising tensions in the Middle East, sanctions on Russian crude and the 2024 US elections.
- US President Biden is due to speak later on the situation in Israel/Gaza which is likely to be another attempt to prevent the conflict spreading in the region. The oil market remains tight and appears to be in a holding pattern waiting to see if the situation deteriorates.
- Later there are more Fed speakers including Chairman Powell but also Jefferson, Goolsbee, Barr, Bostic, Harker and Logan. On the data front there are US jobless claims, October Philly Fed and September existing home sales.
GOLD: Surges With Geopolitical Risk Despite Higher Yields & USD
Gold is little changed in the Asia-Pac session, sitting close to an eleven-week high, after closing +1.3% at $1947.55 on Wednesday. Haven demand driven by geopolitical risk dominated a further climb for US Treasury yields and renewed USD strength.
- Indeed, higher government bond yields, in the face of rising geopolitical uncertainty, appear to have driven flows into alternative portfolio hedges like gold, which has rebounded more than 8% off the October lows.
- President Joe Biden wrapped up a 7.5-hour trip to Tel Aviv to signal full US backing for Israel but fell short of appeasing Arab leaders, who sided with Hamas-controlled Gaza authorities in blaming Israel for a blast at a hospital that allegedly killed hundreds.
- According to MNI’s technicals team, bullion cleared key resistance at $1953.0 (Sep 1 high) opening up $1965.5 (61.8% retrace of May 4 – Oct 6 bear leg). Indeed, Wednesday’s high of $1962.64 came close to this level before it was helped lower by headlines that Gaza humanitarian aid was being allowed to pass from Egypt.
INDONESIA: FX Likely Focus Of Upcoming BI Meeting At Time Of Weak Exports
USDIDR has broken out of the range around 15700 that it has been in for most of October and has jumped to 15848, which is likely to be the focus of Bank Indonesia’s discussion at its meeting today (see MNI BI Preview here). One of its tools to manage the currency are FX term deposits for export earnings which are increasingly being used but this week data showed that nominal export growth is very soft. Rupiah depreciation should help competitiveness but is a risk to import prices.
- Exports fell 16.2% y/y and excluding petroleum & gas -17.5% in September. This is likely to be a significant drag on nominal growth as exports were worth around 21% of GDP in 2022. Weaker commodity prices have weighed on export values with the terms of trade falling 6.7% y/y in June but improving over July/August.

Source: MNI - Market News/Refinitiv
- Indonesia’s shipments to its five largest destinations plus most of Asia have all been shrinking compared to a year ago since mid-year. China is the largest endpoint taking 23% of Indonesian exports last year worth almost 5% of GDP. Exports to the large Asian economy fell 15.9% y/y in September. The US is the second largest and shipments there fell 13.1% y/y while to Japan they contracted 35.6% y/y and India -14.1% (equal third). Exports to Europe collapsed 26.2% y/y.

Source: MNI - Market News/Refinitiv
- The trade surplus has come off its post-pandemic highs but remains at healthy levels due to imports contracting sharply too, but that may be a warning sign re the strength of domestic demand.
SOUTH KOREA: 1 Dissent On Hawkish BoK Outlook
BoK Governor Rhee noted the 5-1 board members were open to another hike in the next 3 months. This was down from the August policy meeting, where all 6 board members were open a to hike over this time horizon.
- This is the most dovish development in an otherwise hawkish hold from the BoK. It may signify the bar to any additional hike is quite high though. Still, the main consensus remains for the central bank to continue to judge whether rates need to be raised further.
- The central bank noted the upside risks to inflation "upside risks to inflation have increased due to the effects of higher global oil prices and exchange rates, and due to the Israel-Hamas conflict." "Looking ahead, it is forecast that consumer price inflation will fall to the lower-3% range at the end of this year and will continue to gradually moderate in 2024. " It also noted the downtrend in core inflation was likely to be more modest than previously forecast.
- Note the next CPI print is due on Nov 1.
- On the growth front "domestic economic growth is expected to improve gradually with the easing of the sluggishness in exports. GDP growth for the year is expected to be generally consistent with the August forecast of 1.4%." Uncertainties around the growth outlook are judged to be high given geopolitical risks and major economy developments.
ASIA FX: USD/Asia Pairs Higher, CNH & INR Outperform
Most USD/Asia pairs have tracked higher today, in line with broader EM weakness. The combination of higher US yields and weaker equity sentiment, is weighing on regional FX. CNH and INR Have outperformed. USD/MYR has hit fresh highs back to 1998. USD/IDR has broken above the 15800 level. Coming up is the BI meeting, no change is expected but the softer IDR is likely to be a focus point. Tomorrow delivers the China LPR decisions, no change is expected.
- USD/CNH has been relatively steady, outperforming the rest of the USD/Asia bloc. The pair was last near 7.3285, little changed for the session. The CNY fixing was steady, holding under 7.1800, with the fixing error widening to offset the firmer USD trend. House prices fell by 0.30% in September on par with the August fall. Local equities continue to fall quite sharply, the CSI 300 off 1.60% to 3550 in index terms, fresh lows back to November last year.
- 1 month USD/KRW sits just off session highs, last near 1356. Earlier highs were just above 1357. This was through Wednesday session highs, but saw little follow through. Pressure is evident from broader USD gains, and a slump in local equities. The Kospi isn't too far away from recent lows near 2400 in index terms. The on-hold BoK outcome didn't appear to impact KRW sentiment much. The majority of the board are still open to a rate hike. Market pricing for 6 months ahead looks little changed.
- Spot USD/IDR has broken above 15800, hitting fresh highs at 15850 (sitting just under this level in recent dealings ~15848). The rupiah is down 0.75% for the session so far, and at its weakest levels since April 2020. The 1 month NDF has also continued to climb last near 15860, down a further 0.30% versus NY closing levels. It is the weakest performer in EM Asia FX so far today. There doesn't appear to be any official pushback yet on this renewed weakness. It is likely to see focus on the BI meeting later and whether the central bank would turn hawkish again to curb FX weakness.
- The Rupee has opened dealing little changed from yesterday's closing levels in a muted start to Thursday's, USD/INR sits at 83.26/27. Narrow ranges continue to persist, the 20-Day EMA (83.1964) is providing support which rallies are capped ahead of 83.30. Equity Outflows by Foreign Investors have stabilised in recent sessions, the net outflow for October to the 17th now sits at $814mn.
- The Ringgit has been pressured in early dealing as US Tsy Yields tick higher. USD/MYR has printed a fresh cycle high at 4.7642 before marginally paring gains in recent dealing. The pair is at its highest level since 1998. Septembers Trade Surplus was a touch firmer than estimated printing at MYR24.52bn vs 21.70bn expected.
- The SGD NEER (per Goldman Sachs estimates) is little changed in early dealing on Thursday and sits a touch off the base of the recent ranges. The measure sits ~0.7% below the top of the band. Broader greenback trends have dominated flows for USD/SGD, the pair has firmed above the $1.37 handle rising ~0.5% from trough to peak yesterday. We sit at $1.3730/35, little changed from yesterday's closing levels. Looking ahead, the next data of note is Monday's September CPI print, an uptick in headline CPI to 4.2% Y/Y from 4.0% is expected.
- USD/PHP has risen but remains within recent ranges. The pair was last near 56.87, still wedged between 56.50/57.00. USD/THB is also higher, last tracking around 36.40, but this is still sub recent highs.
UP TODAY (TIMES GMT/LOCAL)
| Date | GMT/Local | Impact | Flag | Country | Event |
| 19/10/2023 | 0645/0845 | ** |  | FR | Manufacturing Sentiment |
| 19/10/2023 | 0645/0845 | * | | FR | Retail Sales |
| 19/10/2023 | 0800/1000 | ** |  | EU | EZ Current Account |
| 19/10/2023 | 1230/0830 | *** |  | US | Jobless Claims |
| 19/10/2023 | 1230/0830 | ** | | US | WASDE Weekly Import/Export |
| 19/10/2023 | 1230/0830 | * |  | CA | Industrial Product and Raw Material Price Index |
| 19/10/2023 | 1230/0830 | ** | | US | Philadelphia Fed Manufacturing Index |
| 19/10/2023 | 1300/0900 | | US | Fed Vice Chair Philip Jefferson | |
| 19/10/2023 | 1400/1000 | *** | | US | NAR existing home sales |
| 19/10/2023 | 1430/1030 | ** | | US | Natural Gas Stocks |
| 19/10/2023 | 1530/1130 | ** | | US | US Bill 04 Week Treasury Auction Result |
| 19/10/2023 | 1530/1130 | * | | US | US Bill 08 Week Treasury Auction Result |
| 19/10/2023 | 1600/1200 | | US | Fed Chair Jerome Powell | |
| 19/10/2023 | 1700/1300 | ** | | US | US Treasury Auction Result for TIPS 5 Year Note |
| 19/10/2023 | 1720/1320 | | US | Chicago Fed's Austan Goolsbee | |
| 19/10/2023 | 1730/1330 | | US | Fed Vice Chair Michael Barr | |
| 19/10/2023 | 2000/1600 | | US | Atlanta Fed's Raphael Bostic | |
| 19/10/2023 | 2130/1730 | | US | Philadelphia Fed's Pat Harker | |
| 19/10/2023 | 2240/1840 | | US | Dallas Fed's Lorie Logan |
Why MNI
MNI is the leading provider
of intelligence and analysis on the Global Fixed Income, Foreign Exchange and Energy markets. We use an innovative combination of real-time analysis, deep fundamental research and journalism to provide unique and actionable insights for traders and investors. Our "All signal, no noise" approach drives an intelligence service that is succinct and timely, which is highly regarded by our time constrained client base.Our Head Office is in London with offices in Chicago, Washington and Beijing, as well as an on the ground presence in other major financial centres across the world.