
Why MNI
MNI is the leading provider
of intelligence and analysis on the Global Fixed Income, Foreign Exchange and Energy markets. We use an innovative combination of real-time analysis, deep fundamental research and journalism to provide unique and actionable insights for traders and investors. Our "All signal, no noise" approach drives an intelligence service that is succinct and timely, which is highly regarded by our time constrained client base.Our Head Office is in London with offices in Chicago, Washington and Beijing, as well as an on the ground presence in other major financial centres across the world.
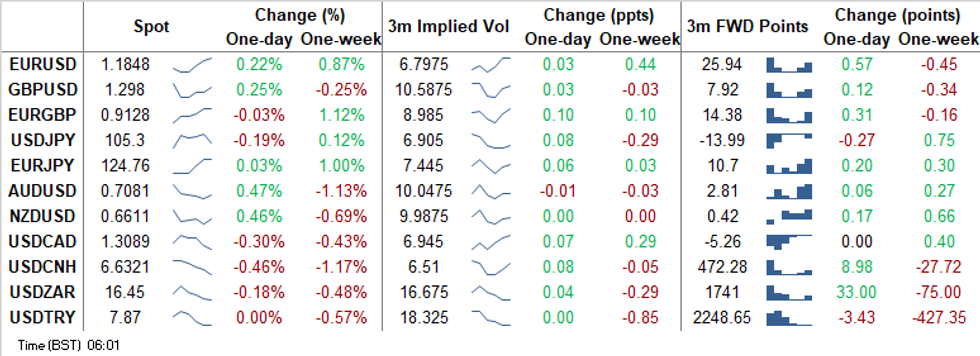
Risk-On Flows Dent Greenback, CNH & KRW Print Fresh Cycle Highs
Some optimistic signals on U.S. fiscal front and a spillover from Wall Street supported risk appetite, generating risk-on flows across G10 FX space. There was little in the way of fresh headline/data catalysts, with U.S. stimulus talks still taking centre stage. Commodity-tied FX picked up a bid, while safe havens lagged. The greenback underperformed all of its peers from the basket, with the DXY registering a one-month low.
- Greenback weakness helped some USD/Asia crosses fall to fresh cycle lows. USD/CNH sank through the CNH6.65 mark to its worst levels since Jul 2018 and a softer than expected PBoC fix failed to arrest the move. USD/KRW dipped to levels not seen since Apr 2019, as a continued recovery in South Korea's daily average exports bolstered the won, rendering it the best performer in the region.
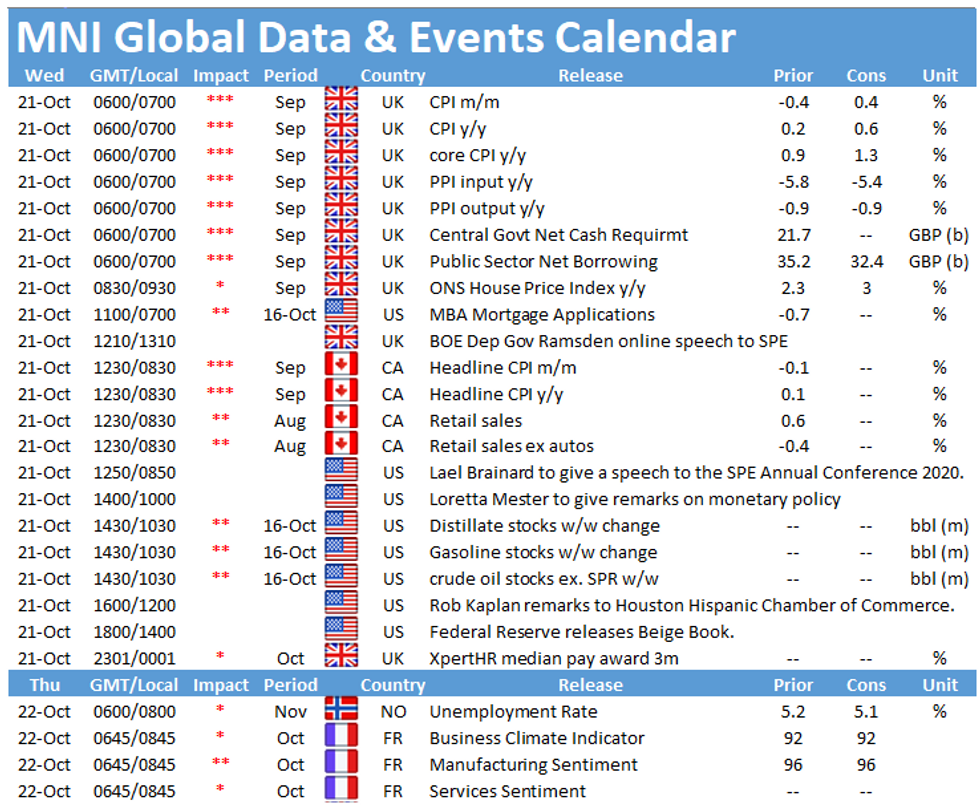
- On the radar today we have UK & Canadian inflation data, Canadian retail sales and comments from Fed's Mester, Kashkari, Kaplan, Barkin, Quarles & Bullard, ECB's Lagarde, de Guindos & Lane and BoE's Ramsden.
MNI TECHNICALS:
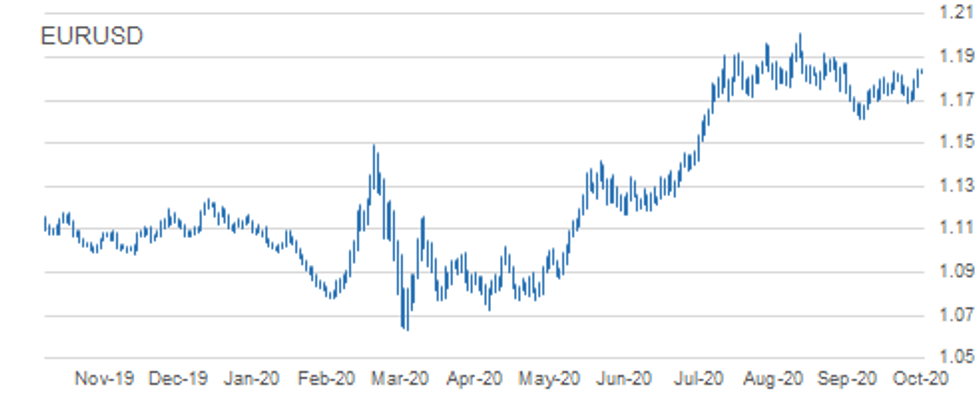
EUR/USD: Heading North
- RES 4: 1.1917 76.4% retracement of the Sep 1 - 25 sell-off
- RES 3: 1.1885 1.0% 10-dma envelope
- RES 2: 1.1872 High Sep 21
- RES 1: 1.1859 61.8% retracement of the Sep 1 - 25 sell-off
- PRICE: 1.1848 @ 05:55 BST Oct 21
- SUP 1: 1.1822 Intraday low
- SUP 2: 1.1760 Low Oct 20
- SUP 3: 1.1734 50-day EMA
- SUP 4: 1.1712 Trendline support drawn off the Sep 28 low
EURUSD maintains this week's positive tone and yesterday breached the bull trigger at 1.1831, Oct 9 high. The break higher, together with gains overnight in Asia, suggests scope for an extension towards 1.1859 initially and 1.1917 further out, both Fibonacci retracement levels. The major resistance and hurdle for bulls is at 1.2011, Sep 1 high. On the downside, initial firm support lies at 1.1760, yesterday's low.
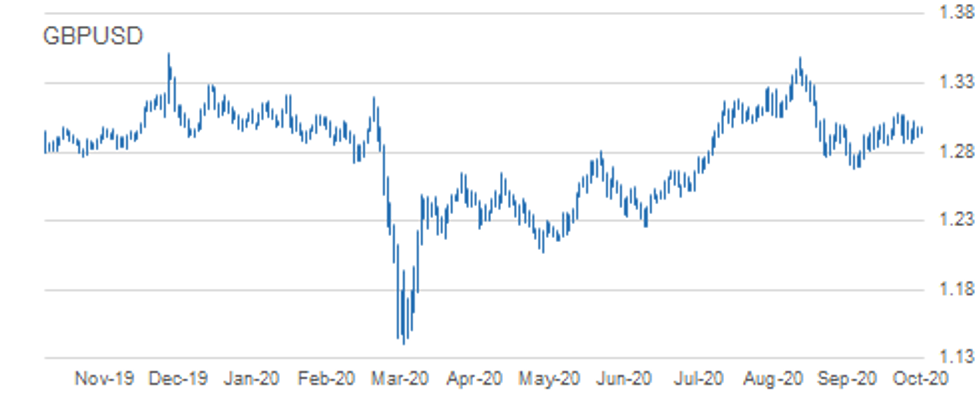
GBP/USD: Resistance Still Intact
- RES 4: 1.3210 Former trendline support drawn off the Mar 20 low
- RES 3: 1.3174 61.8% retracement of the Sep 1 - 23 sell-off
- RES 2: 1.3083 High Oct 12
- RES 1: 1.3030 High Oct 15
- PRICE: 1.2980 @ 06:00 BST Oct 21
- SUP 1: 1.2863 Low Oct 14 and key near-term support
- SUP 2: 1.2846 Low Oct 7
- SUP 3: 1.2806 Low Sep 30
- SUP 4: 1.2745 Low Sep 28
GBPUSD is largely unchanged and remains below the Oct 12 high of 1.3083. A break is needed to resume the recent uptrend that would open 1.3000 and 1.3210. The latter is the former trendline support drawn off the Mar 20 low. The trendline was breached on Sep 9 and a return above it is required to strengthen a bullish theme. Firm near-term support lies at 1.2863, Oct 14 low. A breach would signal a resumption of bearish pressure.
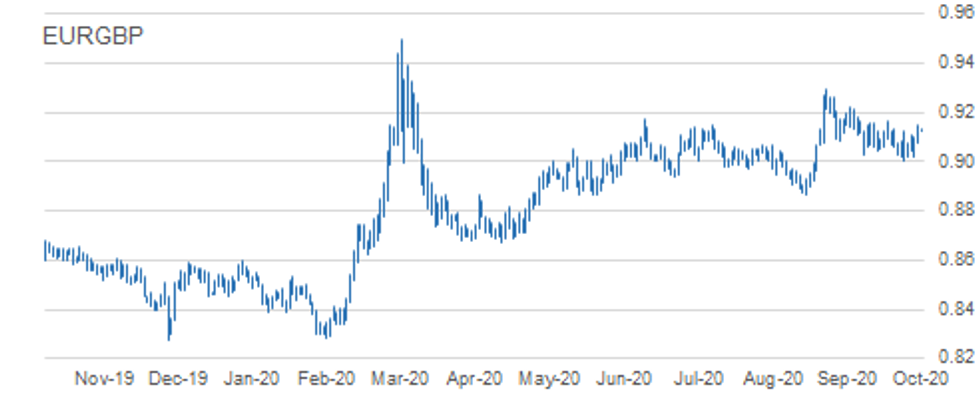
EUR/GBP: Trendline Break Counters Bearish Outlook
- RES 4: 0.9183 61.8% retracement of the Sep 11 - Oct 14 sell-off
- RES 3: 0.9169 1.0% 10-dma envelope
- RES 2: 0.9162 High Oct 7
- RES 1: 0.9149 Oct 20 high
- PRICE: 0.9128 @ 06:15 BST Oct 21
- SUP 1: 0.9071 50-day EMA
- SUP 2: 0.9007 Low Oct 14
- SUP 3: 0.9000 Round number support
- SUP 4: 0.8967 76.4% retracement of the Sep 3 - 11 rally
EURGBP technical conditions have improved for bulls following this week's gains. The break above 0.9122 yesterday, Oct 14 high confirms a clear break of trendline resistance drawn off the Sep 11 high turning the outlook more positive for now. Further gains would open 0.9162, Oct 7 high and 0.9183, a Fibonacci retracement. For bears to regain any momentum, the cross needs to break through the bear trigger at 0.9007, Oct 14 low.
USD/JPY: Bearish Theme Remains Intact
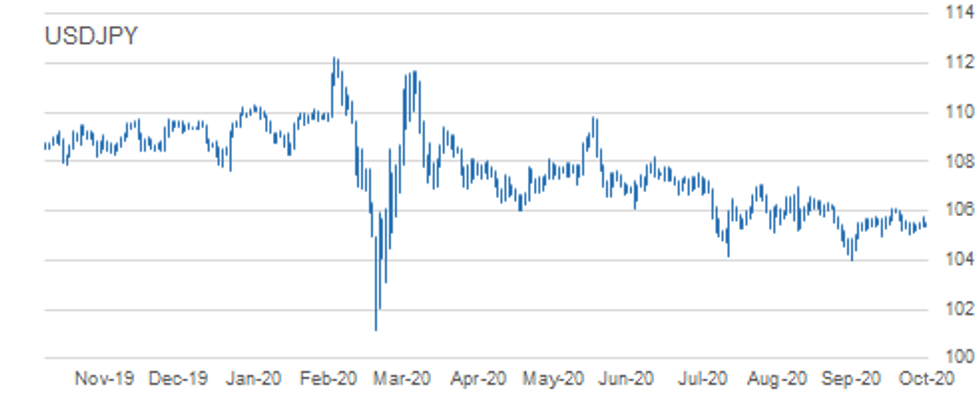
- RES 4: 106.95 High Sep 28
- RES 3: 106.41 Channel resistance drawn off Mar 24 high
- RES 2: 106.11/38 High Oct 7 and the bull trigger / High Sep 8
- RES 1: 105.73/75 50-dma / High Oct 20
- PRICE: 105.30 @ 06:19 BST Oct 21
- SUP 1: 105.04 Low Oct 14
- SUP 2: 104.94 Low Oct 2 and key near-term support
- SUP 3: 104.41 Low Sep 22
- SUP 4: 104.00 Low Sep 21 and the bear trigger
USDJPY is still trading above recent lows however despite this, the pair continues to display a softer tone. Intraday momentum studies still point south but to strengthen a bearish theme, price needs to trade below 104.94, Oct 2 low. This would open 104.00, Sep 21 low. The bull trigger is at 106.11, Oct 7 high where a break would instead resume bullish pressure. Initial resistance is at 105.73, the 50-dma.
EUR/JPY: Eyeing Resistance
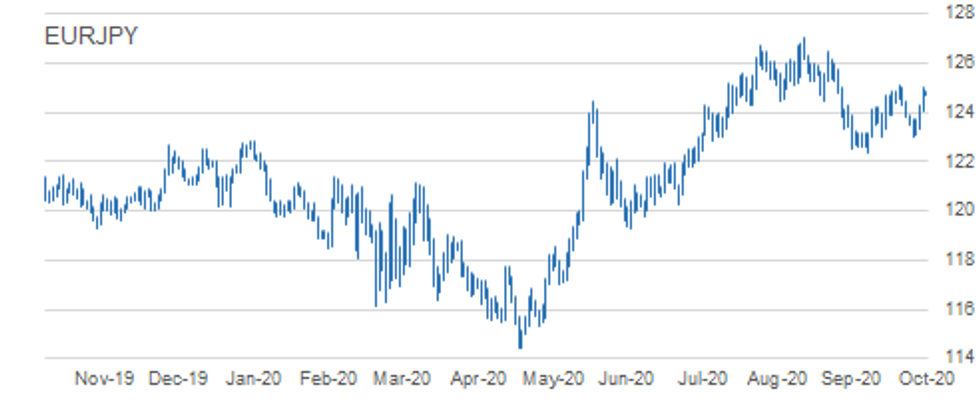
- RES 4: 126.46 High Sep 10
- RES 3: 125.97 76.4% retracement of the Sep 1 - 28 sell-off
- RES 2: 125.77 High Sep 15
- RES 1: 125.09/28 High Oct 9 / 61.8% of the Sep 1 - 28 sell-off
- PRICE: 124.74 @ 06:23 BST Oct 21
- SUP 1: 124.03 Low Oct 20
- SUP 2: 123.03/02 Low Sep 29 and Oct 2 / Low Oct 15
- SUP 3: 122.38/28 Low Sep 28 / 61.8% of the Jun 22 - Sep 1 rally
- SUP 4: 122.25 38.2% retracement of the May - Sep rally
EURJPY remains firm as the cross pulls away from support at 123.03/02, low prints between Sep 29 and Oct 15. Stronger gains through the 124.00 handle signal potential for an extension higher towards 125.09, Oct 9 high and the bull trigger. A break of 125.09 would open 125.28 and 125.97, both retracement levels. On the downside, a 123.03/02 breach is needed to trigger bearish pressure once again and open 122.38, Sep 28 low.
AUD/USD: Attention Is On Key Support
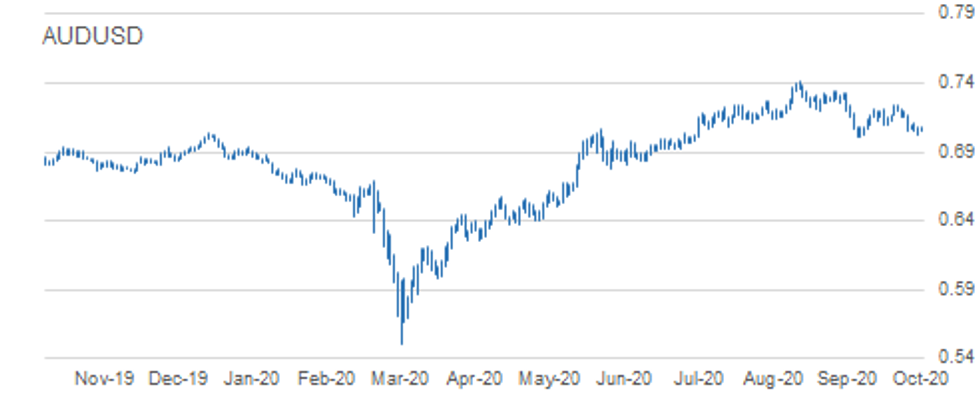
- RES 4: 0.7243 High Oct 10 and the intraday bull trigger
- RES 3: 0.7188 Trendline resistance drawn off the Sep 1 high
- RES 2: 0.7170 High Oct 15
- RES 1: 0.7115 High Oct 19
- PRICE: 0.7073 @ 06:27 BST Oct 21
- SUP 1: 0.7021 Low Oct 20
- SUP 2: 0.7006 Low Sep 25 and the bear trigger
- SUP 3: 0.6965 23.6% retracement of the Mar - Sep rally
- SUP 4: 0.6931 0.764 projection of Sep 1 - 25 sell-off from Oct 9 high
AUDUSD remains vulnerable and traded lower again Tuesday. On Oct 9, the pair cleared resistance at 0.7209, Oct 1 and 6 high resulting in a test of trendline resistance drawn off the Sep 1 high. The line intersects at 0.7188. The failure at the trendline is weighing on the Aussie and the scene is set for a deeper pullback. Attention is on the primary support and bear trigger at 0.7006, Sep 25 low. A trendline resistance is needed to alter the picture.
USD/CAD: Trades Through Support
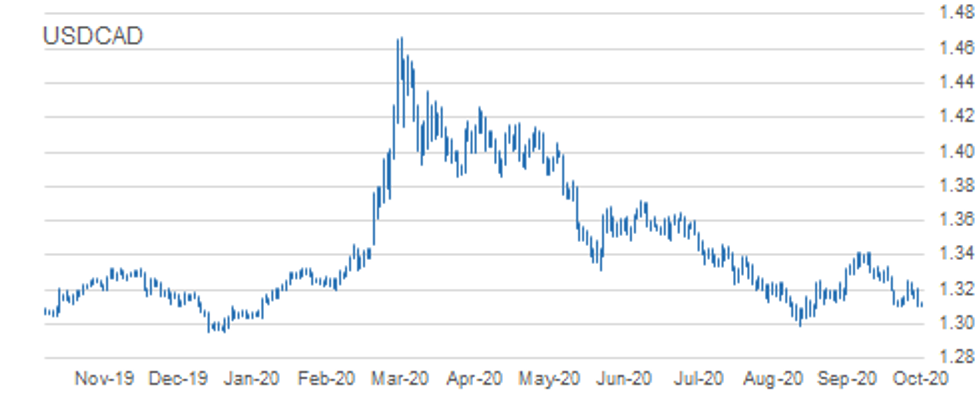
- RES 4: 1.3421 High Sep 30 and primary resistance
- RES 3: 1.3341 High Oct 7 and a reversal trigger
- RES 2: 1.3255/59 50-day EMA / High Oct 15 and the bull trigger
- RES 1: 1. 3210 20-day EMA
- PRICE: 1.3098 @ 06:39 BST Oct 21
- SUP 1: 1.3088 Intraday low
- SUP 2: 1.3047 Low Sep 7
- SUP 3: 1.3038 Low Sep 2
- SUP 4: 1.2994 Low Sep 1 and the major support
USDCAD bearish conditions dominate once again and the pair has weakened through key support at 1.3099, Oct 13 low. The move lower confirms a resumption of current downtrend that started off the 1.3421 high on Sep 30. Moving average conditions are bearish too reinforcing the current climate. Scope is for a move towards the major support at 1.2994, Sep 1 low. Key resistance has been defined at 1.3259, Oct 15 high.
MNI KEY LEVELS:
EUR/USD: MNI Key Levels
- $1.1966 Aug18 high
- $1.1929 Sep02 high
- $1.1912/17 Upper Boll Band (3%)/Sep10 high, 76.4% 1.2011-1.1612
- $1.1893/00 Upper 1.0% 10-dma env/Sep15 high
- $1.1872/82 Sep21 high/Sep16 high
- $1.1857/59 100-mma, Upper Boll Band (2%)/61.8% 1.2011-1.1612
- $1.1848 Intraday high, Cloud top
- $1.1845 ***CURRENT MARKET PRICE 05:16BST WEDNESDAY***
- $1.1822 Intraday low
- $1.1797/96 50-dma/55-dma
- $1.1767/60 200-hma/Oct20 low
- $1.1752/42 100-hma/21-dma
- $1.1703/94/89 Oct19 low/Oct16 low/Oct15 low
- $1.1685 Sep30 low, Sep25 high
- $1.1661/57 Sep29 low/Lower 1.0% 10-dma env
GBP/USD: MNI Key Levels
- $1.3098 Upper 1.0% 10-dma envelope
- $1.3082/83/91 Upper Boll Band (2%)/Oct12 high/Cloud top
- $1.3064/72 Oct14 high/Oct13 high
- $1.3030/31 Oct15 high/76.4% 1.3083-1.2863
- $1.3011/16/25 50-dma/55-dma/Oct19 high
- $1.2998 76.4% 1.3025-1.2911
- $1.2979/81 Intraday high, Oct20 high/61.8% 1.3025-1.2911
- $1.2976 ***CURRENT MARKET PRICE 05:25BST WEDNESDAY***
- $1.2973/70 200-hma/Cloud base
- $1.2951/43/41 50-mma/200-wma/100-hma
- $1.2940 Intraday low
- $1.2911 Oct20 low, 21-dma
- $1.2891 Oct19 low
- $1.2865/63 Oct16 low/Oct14 low
- $1.2849/46/39 100-dma/Oct07 low/Lower 1.0% 10-dma env
EUR/GBP: MNI Key Levels
- Gbp0.9292 Sep11 high
- Gbp0.9262 Upper 2.0% 10-dma envelope
- Gbp0.9220 Sep22 high
- Gbp0.9192 Upper Bollinger Band (3%)
- Gbp0.9171/81 Upper 1.0% 10-dma env/Sep24 high
- Gbp0.9157/59/62 Sep30 high/Upper Boll Band (2%)/Oct07 high
- Gbp0.9136/49 Intraday high/Oct20 high
- Gbp0.9128 ***CURRENT MARKET PRICE 05:36BST WEDNESDAY***
- Gbp0.9126 Intraday low
- Gbp0.9096/81/80 21-dma/100-hma/Oct20 low, 10-dma
- Gbp0.9079/71 Cloud top, Cloud base/200-hma
- Gbp0.9068/64 50-dma/55-dma
- Gbp0.9045 100-dma
- Gbp0.9026/23/17 Lower Boll Band (2%)/Oct19 low/Oct15 low
- Gbp0.9007/92 Oct14 low/Lower Boll Band (3%)
USD/JPY: MNI Key Levels
- Y105.85 Oct12 high
- Y105.75 Oct20 high
- Y105.74 55-dma
- Y105.70 50-dma
- Y105.54 Cloud Tenkan Sen
- Y105.53 Intraday high
- Y105.40/44/52 100-hma/200-hma/21-dma
- Y105.27 ***CURRENT MARKET PRICE 05:42BST WEDNESDAY***
- Y105.26 Intraday low
- Y105.09 Lower Bollinger Band (2%)
- Y105.06 Cloud Kijun Sen
- Y105.04 Oct14 low
- Y104.94 Oct02 low
- Y104.88 Sep23 low, Lower Boll Band (3%)
- Y104.41 Sep22 low, Lower 1.0% 10-dma env
EUR/JPY: MNI Key Levels
- Y125.29 Sep10 low
- Y125.23 Upper Bollinger Band (2%)
- Y125.21 200-wma
- Y125.09 Oct09 high
- Y125.03 Oct12 high
- Y125.00 Oct20 high
- Y124.81/84/93 50-mma/Intraday high
- Y124.76 ***CURRENT MARKET PRICE 05:48BST WEDNESDAY***
- Y124.74/70/67 55-dma/50-dma/Intraday low
- Y124.34 Oct19 high
- Y124.07 200-hma
- Y124.06 Cloud Tenkan Sen
- Y124.03 Oct20 low
- Y123.91 21-dma
- Y123.87 100-hma
AUD/USD: MNI Key Levels
- $0.7235/43/44 Sep22 high, Oct12 high/Oct09 high/200-wma, Upper Boll Band (2%)
- $0.7203/18 Upper 1.0% 10-dma env/Oct13 high
- $0.7191/97/99 Oct14 high/55-dma/50-dma
- $0.7168/70 Cloud base/Oct15 high
- $0.7123/24/32 Oct08 low/21-dma/200-hma
- $0.7103/15 100-dma/Oct19 high
- $0.7083 Intraday high
- $0.7080 ***CURRENT MARKET PRICE 05:53BST WEDNESDAY***
- $0.7076 100-hma
- $0.7060/47 Lower 1.0% 10-dma env/Intraday low
- $0.7021/08/06 Oct20 low/Lower Boll Band (2%)/Sep25 low
- $0.6989 Lower 2.0% 10-dma envelope
- $0.6973/63 Jul20 low/Jul16 low
- $0.6949 Lower Bollinger Band (3%)
- $0.6921/17 Jul14 low/Lower 3.0% 10-dma env
USD/CAD: MNI Key Levels
- C$1.3285 Upper 1.0% 10-dma envelope
- C$1.3259/73 Oct15 high/Oct08 high
- C$1.3238/46 Oct16 high/21-dma
- C$1.3202/04/13 50-dma/Oct20 high/55-dma
- C$1.3174/82 50-mma/100-hma
- C$1.3159/61/63 200-hma/200-wma/Cloud base
- C$1.3131 Intraday high
- C$1.3089 ***CURRENT MARKET PRICE 05:59BST WEDNESDAY***
- C$1.3089 Intraday low
- C$1.3042/38 Lower Boll Band (2%)/Sep02 low
- C$1.3022 Lower 1.0% 10-dma envelope
- C$1.2994 YTD low
- C$1.2976 Jan08 low
- C$1.2952/43 Dec31-2019 low/Lower Boll Band (3%)
- C$1.2917 Oct16-2018 low
OPTIONS: Expiries for Oct21 NY cut 1000ET (Source DTCC)
- EUR/USD: $1.1750-65(E851mln), $1.1800(E947mln), $1.1850-60(E662mln), $1.2000(E506mln)
- USD/JPY: Y105.00-10($1.9bln), Y105.45-50($1.5bln), Y105.90-106.00($2.4bln), Y106.65($1.0bln)
- EUR/GBP: Gbp0.9165-75(E520mln), Gbp0.9350(E578mln-EUR calls)
- AUD/USD: $0.6900(A$847mln), $0.7220(A$598mln), $0.7600(A$1.1bln)
- USD/CAD: C$1.3000($800mln-USD puts)
- USD/CNY: Cny6.7000($500mln)
Larger Option Pipeline
- EUR/USD: Oct22 $1.1600-10(E1.7bln), $1.1644-50(E2.0bln), $1.1665-85(E1.3bln), $1.1795-00(E1.4bln); Oct23 $1.1840-50(E1.3bln), $1.2000(E1.4bln); Oct26 $1.1500(E1.8bln), $1.1650-60(E1.6bln); Oct28 $1.1800-05(E1.4bln), $1.2000-05(E2.1bln); Oct30 $1.1800(E1.1bln), $1.1850-60(E1.2bln), $1.1950(E1.1bln-EUR calls)
- USD/JPY: Oct22 Y104.00-10($1.6bln), Y104.50-55($2.1bln), Y104.95-105.00($1.1bln), Y105.40-50($1.1bln) Y105.80-106.00($2.7bln), Oct23 Y103.00($1.3bln); Oct26 Y103.95-104.00($1.5bln-USD puts), Y105.30-40($1.6bln), Y105.60-75($1.2bln), Y106.95-107.00($1.6bln); Oct27 Y105.00($1.2bln), Y106.00-05($1.2bln); Oct28 Y105.00($1.1bln); Oct29 Y105.55-65($2.1bln), Y106.00($1.2bln); Oct30 Y104.50($1.9bln), Y104.80-85($1.1bln), Y106.00-05($2.2bln)
- EUR/JPY: Oct26 Y122.80(E1.2bln)
- GBP/USD: Oct23 $1.3090-1.3100(Gbp936mln-GBP calls)
- EUR/GBP: Oct26 Gbp0.8900(E880mln), Gbp0.9000(E1.8bln-EUR puts)
- AUD/USD: Nov02 $0.7140-45(A$1.3bln)
- AUD/JPY: Oct22 Y76.44(A$2.1bln); Oct29 Y73.20(A$1.0bln-AUD puts), Y76.35-40(A$2.4bln-AUD calls)
- AUD/NZD: Oct27 N$1.0809-20(A$2.5bln); Oct30 N$1.0750(A$1.2bln)
Why MNI
MNI is the leading provider
of intelligence and analysis on the Global Fixed Income, Foreign Exchange and Energy markets. We use an innovative combination of real-time analysis, deep fundamental research and journalism to provide unique and actionable insights for traders and investors. Our "All signal, no noise" approach drives an intelligence service that is succinct and timely, which is highly regarded by our time constrained client base.Our Head Office is in London with offices in Chicago, Washington and Beijing, as well as an on the ground presence in other major financial centres across the world.